Earnings season is the Super Bowl of options trading. Four times a year, hundreds of companies report quarterly results, and the options market goes into overdrive. Implied volatility spikes. After-hours gaps create overnight fortunes and losses. Retail traders scramble to figure out which names to play and which to avoid.
Here is the problem: on a single night like January 28, 2026, four mega-cap companies (TSLA, META, MSFT, IBM) all report after the bell. Each has different IV levels, different options flow, different liquidity profiles. How do you quickly assess all four and decide where conditions are favorable?
Most traders rely on gut feeling or a single metric like implied volatility. That is not enough. You need a framework that evaluates multiple dimensions simultaneously and tells you not just whether to trade, but how conditions favor different strategies.
The Earnings Challenge
Earnings season creates a unique set of problems for options traders:
- IV Crush: Implied volatility is elevated before earnings and collapses immediately after the announcement. If you bought options at inflated IV, you can be right on direction and still lose money.
- Directional Uncertainty: Nobody knows which way the stock will move. Beating estimates doesn't guarantee a rally. Missing estimates doesn't guarantee a drop.
- After-Hours Gaps: The stock moves in extended hours when most options can't be traded. By the time the market opens, the opportunity (or damage) is already done.
- Multiple Simultaneous Events: On busy earnings nights, several major companies report at once. You can't deeply analyze all of them in real time.
The scoring system doesn't try to predict which way earnings will go. Instead, it assesses the conditions around each stock's options market so you can make more informed decisions about whether and how to engage.
Case Study: January 28, 2026
On the evening of January 28, 2026, four of the most heavily traded stocks in the options market all reported earnings after market close:
- Tesla (TSLA) - $430.90 at the close
- Meta Platforms (META) - $672.97 at the close
- Microsoft (MSFT) - $480.58 at the close
- IBM - $293.86 at the close
Pre-Earnings Scorecards at a Glance
| Ticker | Value | Sentiment | Activity | Liquidity | Timing | Overall Read |
|---|---|---|---|---|---|---|
| TSLA | 69 | 65 | 89 | 81 | 24 | IV elevated, unusual activity, imminent event risk |
| META | 46 | 68 | 58 | 91 | 47 | Bullish flow, excellent liquidity, elevated activity |
| MSFT | 49 | 65 | 46 | 85 | 62 | No clear edge detected, neutral conditions |
| IBM | 67 | 51 | 7 | 31 | 8 | High value but low activity and poor liquidity |
What Actually Happened After Hours
| Ticker | Close (1/28) | After-Hours Price | After-Hours Move | Next Day Close (1/29) |
|---|---|---|---|---|
| TSLA | $430.90 | $443.99 | +3.0% | $431.46 |
| META | $672.97 | $730.18 | +8.5% | $668.73 |
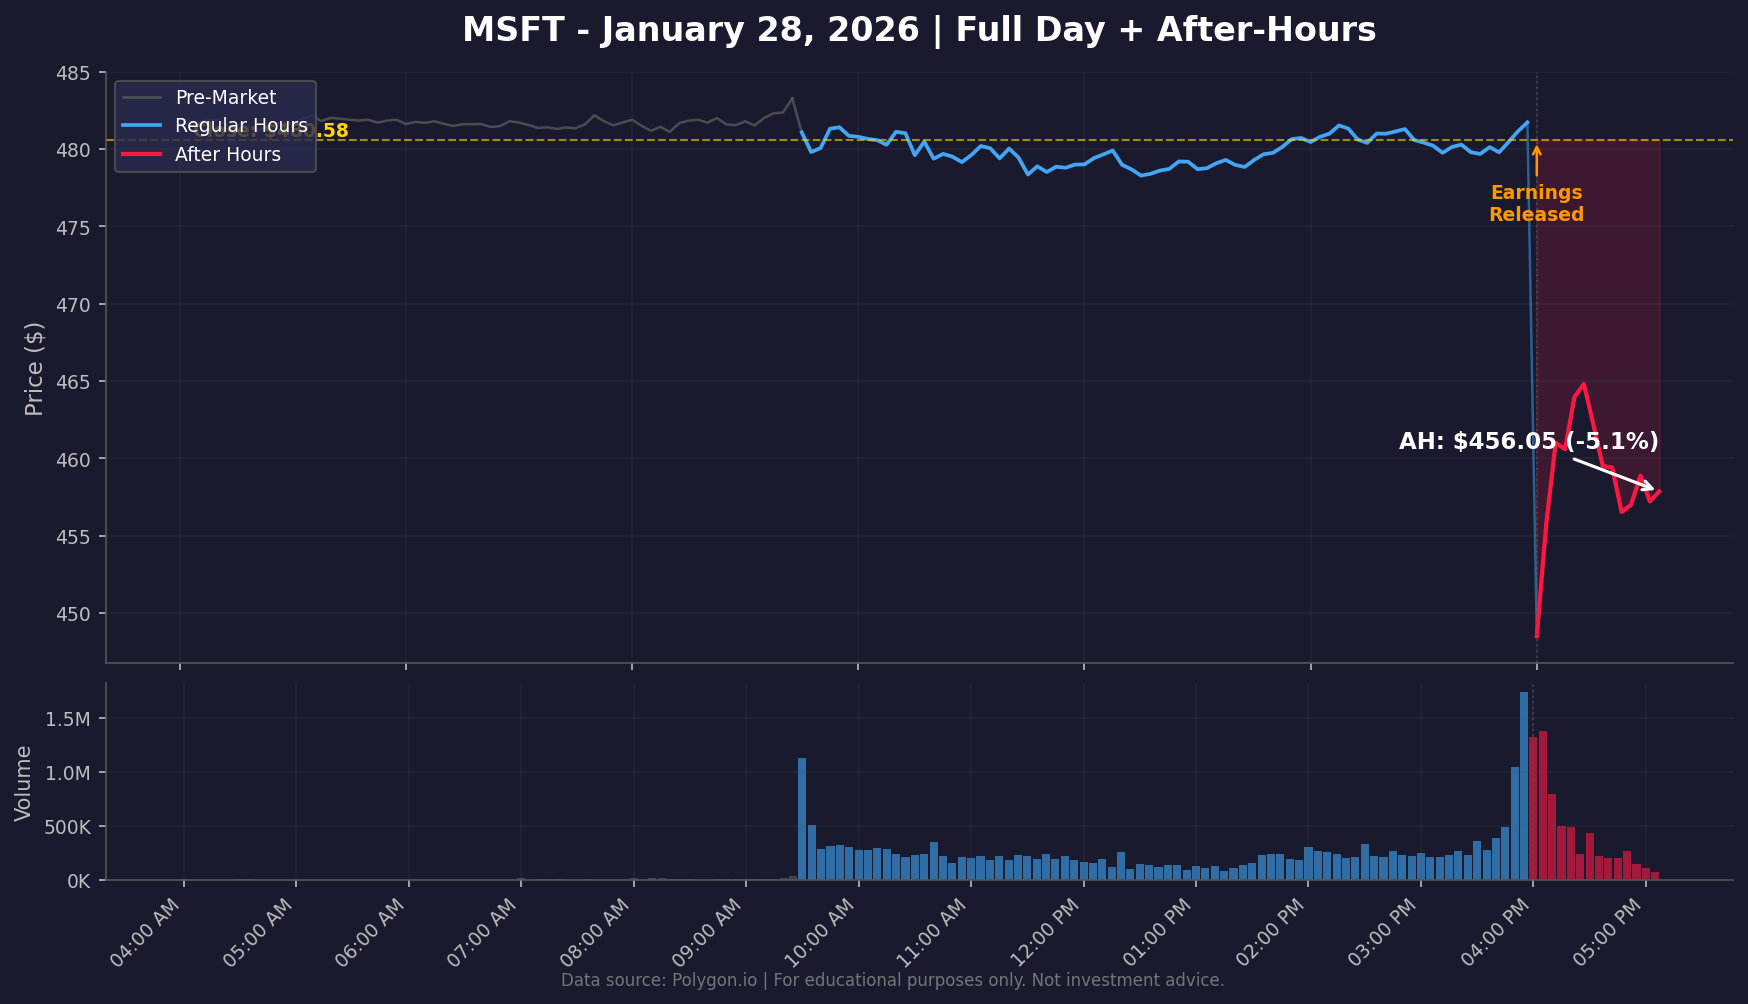
| MSFT | $480.58 | $456.05 | -5.1% | $481.63 |
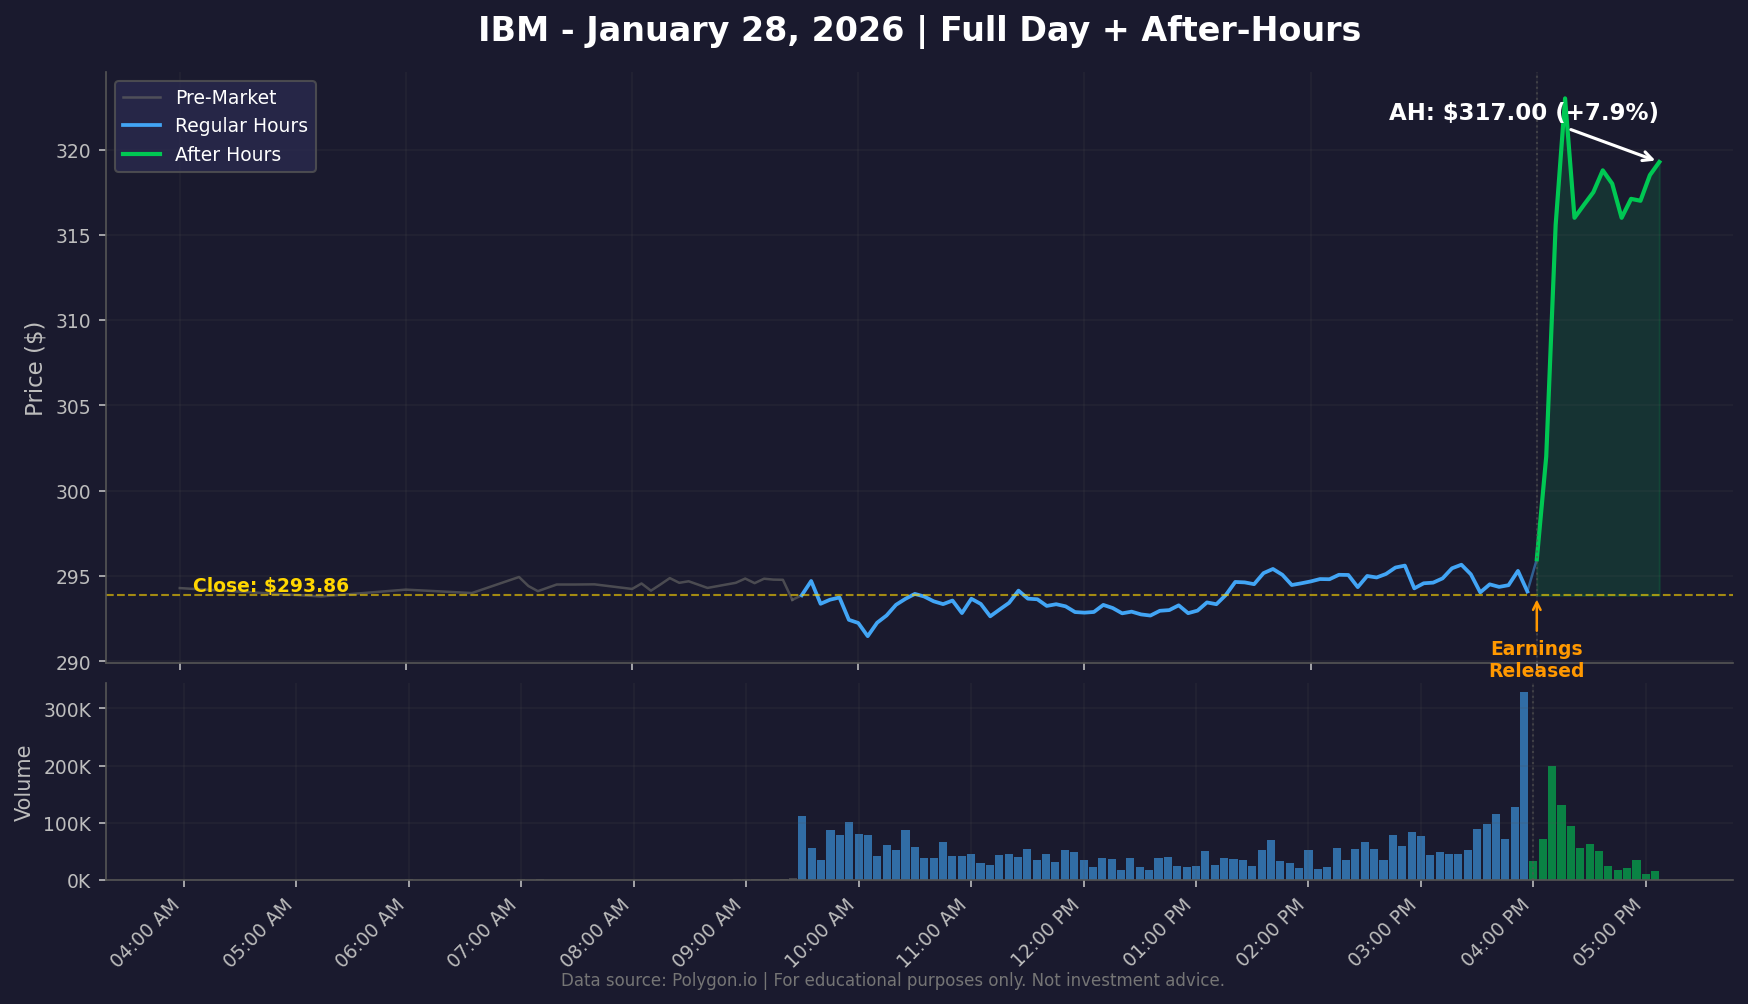
| IBM | $293.86 | $317.00 | +7.9% | $294.16 |
All four stocks moved significantly after hours. But the next day tells a different story: META and IBM gave back most of their after-hours gains, while MSFT recovered nearly all of its drop. This is exactly the kind of volatility the scoring system is designed to help you navigate.
IBM: The Quiet Setup That Exploded
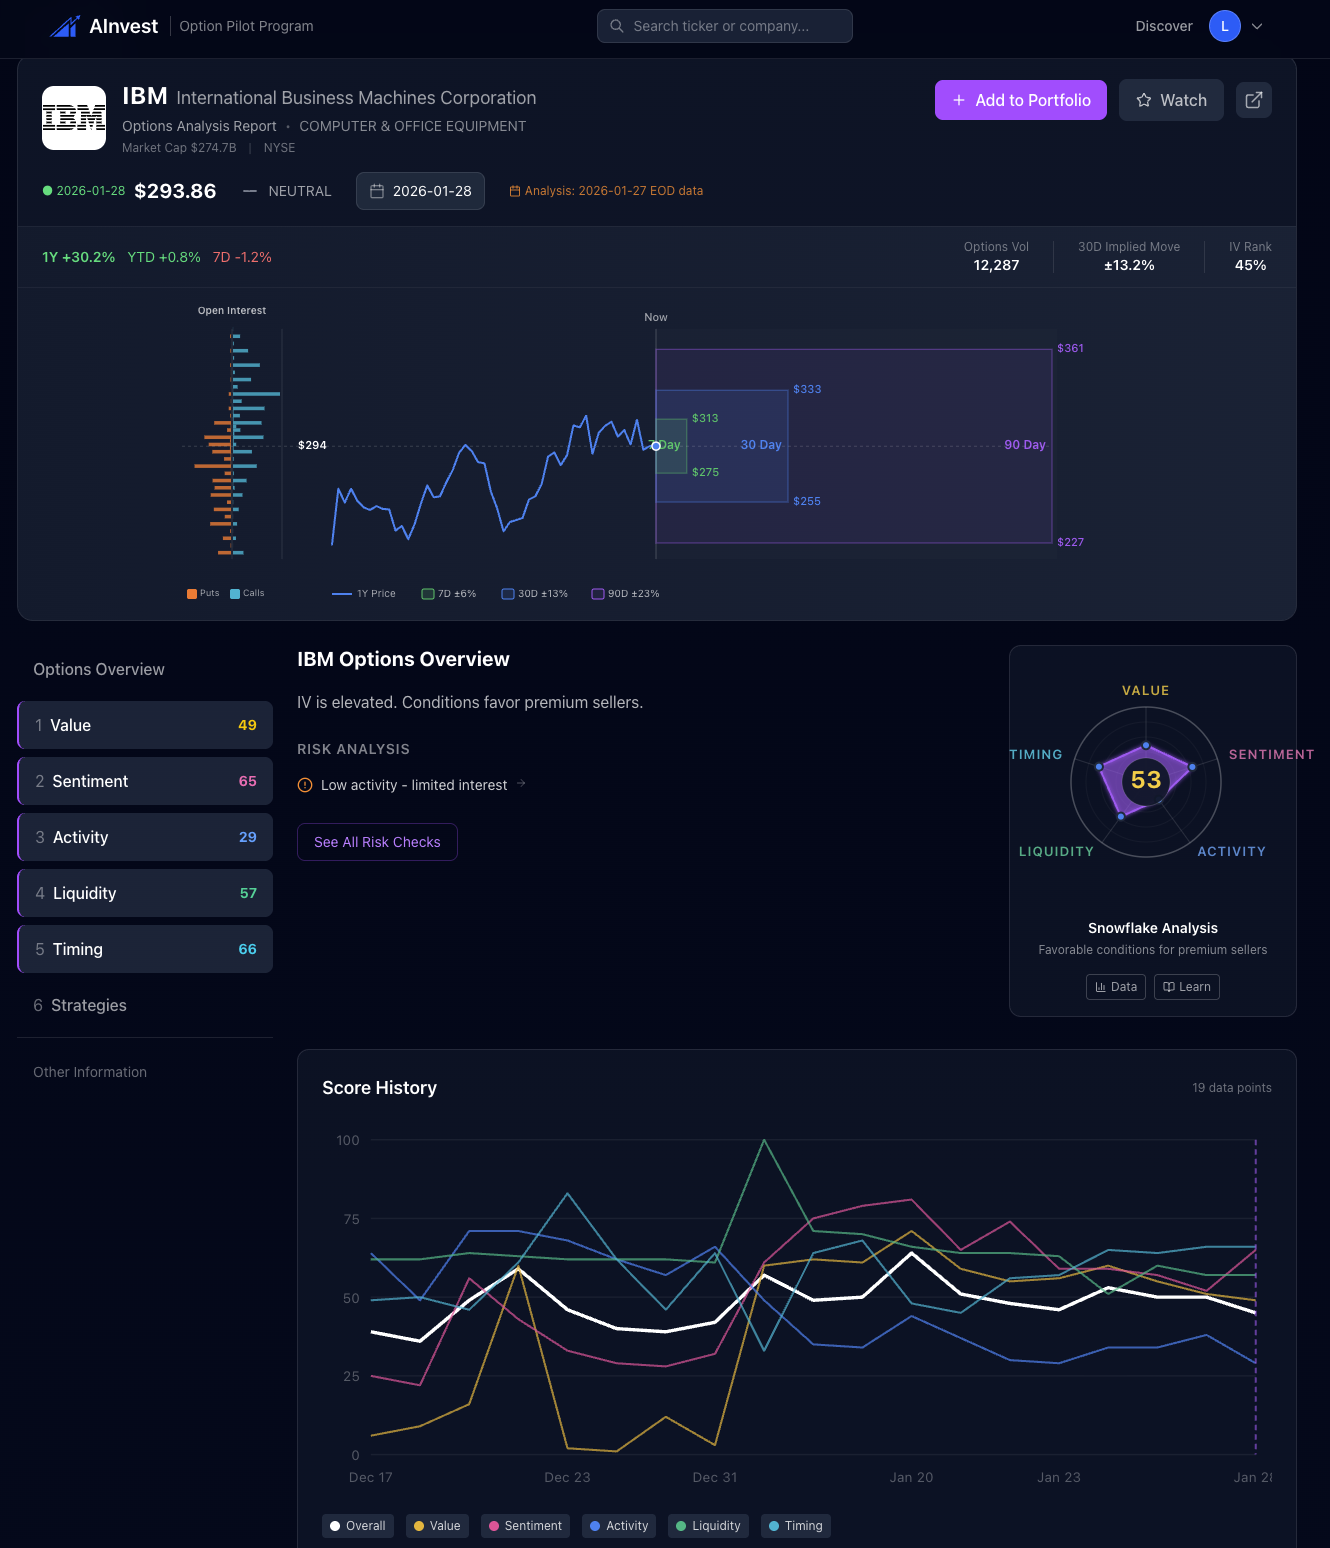
Pre-Earnings Scores: Value 67 | Sentiment 51 | Activity 7 | Liquidity 31 | Timing 8
IBM's scorecard was fascinating. The Value score of 67 indicated that implied volatility was elevated relative to IBM's own history, creating conditions that favor premium sellers. Meanwhile, the Activity score of 7 was nearly flatlined. Almost no unusual options activity. The options market was quiet on IBM heading into earnings.
The Liquidity score of 31 was a clear warning: IBM's options spreads are wider than mega-cap peers. Trading costs would eat into any strategy. The Timing score of 8 was the lowest of all four stocks, correctly flagging that earnings were imminent.
IBM surged +7.9% after hours, jumping from $293.86 to $317.00.
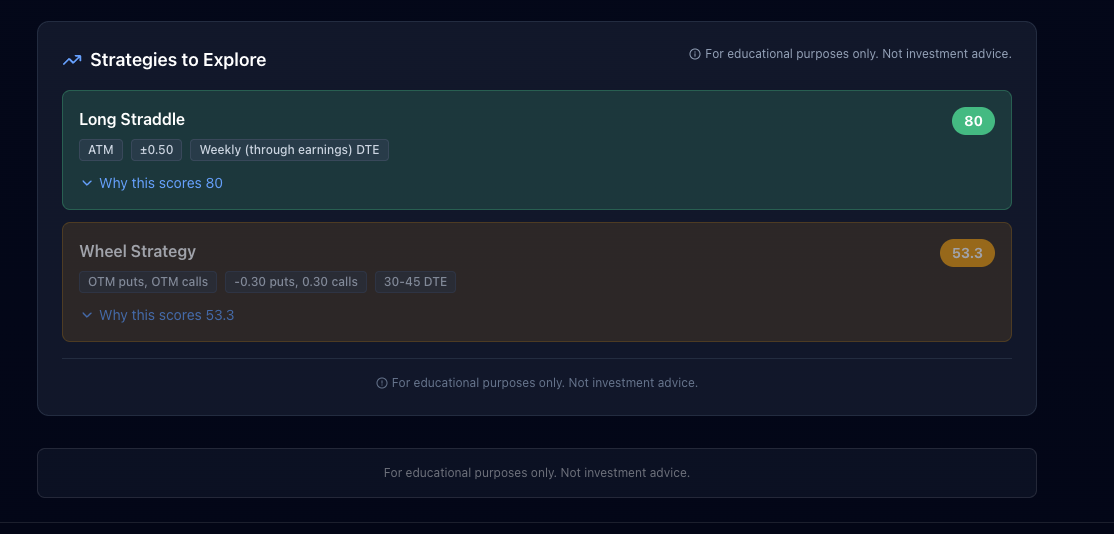
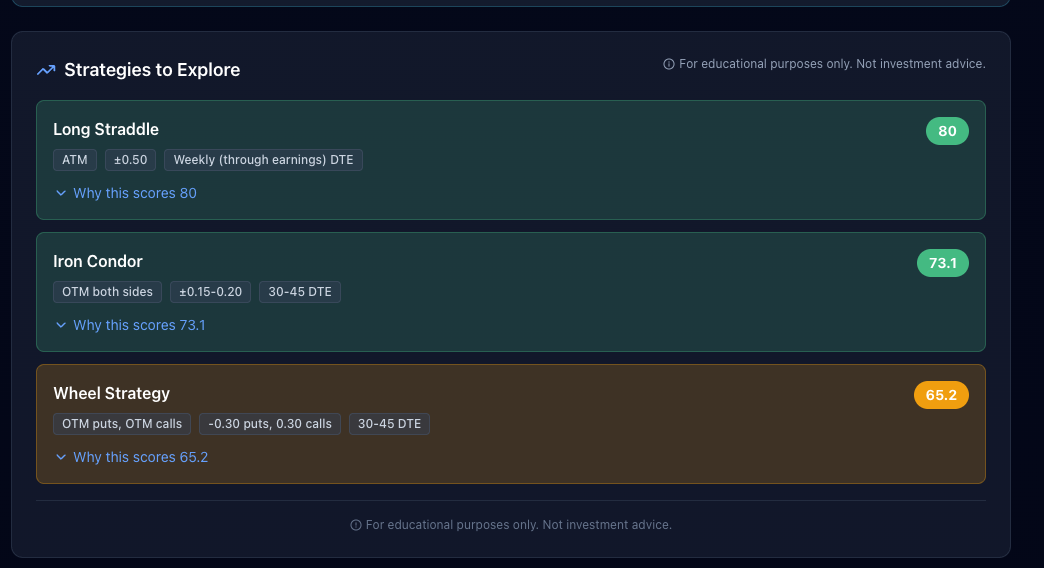
The top strategy bias was Long Straddle (score: 80), which profits from a large move in either direction. Given elevated IV and imminent earnings, the system identified that conditions favored a big move.
Key insight: The system didn't predict IBM would rally 7.9%. It identified that conditions favored volatility strategies. But the low Liquidity score (31) was a real warning: execution costs would have been meaningful.
META: Bullish Flow Plus Best Liquidity
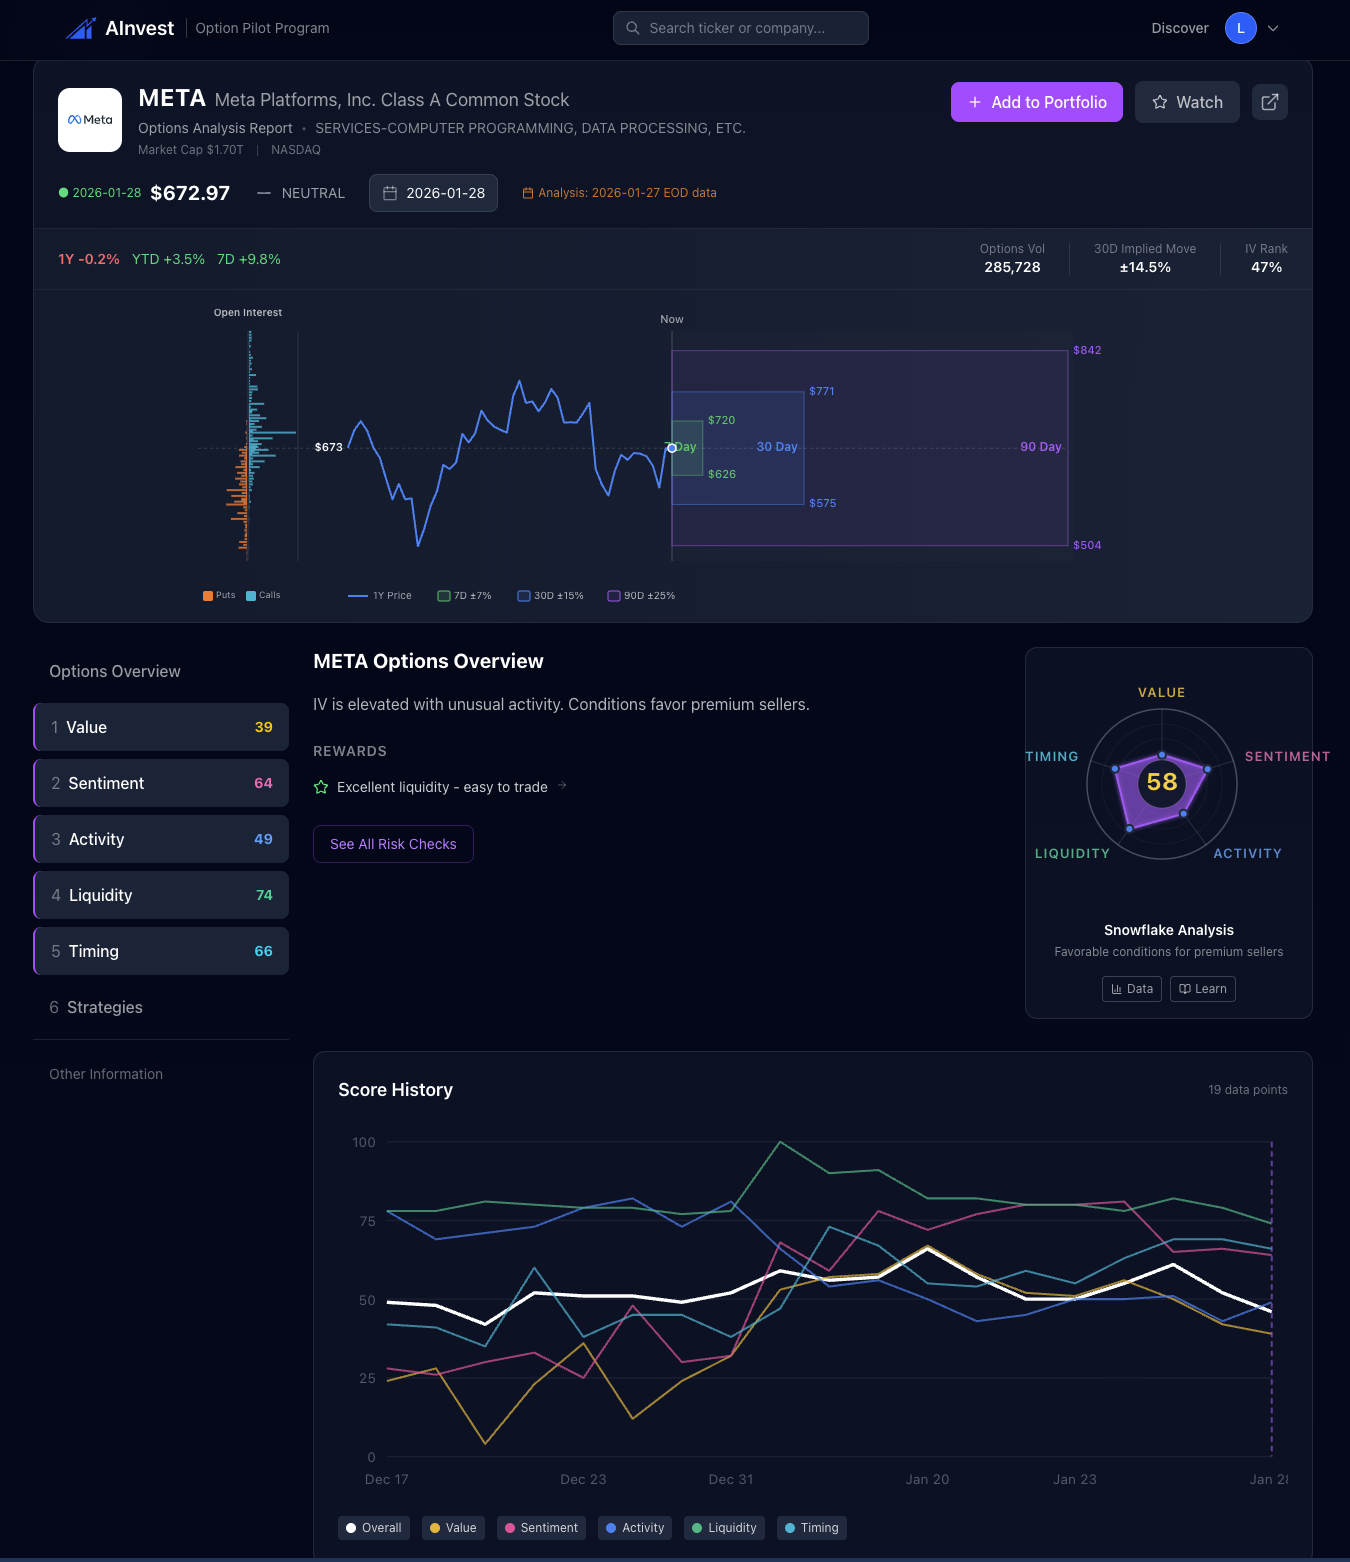
Pre-Earnings Scores: Value 46 | Sentiment 68 | Activity 58 | Liquidity 91 | Timing 47
META presented the most balanced scorecard. The standout was Liquidity at 91, the highest score across all tickers. META's options had tight bid-ask spreads, deep open interest, and multiple liquid expirations. Whatever strategy you chose, execution would be efficient.
The Sentiment score of 68 leaned bullish. Options flow showed more call activity than put activity, with reasonable conviction quality.
META surged +8.5% after hours but by the next day's close had pulled back to $668.73, finishing below the previous close.
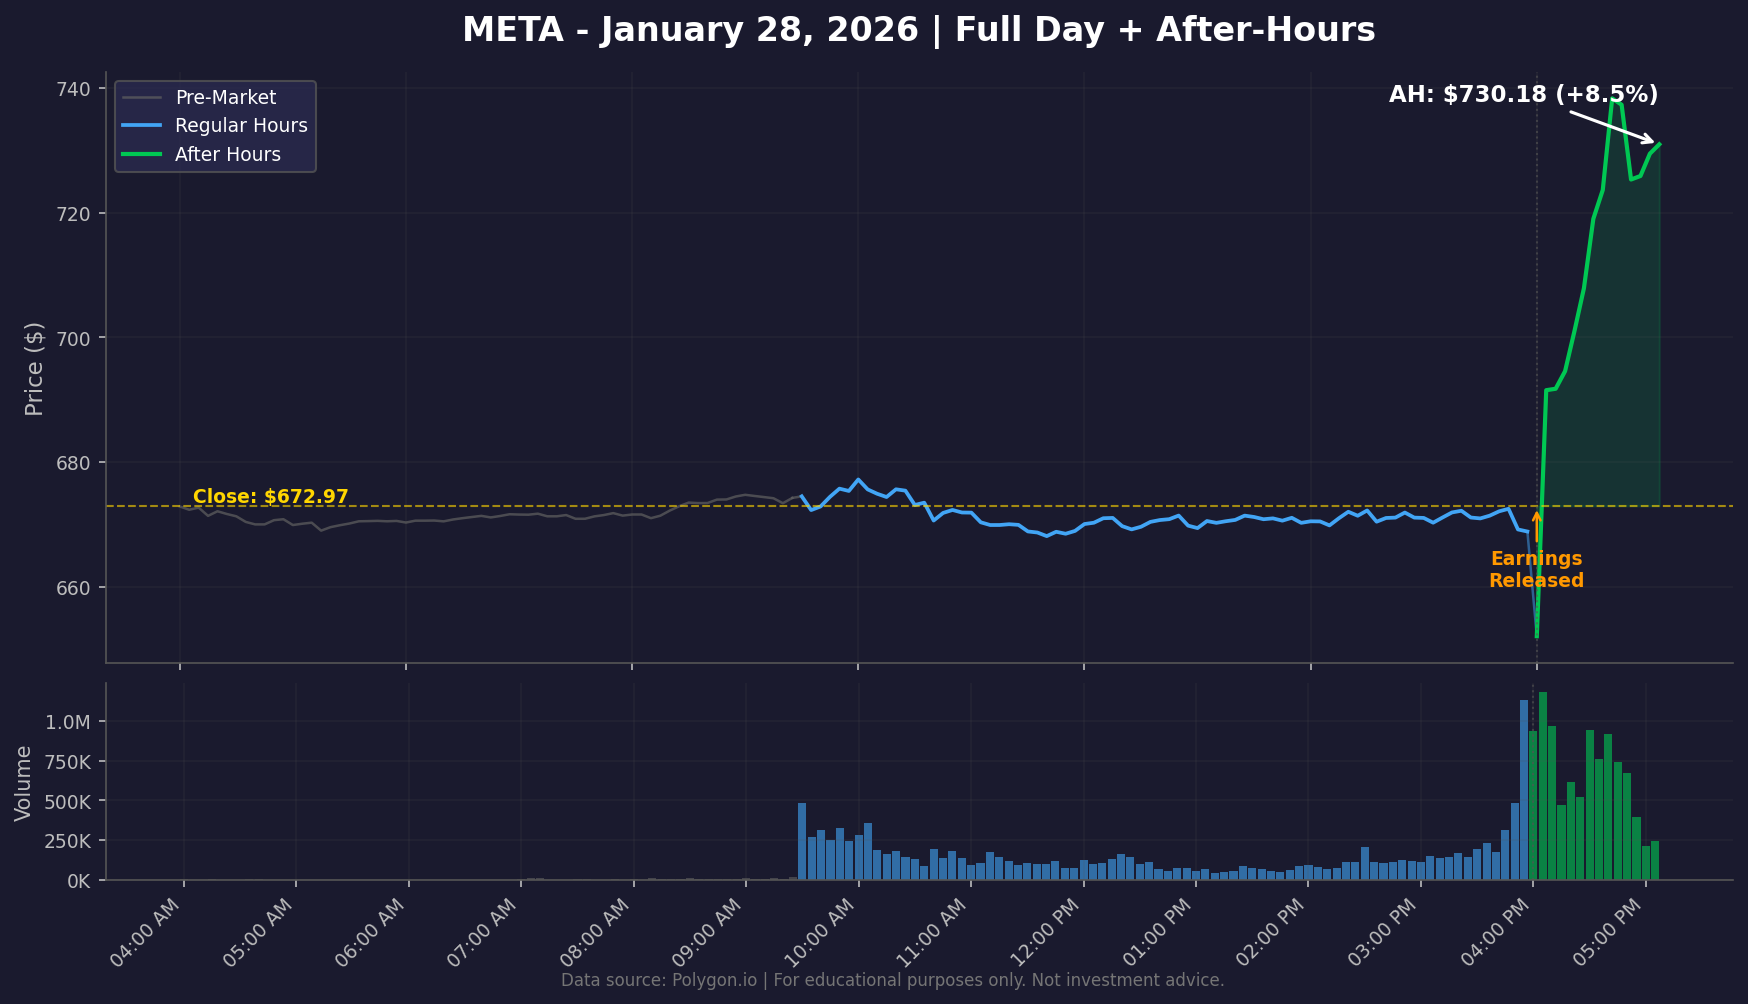
The bullish Sentiment score aligned with the initial reaction, but the full reversal demonstrates why earnings reactions are complex.
MSFT: "No Clear Edge" Was the Most Honest Call
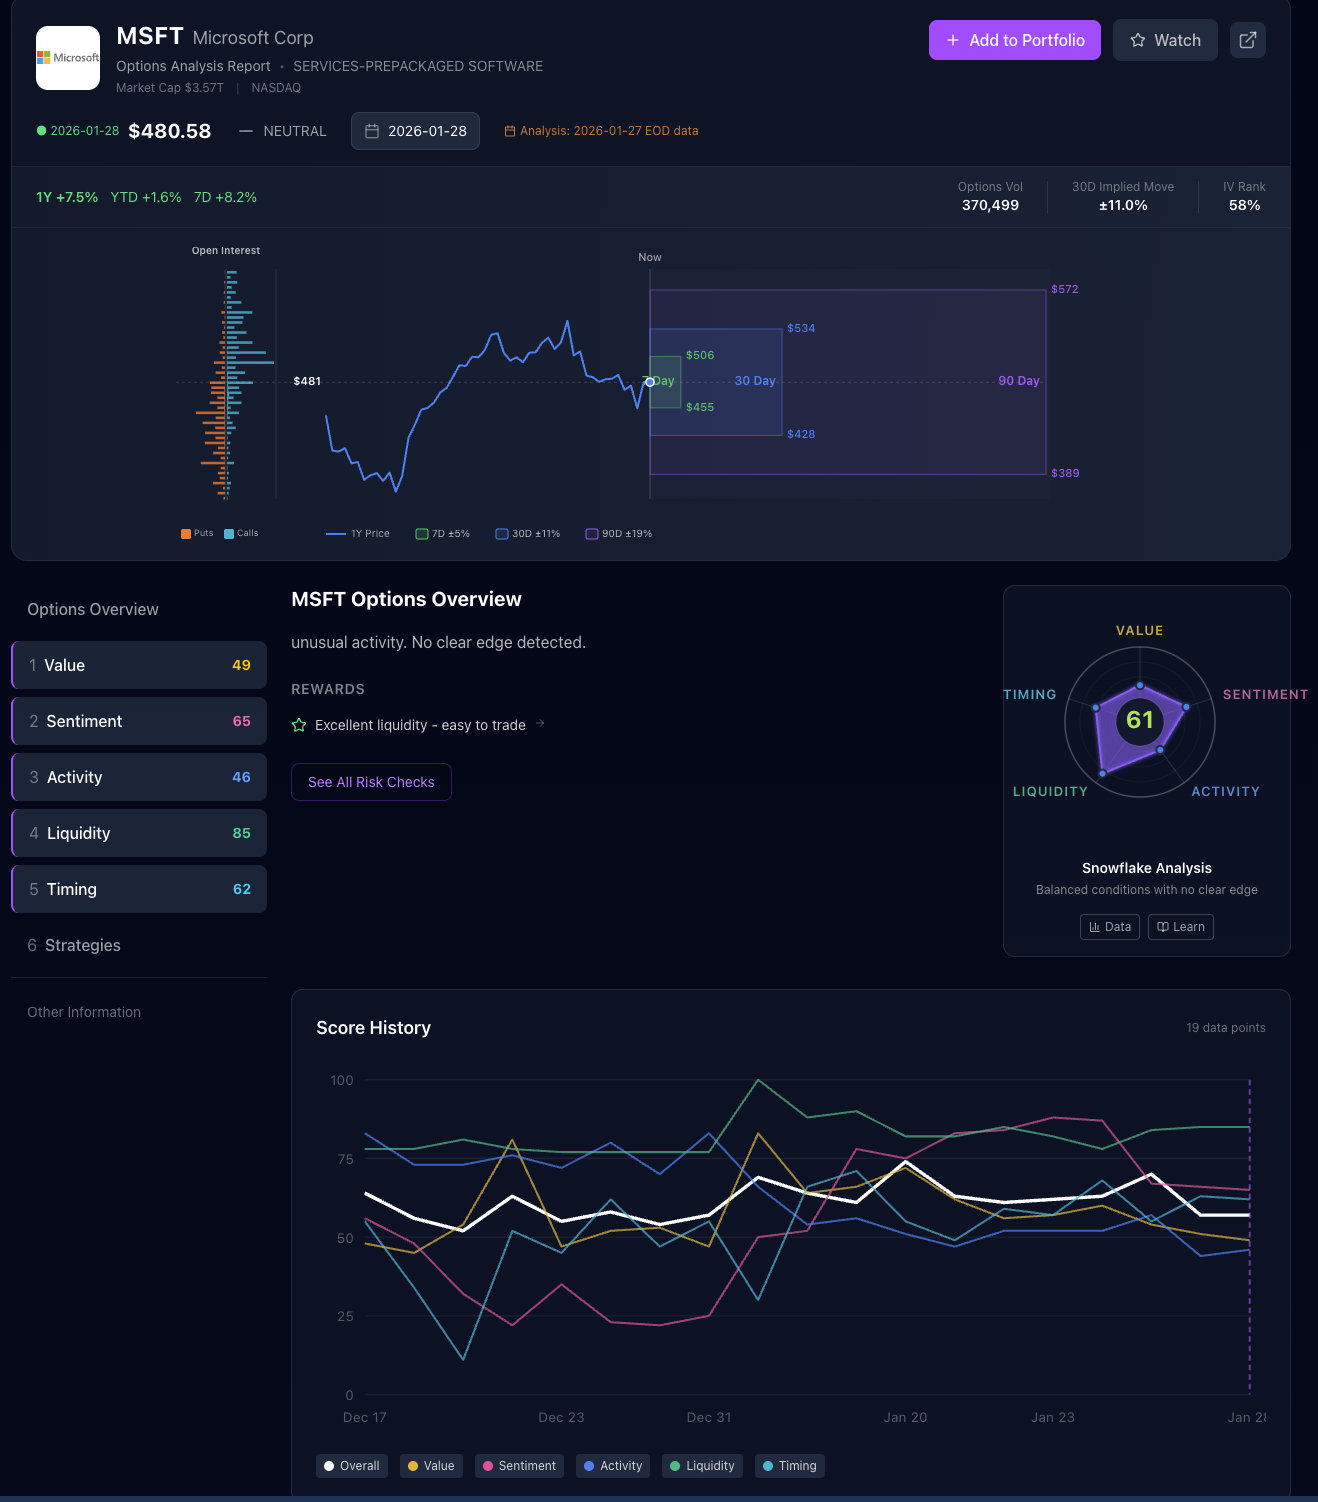
Pre-Earnings Scores: Value 49 | Sentiment 65 | Activity 46 | Liquidity 85 | Timing 62
MSFT had the most neutral scorecard. Value at 49 meant IV was neither cheap nor expensive. Activity at 46 was normal. The overall assessment was clear: no clear edge.
MSFT dropped -5.1% after hours but recovered to $481.63 by the next day's close, finishing essentially flat.
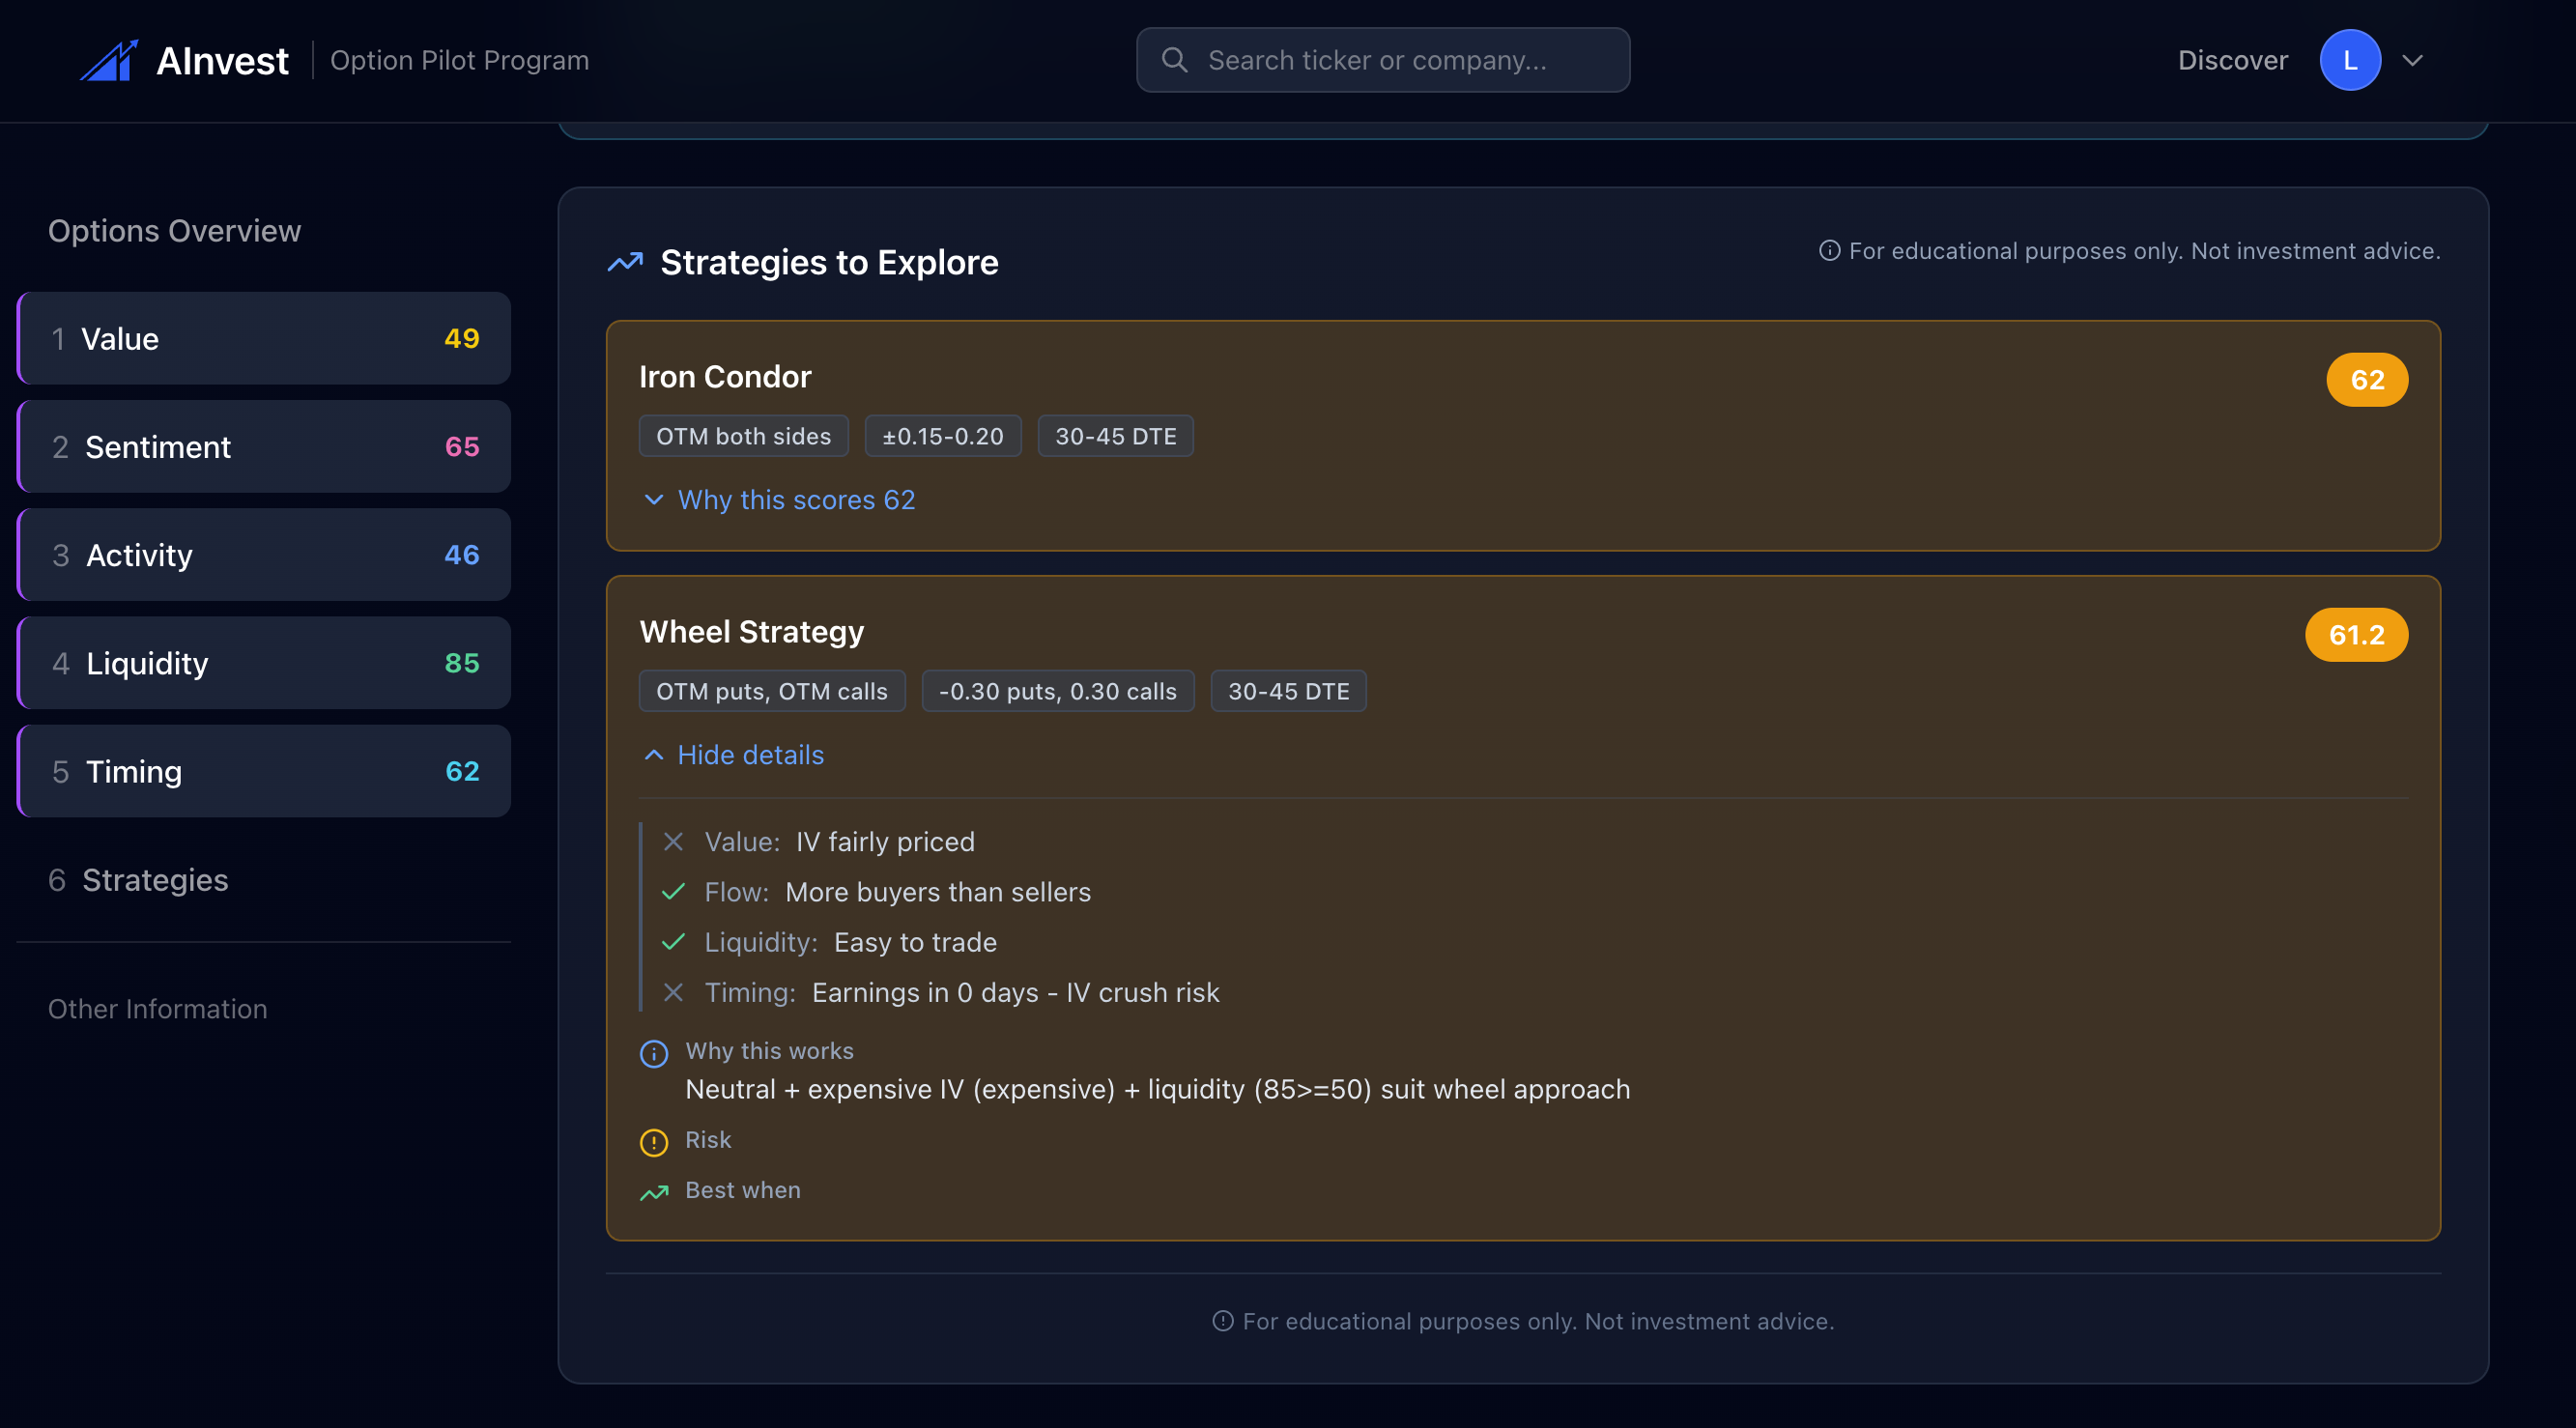
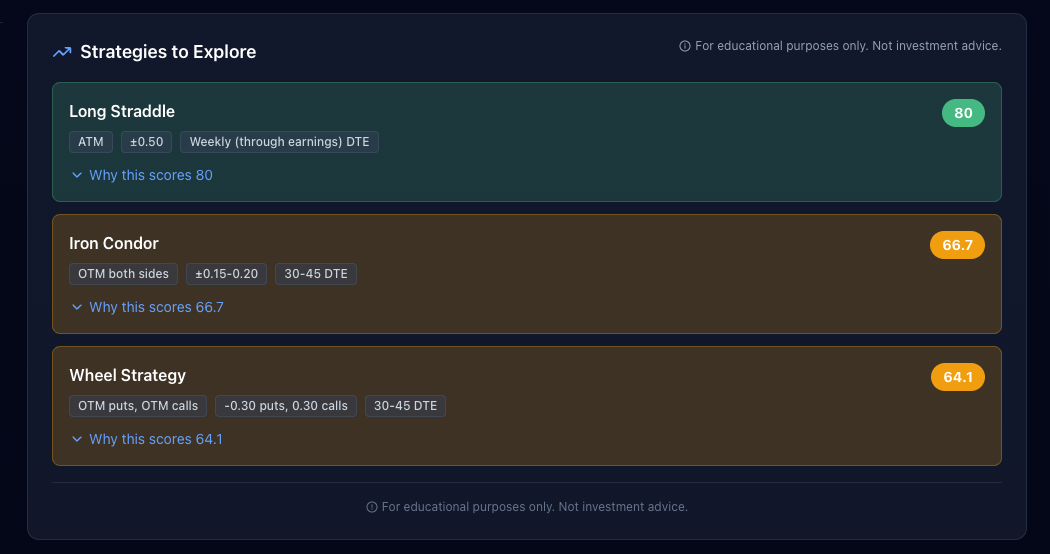
The strategy panel showed Iron Condor bias (score: 62), which profits from range-bound outcomes — and the stock ultimately went nowhere.
Key insight: "No clear edge" is one of the most valuable signals the system can give. Knowing when NOT to trade is an edge.
TSLA: Highest Activity Score Signals Unusual Positioning
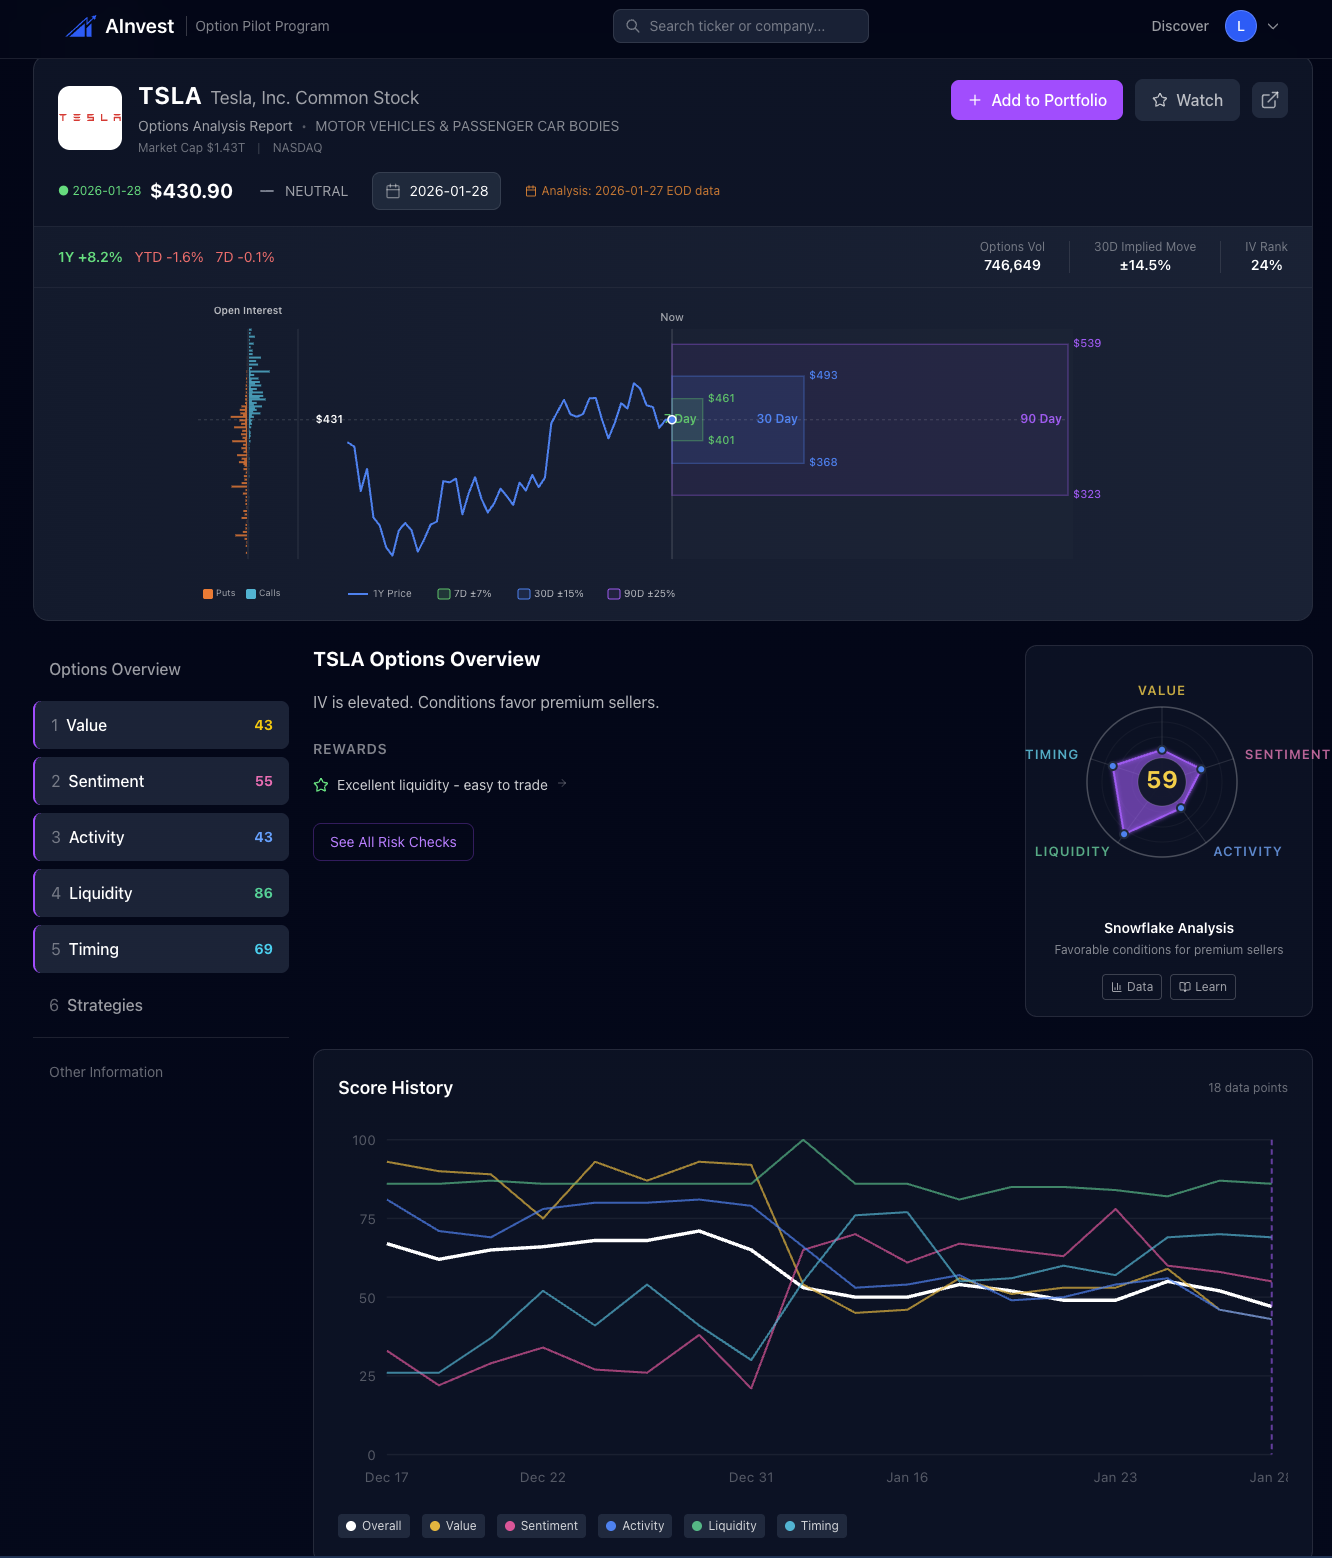
Pre-Earnings Scores: Value 69 | Sentiment 65 | Activity 89 | Liquidity 81 | Timing 24
TSLA's Activity score of 89 was by far the highest. This signals serious unusual options activity: elevated volume, concentrated strike bets, and multi-day persistence. The Value score of 69 confirmed elevated IV, and the Timing score of 24 was a clear warning flag for imminent earnings.
TSLA moved +3.0% after hours but settled back to $431.46 by the next day.
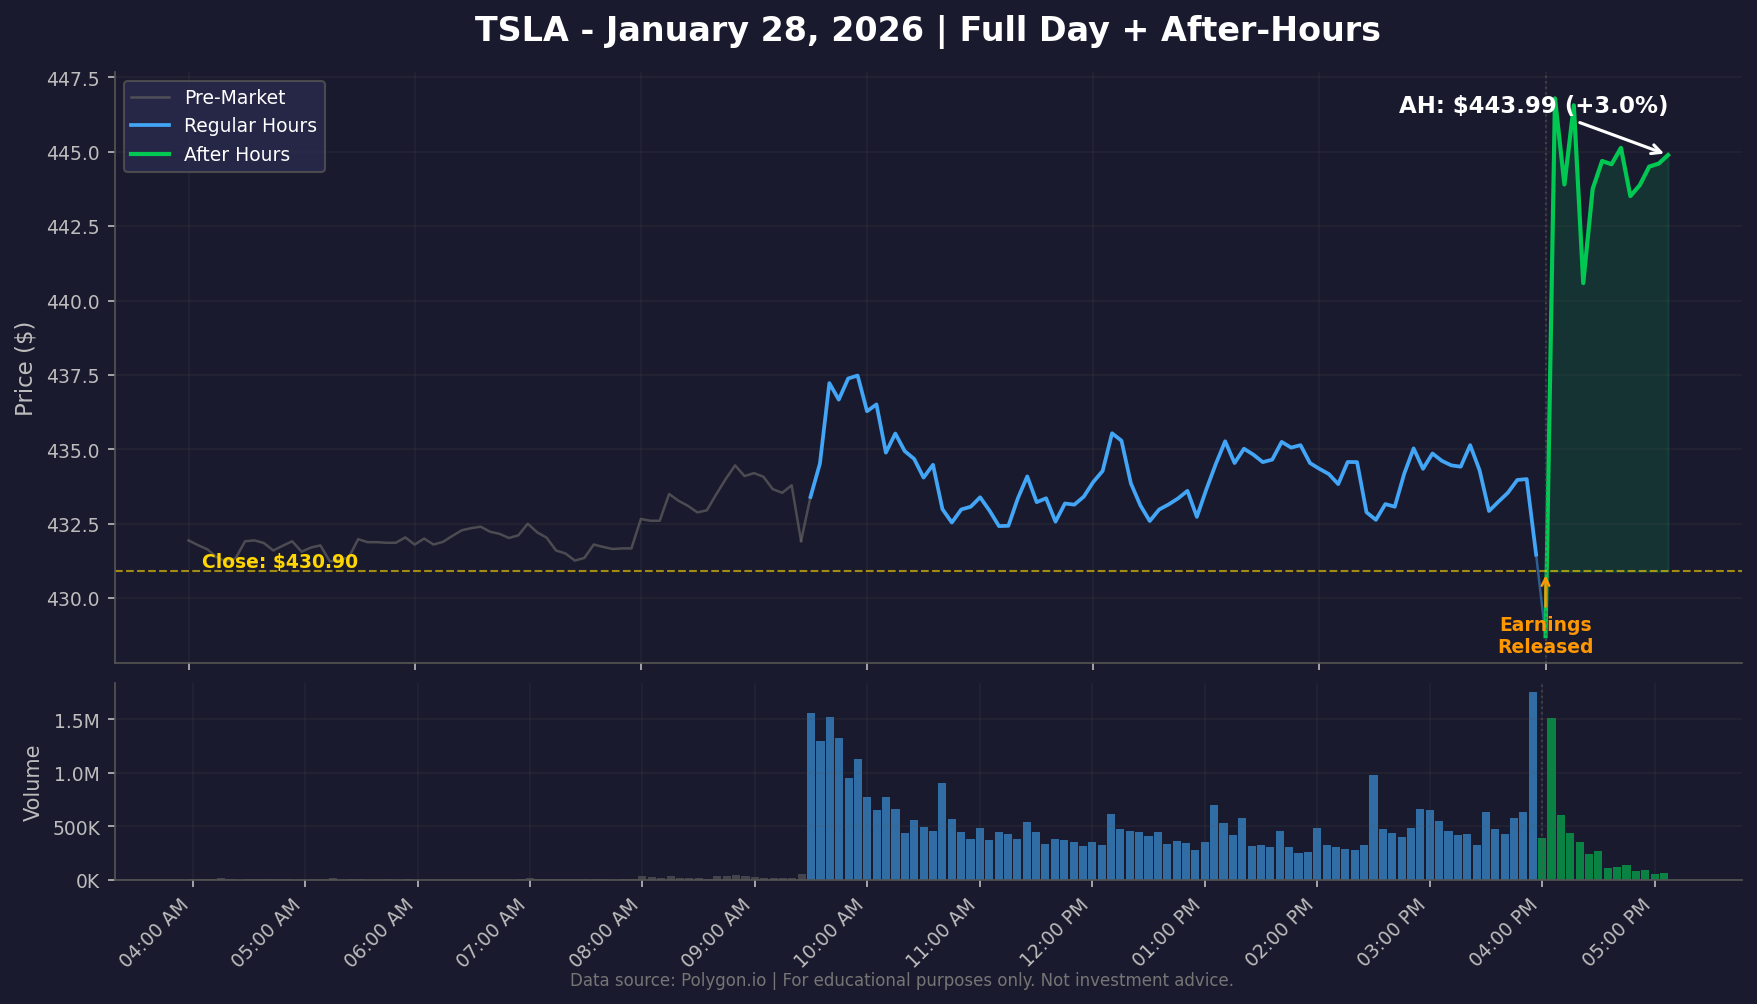
The high Activity score correctly flagged that the options market was anticipating a notable event. Premium sellers who sold before earnings and bought back after the IV crush would have captured that edge.
Why Long Straddle Dominated
Across all four tickers, the Long Straddle consistently scored 80 as the top strategy bias. During earnings, this strategy scores well because:
- IV is elevated (captured by the Value pillar) = volatility is expected
- Direction is uncertain (no single overwhelming Sentiment signal)
- The event is imminent (low Timing scores confirm earnings risk)
Important: Strategy scores are educational tools that show which approaches align with current market conditions. A score of 80 doesn't mean "this trade will make money." It means "current conditions favor this type of strategy."
How Each Pillar Behaves During Earnings
Value During Earnings
IV typically spikes in the weeks leading up to earnings, creating conditions that favor premium sellers. After earnings, IV collapses (the "IV crush"). In our case study: TSLA (69) and IBM (67) showed elevated IV while META (46) and MSFT (49) were more neutral.
Sentiment During Earnings
Options flow before earnings reveals how traders are positioning. All four had modestly bullish sentiment (51-68), but none showed extreme conviction. This is typical: institutional traders hedge both directions.
Activity During Earnings
This is arguably the most important pillar during earnings. TSLA's 89 indicated heavy institutional positioning. IBM's 7 was the lowest, yet IBM had the second-largest move (+7.9%). Activity measures preparation, not prediction.
Liquidity During Earnings
Liquidity becomes critical during high-volatility events. META (91) and MSFT (85) had excellent liquidity. IBM (31) was the weakest, meaning any IBM strategy would face higher execution costs.
Timing During Earnings
The Timing pillar flags imminent event risk. IBM (8) and TSLA (24) had the lowest scores, correctly flagging maximum event risk. Low Timing scores don't mean "don't trade" — they mean "be aware that event risk is maximum."
Key Takeaways
1. The scoring system doesn't predict earnings outcomes. It assesses conditions. All four stocks moved significantly after hours, but the system's value was in showing where the edge was, not which direction the stock would go.
2. "No clear edge" is a valuable signal. MSFT's neutral scorecard was the most honest call of the night.
3. Volatility strategies dominated for a reason. Long Straddle scored 80 across all four tickers because earnings conditions inherently favor volatility plays.
4. Liquidity matters more than you think. META (91) and TSLA (81) offered efficient execution. IBM (31) did not.
5. After-hours reactions are not the final word. Every single ticker reversed or pulled back by the next day's close. The scoring system's focus on conditions rather than direction helps maintain realistic expectations.
Start Using This
Evaluate IV levels and timing scores before your next earnings trade.
Sign up free to access 5-pillar scores for 5,000+ stocks, daily signals, strategy picks, and radar charts. No credit card required.
For educational purposes only. Not investment advice. Past performance does not indicate future results. Options trading involves substantial risk and is not appropriate for all investors.
See This Analysis Live — Free
Sign up free to access the full options screener with 5-pillar scores for 5,000+ stocks, daily signals, strategy recommendations, and radar charts. No credit card required.
Free account includes: screener · 5-pillar scores · daily signals · strategy picks · radar charts
Or just get the weekly recap
Sundays. What moved this week, what catalysts and earnings drive next week, and the 5-pillar setups that stand out. No account needed.
Free. One email per week. Unsubscribe with one click.