The Most Underrated Trading Skill: Knowing When NOT to Trade
Everyone wants to find the next big trade.
But the traders who survive long-term have a different skill: knowing when to sit on their hands.
Most platforms show you volume. "SCHW traded 53K contracts today!"
Cool. But is that a lot? Is something unusual happening? Should you care?
The ACTIVITY pillar answers the question most platforms ignore:
"Is there anything worth paying attention to right now?"
Why Volume Alone Is Misleading
SCHW traded 53,000 options contracts today. Sounds active, right?
But here's what volume alone doesn't tell you:
1. Is this normal for SCHW?
- 53K might be huge for a small-cap stock
- For SCHW, it's exactly average (1.0x the 20-day average)
- Volume without context is noise
2. Are positions being built or closed?
- High volume + no OI change = day traders churning
- High volume + OI building = new positions, real conviction
- SCHW's OI changed +0.0% over 5 days — nothing new happening
3. Is the activity concentrated or dispersed?
- Activity concentrated in 1-2 strikes = someone knows something
- Activity spread across many strikes = normal market making
- SCHW's top 3 strikes = only 50% of volume — dispersed
4. Is it a one-day blip or sustained?
- One day of high volume = could be noise
- Multiple days elevated = something brewing
- SCHW: only 1 day elevated — may be one-day event
Real Example: SCHW
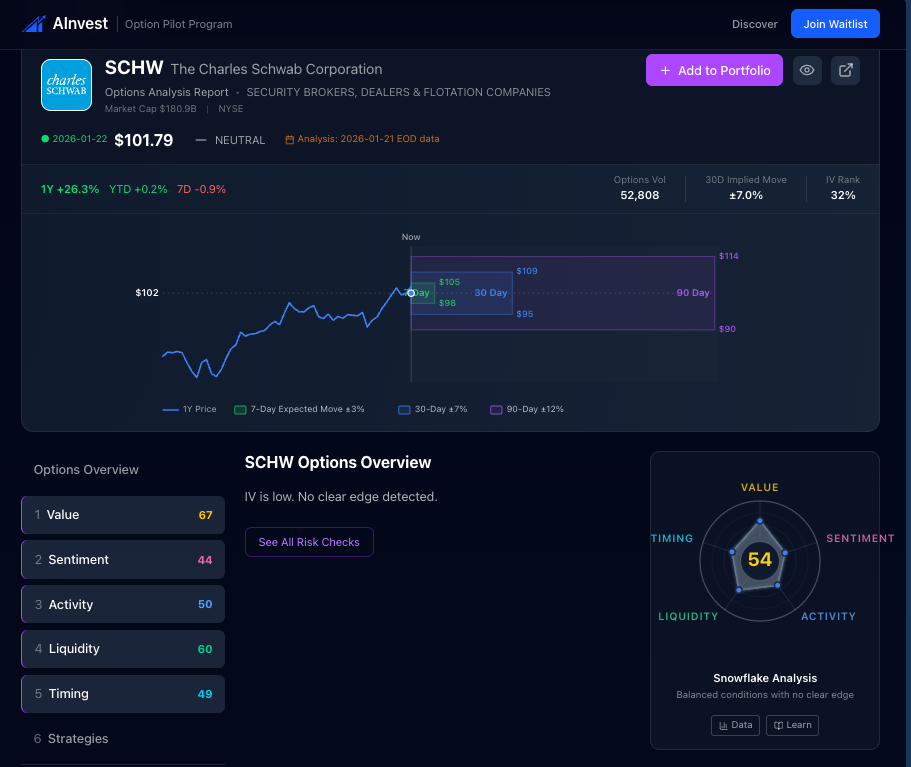
Let's look at Charles Schwab (SCHW) using Options Pilot:
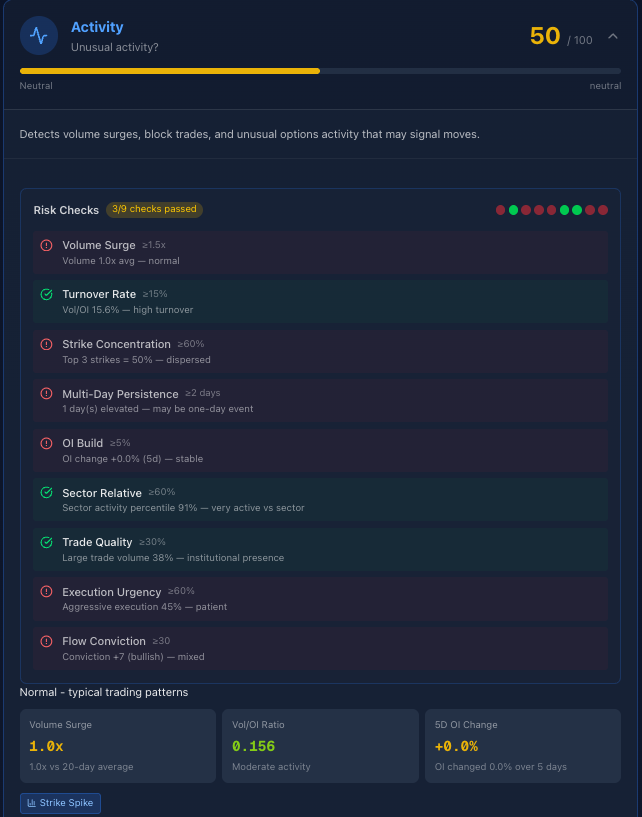
ACTIVITY Score: 50/100 — Neutral. Nothing unusual.
Here's what the 9 Risk Checks tell us:
| Check | Threshold | SCHW | Status |
|---|---|---|---|
| Volume Surge | ≥1.5x | 1.0x avg | Normal |
| Turnover Rate | ≥15% | 15.6% | High turnover |
| Strike Concentration | ≥60% | 50% | Dispersed |
| Multi-Day Persistence | ≥2 days | 1 day | One-day event |
| OI Build | ≥5% | +0.0% | Stable |
| Sector Relative | ≥60% | 91% | Very active vs sector |
| Trade Quality | ≥30% | 38% | Institutional presence |
| Execution Urgency | ≥60% | 45% | Patient |
| Flow Conviction | ≥30 | +7 | Mixed |
Only 3 of 9 checks passed.
Translation: SCHW is trading at normal levels. No unusual activity. No big players making aggressive moves. Nothing compelling to act on.
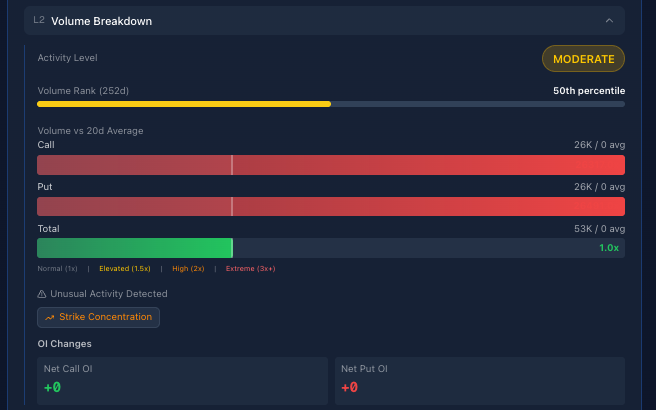
The Volume Breakdown: Average Across the Board
| Metric | Value | What It Means |
|---|---|---|
| Activity Level | MODERATE | Nothing special |
| Volume Rank (252d) | 50th percentile | Dead average |
| Volume vs 20d Avg | 1.0x | Exactly average |
| Call Volume | 26K | Normal |
| Put Volume | 26K | Normal |
| Total Volume | 53K | Normal |
| Net Call OI | +0 | No new call positions |
| Net Put OI | +0 | No new put positions |
The insight: When volume is 1.0x average and OI isn't changing, the options market is saying "nothing to see here."
What About the Unusual Flow?
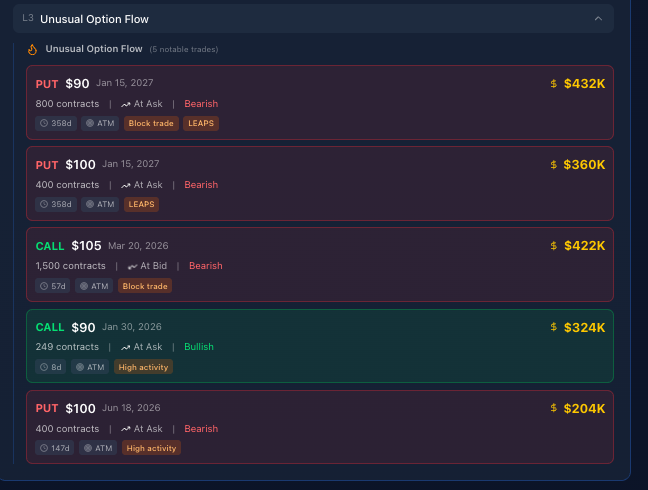
Yes, there are notable trades. Let's look:
| Type | Strike | Expiry | Size | Premium | Direction |
|---|---|---|---|---|---|
| PUT | $90 | Jan 15, 2027 | 800 | $432K | Bearish |
| PUT | $100 | Jan 15, 2027 | 400 | $360K | Bearish |
| CALL | $105 | Mar 20, 2026 | 1,500 | $422K | Bearish (sold at bid) |
| CALL | $90 | Jan 30, 2026 | 249 | $324K | Bullish |
| PUT | $100 | Jun 18, 2026 | 400 | $204K | Bearish |
The problem: These trades are:
- LEAPS (358 days out) — not urgent positioning
- Mixed direction — bearish and bullish canceling out
- Small relative to SCHW's market cap
- Conviction score: only +7 (barely bullish)
This is not the "smart money loading up" pattern. It's normal institutional hedging and position management.
The Simple Framework
Here's how to use ACTIVITY in your trading:
| ACTIVITY Score | What It Means | What To Do |
|---|---|---|
| 80-100 | Hot — unusual activity detected | Investigate immediately |
| 60-79 | Elevated — above average interest | Worth watching |
| 40-59 | Normal — typical trading | No edge, consider waiting |
| 20-39 | Quiet — below average | Look elsewhere |
| 0-19 | Dead — minimal activity | Skip this ticker |
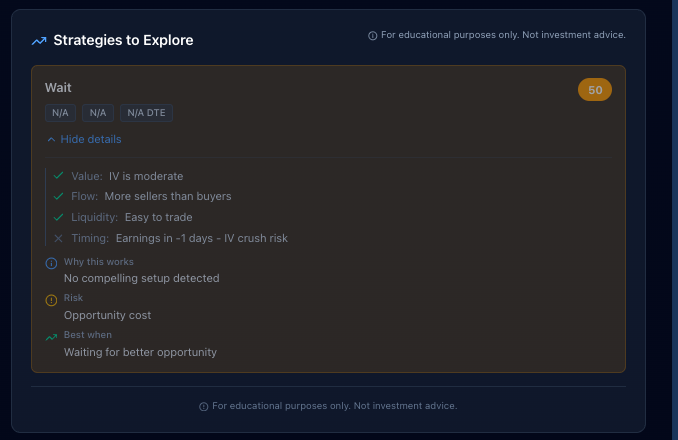
SCHW at 50? Normal activity. No unusual signals. The smart move is to wait for a better setup — either here when activity picks up, or in another ticker where something IS happening. The Options Screener highlights stocks with Activity scores above 70 so you can focus on tickers where something is brewing.
Why "Wait" Is a Strategy
Most trading platforms push you to trade more. More trades = more commissions.
We built Options Pilot to tell you the truth: sometimes the best trade is no trade.
When ACTIVITY is neutral:
- You have no information edge
- You're competing against market makers with better data
- You're paying bid-ask spread for... what exactly?
The edge in options trading isn't just finding good trades. It's avoiding bad ones.
SCHW will still be there when:
- Volume surges (earnings, news, sector rotation)
- OI starts building (institutions positioning)
- Strike concentration appears (someone knows something)
When that happens, ACTIVITY score will jump. That's when you pay attention.
What Would "Hot" Activity Look Like?
For comparison, here's what an ACTIVITY score of 80+ would show:
- Volume Surge: 2-3x normal (not 1.0x)
- OI Build: +10-20% over 5 days (not 0%)
- Strike Concentration: 70%+ in top 3 strikes (not 50%)
- Multi-Day Persistence: 3+ days elevated (not 1)
- Flow Conviction: +40 or higher (not +7)
When you see that pattern, something is happening. Institutions are positioning. News may be coming. That's when ACTIVITY tells you to dig deeper. TradeSignals surfaces stocks with unusual volume spikes and gamma level changes to help you spot these moves early.
Get the Full Picture
ACTIVITY is one of five pillars we analyze:
- VALUE — Are options cheap or expensive?
- SENTIMENT — What are traders betting?
- ACTIVITY — Is something unusual happening?
- LIQUIDITY — Can you trade efficiently?
- TIMING — Is now the right moment?
We score 4,000+ stocks across all five pillars. Every trading day.
See Activity Scores Live
Open the Options Screener to find stocks with unusual options activity. For gamma-level entry targets, check TradeSignals.
Sign up free to access 5-pillar scores, daily signals, and strategy picks for 5,000+ stocks. No credit card required.
See Activity Scores for 5,000+ Stocks — Free
Sign up free to see Activity scores for 5,000+ stocks updated daily. Your free account includes the full screener, 5-pillar radar charts, strategy signals, and pre-market updates. No credit card required.
Free account includes: screener · 5-pillar scores · daily signals · strategy picks · radar charts
Or just get the weekly recap
Sundays. What moved this week, what catalysts and earnings drive next week, and the 5-pillar setups that stand out. No account needed.
Free. One email per week. Unsubscribe with one click.