🔥 ADI Massive $5.3M Call Bet - Semiconductor Giant Eyes 4% Upside! 🚀
📅 December 2, 2025 | 🔥 Unusual Activity Detected
🎯 The Quick Take
Someone just dropped $5.3 MILLION on ADI calls this morning at 11:21:27! This monster bullish bet bought 4,000 contracts of $280 strike calls expiring March 20, 2026 - betting on continued momentum after ADI's stunning Q4 earnings beat and aggressive guidance. With ADI trading near record highs at $268.01 after delivering 26% YoY revenue growth and raising Q1 guidance 4.4% above consensus, this institutional player is positioning for another $12 run higher over the next 3.5 months. Translation: Smart money loading up on calls after semiconductors beat and expects the rally to continue!
📊 Company Overview
Analog Devices (ADI) is a leading analog, mixed-signal, and digital-signal processing chipmaker specializing in converter chips that transform analog signals to digital formats and vice versa:
- Market Cap: $130.5 Billion
- Industry: Semiconductors & Related Devices
- Current Price: $268.01 (near record high of $268.81)
- Primary Markets: Industrial (45% of revenue), Automotive (30%), Communications, Consumer
- Key Products: Power management ICs, data converters, amplifiers, RF solutions, sensor technologies
💰 The Option Flow Breakdown
The Tape (December 2, 2025 @ 11:21:27):
| Time | Symbol | Buy/Sell | Call/Put | Expiration | Premium | Strike | Volume | OI | Size | Spot | Option Price | Option Symbol |
|---|---|---|---|---|---|---|---|---|---|---|---|---|
| 11:21:27 | ADI | BUY | CALL $280 | 2026-03-20 | $5.3M | $280 | 4K | 639 | 4,000 | $268.01 | $13.30 | ADI20260320C280 |
🤓 What This Actually Means
This is a massive bullish bet on ADI's continued outperformance! Here's what went down:
- 💸 Huge premium paid: $5.3M ($13.30 per contract × 4,000 contracts)
- 🎯 Aggressive strike: $280 represents 4.5% upside from current $268 price
- ⏰ Strategic timing: 108 days to expiration captures Q1 FY2026 earnings (Feb 19), potential analyst upgrades, MI325X/automotive recovery catalysts
- 📊 Size matters: 4,000 contracts represents 400,000 shares worth ~$107M at current price
- 🔥 Unusual score: Z-score of 93.6 = EXTREMELY UNUSUAL (this trade is 6.26x normal volume!)
What's really happening here: This institutional player is betting big that ADI's semiconductor recovery story has legs. They're paying $13.30 per share for March 2026 $280 calls, expecting the stock to push through resistance and continue climbing. With ADI just reporting Q4 revenue of $3.08B (up 26% YoY) and beating consensus by 2.17%, plus Q1 guidance of $3.1B that's 4.4% above Street expectations, this is momentum chasing with institutional size.
Why this timing? ADI reported earnings on November 25, 2025, and the stock has been consolidating near highs. This call buyer clearly believes the market is underestimating how strong the Industrial segment recovery will be (up 23% YoY last quarter!) and that analysts will continue raising price targets toward the $290-$320 range multiple shops are projecting.
Breakeven analysis: Needs ADI at $293.30 by March 20, 2026 (9.4% gain from current levels) to breakeven. Maximum profit is UNLIMITED above $293.30. Maximum loss is the $5.3M premium if ADI stays below $280.
Unusual Score: 🔥 EXTREMELY UNUSUAL (93.6 Z-score, 6.26x average volume) - This size of call buying in ADI happens only a few times per year. When institutional players deploy $5M+ in single option positions, they typically have strong conviction based on channel checks, industry data, or upcoming catalysts retail traders don't see yet.
📈 Technical Setup / Chart Check-Up
YTD Performance Chart
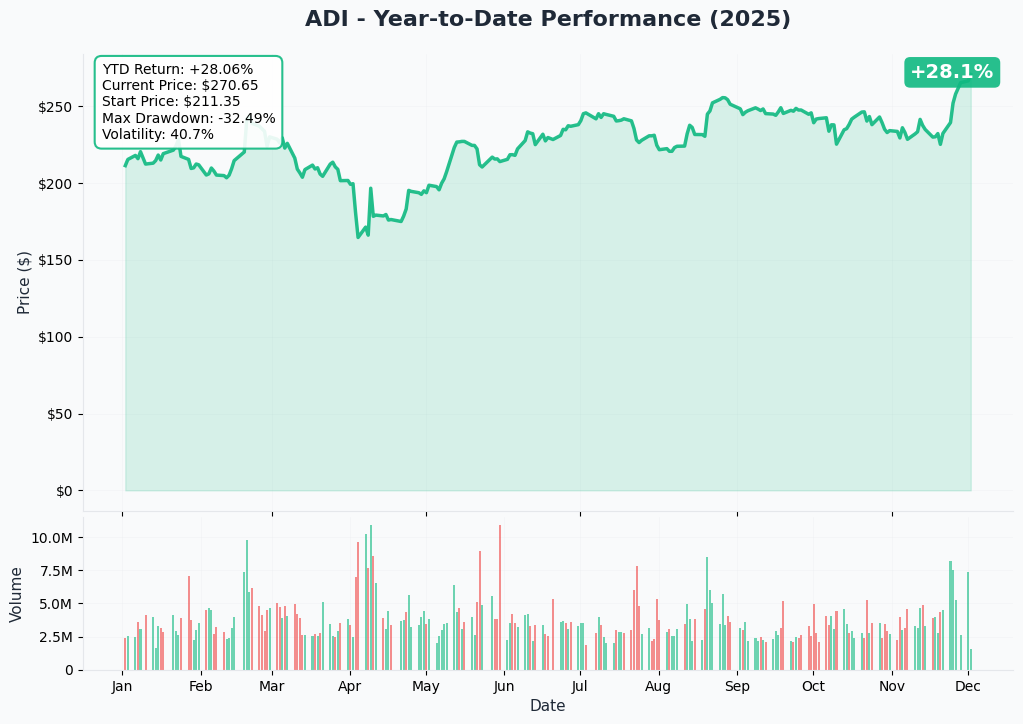
ADI is on an absolute tear - up +25% in the past month alone with current price at $268.01 (started November around $215). The chart tells a powerful semiconductor recovery story - after grinding sideways in the $158-$180 range for most of the year during the brutal industrial/automotive inventory correction, ADI exploded in November following the strong Q4 earnings beat.
Key observations:
- 🚀 Massive November breakout: Vertical move from $215 to $268 in just 3 weeks on earnings beat and guidance raise
- 📈 52-week range: $158.77 - $268.81 (currently at HIGH END of range)
- 📊 Pattern: Classic "V-shaped recovery" after bottoming in early 2025 following inventory correction
- 💪 Volume surge: Institutional accumulation visible in late November as analysts upgraded price targets
- ⚠️ Near resistance: Trading just below record high of $268.81 - breakout above $270 could trigger momentum to $280
The chart shows ADI finally emerging from the 2024 industrial/automotive downturn that deepened after oversupply and inventory adjustments. The November rally validates management's thesis that Industrial segment is inflecting positively.
Gamma-Based Support & Resistance Analysis
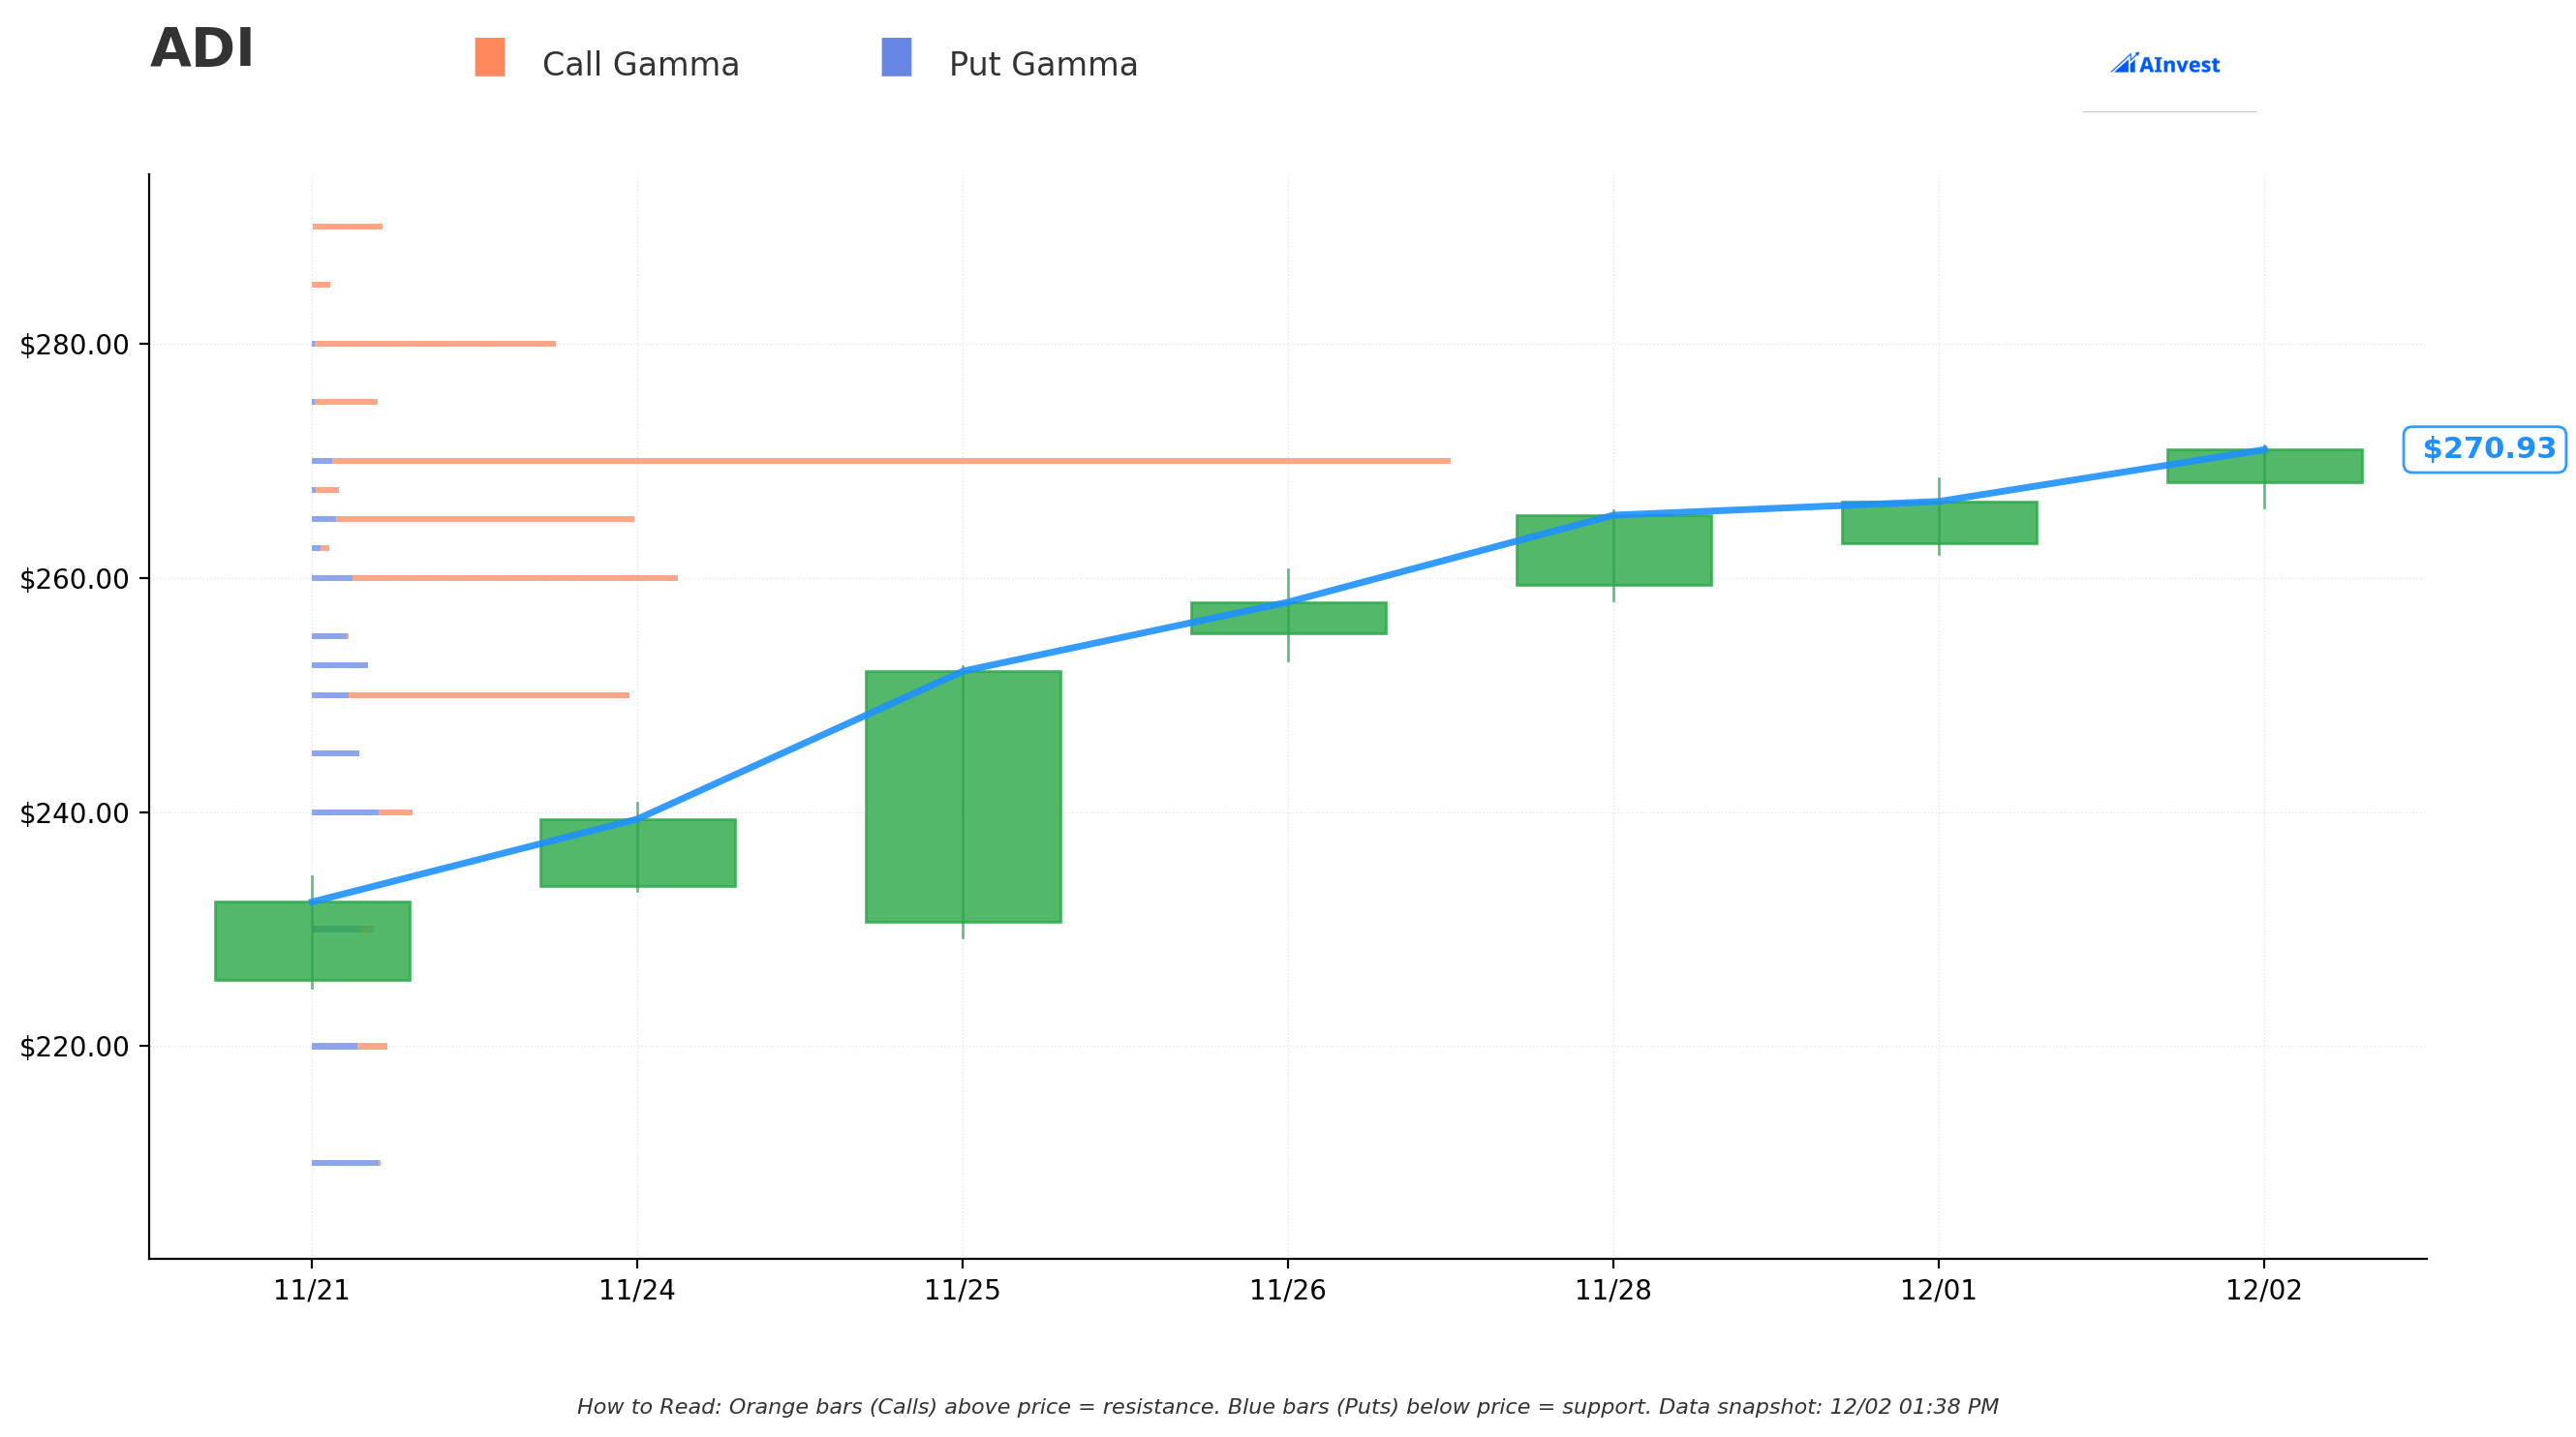
Current Price: $270.78 (real-time snapshot)
The gamma exposure map reveals critical price magnets where options positioning creates natural support and resistance:
🔵 Support Levels (Put Gamma Below Price):
- $270 - STRONGEST immediate support with 7.05B total gamma (only 0.29% below current price!)
- $265 - Secondary support at 2.01B gamma (call buyers defending this level)
- $260 - Major structural floor with 2.29B gamma (2.13% below current)
- $250 - Deep support at 2.05B gamma (7.67% below current)
- $240 - Extended support zone with 0.65B gamma (11.37% below current)
🟠 Resistance Levels (Call Gamma Above Price):
- $275 - Immediate ceiling with 0.40B gamma (1.56% overhead) - FIRST TARGET
- $280 - Major resistance at 1.52B gamma (3.41% above current) - THIS IS WHERE THE CALL TRADE IS STRUCK!
- $290 - Extended upside target at 0.44B gamma (7.10% rally required)
What this means for traders: ADI is sitting RIGHT ON TOP of massive $270 support (7.05B gamma - the single largest level) which creates a natural floor. The call buyer struck at $280 where there's 1.52B gamma resistance - they're betting ADI breaks through this level cleanly and continues to $290+.
Notice the setup? With only 0.40B gamma resistance at $275 (relatively light), once ADI clears that level, the path to $280 opens up. The gamma data shows most of the "wall" is at $280 itself - if that breaks, momentum could accelerate quickly toward $290.
Net GEX Bias: Bullish (16.66B call gamma vs 3.67B put gamma = 4.5:1 ratio) - Overwhelming call positioning shows institutional players are positioned for upside. This aligns perfectly with the $5.3M call purchase.
Critical insight: The $270 support level with 7.05B gamma is VITAL - as long as ADI holds above here, the bullish structure remains intact. Break below $270 and the next support isn't until $265 (2.01B gamma).
Implied Move Analysis
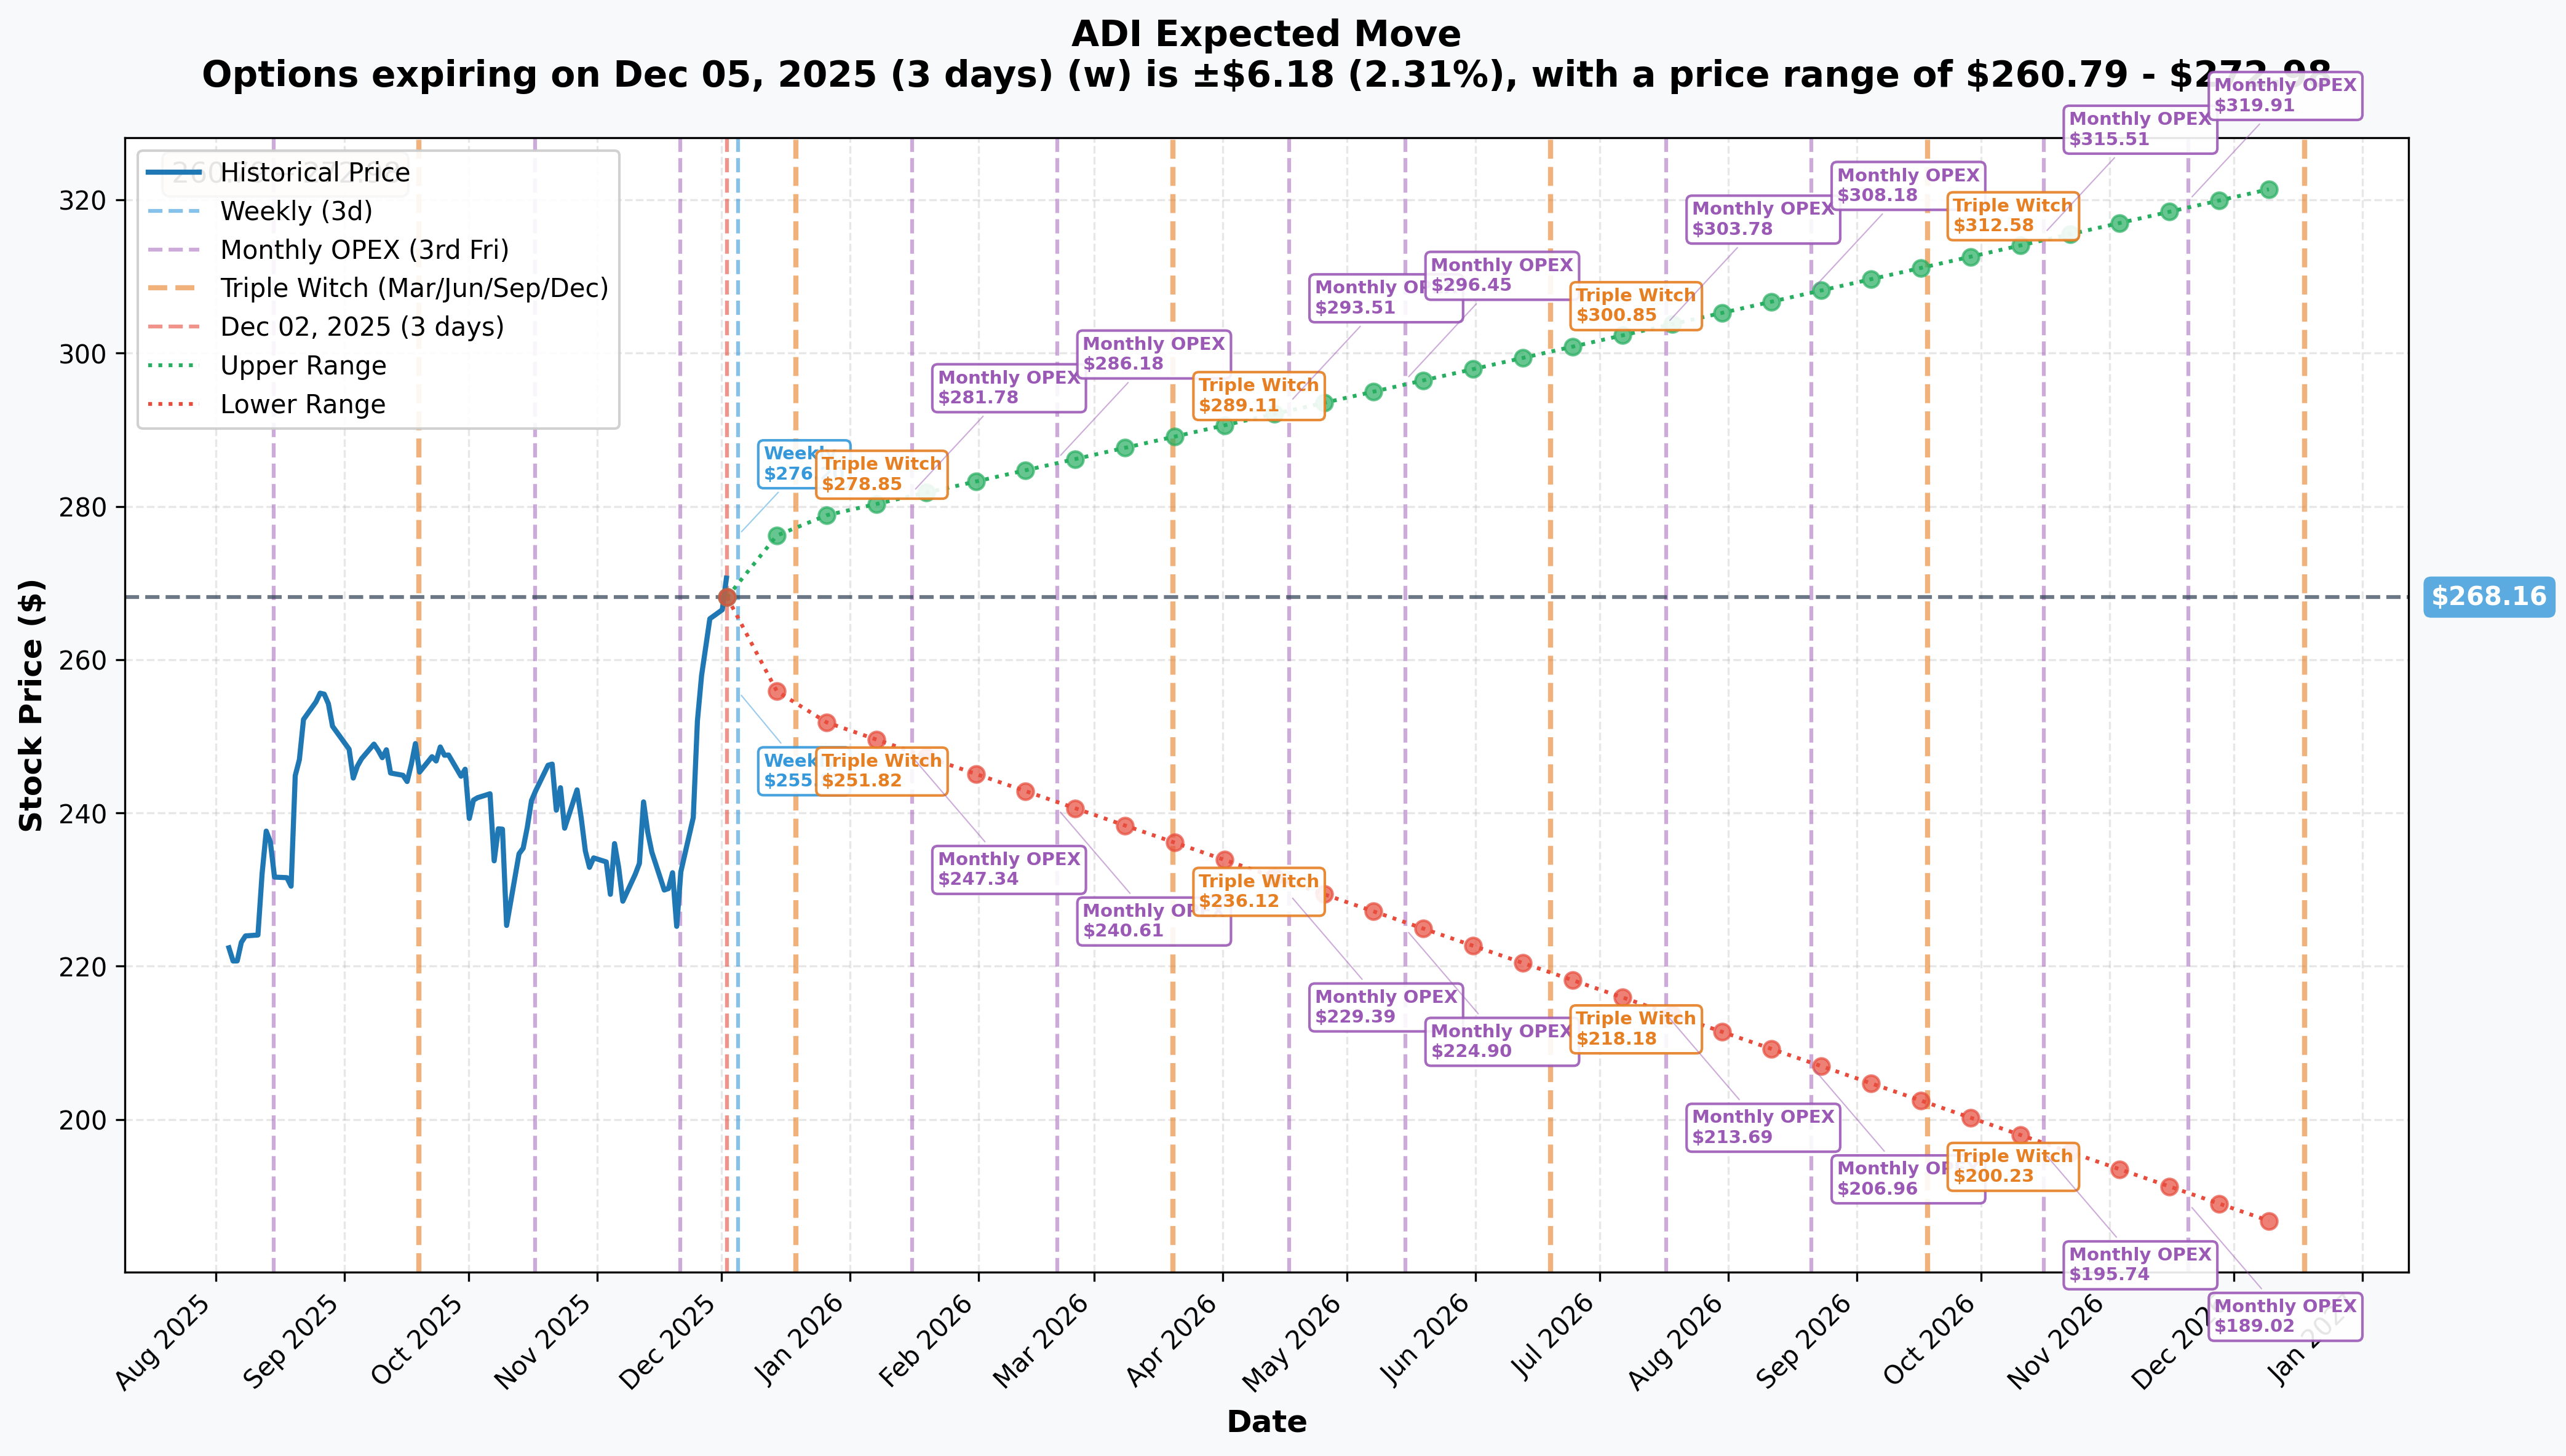
Options market pricing for upcoming expirations:
- 📅 Weekly (Dec 5 - 3 days): ±$6.18 (±2.31%) → Range: $260.79 - $272.98
- 📅 Monthly OPEX (Dec 19 - 17 days): ±$11.56 (±4.31%) → Range: $253.13 - $277.99
- 📅 Quarterly Triple Witch (Dec 19 - 17 days): ±$11.56 (±4.31%) → Range: $253.13 - $277.99
- 📅 March OPEX (Mar 20 - 108 days - THIS TRADE!): ±$60.35 (±22.51%) → Range: $185.09 - $322.48
Translation for regular folks: Options traders are pricing in a 2.3% move ($6) by this Friday for weekly expiration, but a much larger 4.3% move ($11) through December triple witch. The real action is in the March expiration - the market expects a MASSIVE 22.5% move ($60) either direction over the next 3.5 months!
What does this tell us about the $5.3M call trade? The March 20th upper range of $322.48 gives this call buyer significant upside potential. Even at the more conservative mid-point of the implied range (~$268 + 11% = $298), the $280 calls would be ~$18 in-the-money, representing a 35% gain on the premium paid.
Key insight: The sharp jump in implied volatility from 2.3% (weekly) to 22.5% (March) reflects market expectations for significant price movement driven by upcoming catalysts - particularly Q1 FY2026 earnings on February 19, 2025 and the broader semiconductor recovery narrative through Q1 2026.
Volatility environment: Implied volatility has calmed significantly post-earnings (from elevated pre-report levels), making this an attractive time to buy calls before the next catalyst cycle begins.
🎪 Catalysts
🔥 Recent Catalysts (Already Happened)
Q4 FY2025 Earnings Beat - November 25, 2025 💪
ADI absolutely crushed Q4 expectations, reporting on November 25, 2025:
- 📊 Revenue: $3.08B (up 26% YoY), beating Zacks Consensus by 2.17%
- 💰 EPS: $2.26 (up 35% YoY), beating consensus of ~$2.22-2.23
- 📈 Gross Margin: 69.8% (up 190 bps YoY - industry-leading profitability!)
- 🏭 Operating Margin: 43.5% (up 240 bps YoY)
Segment Performance - The Real Story:
- Industrial (45% of revenue): +12% sequentially, +23% YoY - driven by aerospace/defense and automated test equipment (THIS is what bulls are betting on!)
- Automotive (30% of revenue): -1% sequentially but +22% YoY - connectivity and power solutions offsetting EV headwinds
Why this matters: The Industrial segment inflection is HUGE. After nearly doubling revenues from the 2024 lows, ADI is demonstrating that the analog semiconductor recovery is real and accelerating. This validates the bull thesis that drove the $5.3M call purchase.
Analyst Upgrade Cycle - November-December 2025 📈
Fresh price target increases following the earnings beat:
- Average Price Target: $277 (4.39% upside from current)
- Price Target Range: $240 (low) to $320 (high)
- Consensus Rating: "Buy" from 19 analysts
Specific Analyst Actions:
- Benchmark Co.: Maintained Buy, $290 PT - citing "analog recovery is still early"
- Bank of America: Raised PT to $290 from $275
- Stifel: Raised PT to $290 from $280
- Wells Fargo: Raised PT to $265 from $250
- CFRA: Raised PT to $265
Analyst consensus: Brokerage Recommendation (ABR) of 1.61 on scale of 1-5 (Strong Buy to Strong Sell) - firmly in "Strong Buy" territory
The upgrade cycle is STILL HAPPENING - analysts are playing catch-up to the earnings strength and raising numbers into 2026.
Capital Allocation Bonanza - February 2025 💰
ADI announced massive shareholder return program on February 18, 2025:
- 💵 Dividend Increase: Raised quarterly dividend by 8% to $0.99 per share (21st consecutive year of increases!)
- 🎯 Share Buyback: Increased authorization by $10B, bringing total remaining to $11.5B
- 📊 Historical Returns: Over 21 years: $13B in dividends, $16B in buybacks
- 💪 Management Commitment: "Return of 100% of free cash flow to shareholders over the long term"
Why this matters: The $11.5B buyback authorization provides a natural floor under the stock - management will be aggressively buying dips. This reduces downside risk for the call buyer.
🚀 Upcoming Catalysts (Next 6 Months)
UBS Global Technology Conference - TODAY! 🎤
- Date: December 2, 2025 at 12:15 PM EST in Scottsdale, Arizona
- Presenter: CFO Richard Puccio
- What to watch: Q1 guidance commentary, Industrial segment outlook, automotive recovery timeline, AI infrastructure exposure
- Webcast: Available via investor.analog.com with 30-day archive
This is happening RIGHT NOW as the call trade was executed! Smart money may have advance knowledge of bullish commentary coming at this conference.
Q1 FY2026 Earnings - February 19, 2025 (2.5 MONTHS) 📊
The MAJOR catalyst for this call trade - falls 1 month before March expiration:
- Date: February 19, 2025
- Consensus EPS: $1.54 (down 10.98% YoY) - but this looks conservative given guidance beat
- Revenue Guidance: $3.1B ± $100M (company guidance is 4.4% above $2.996B consensus!)
- Expected Operating Margin: 43.5% ± 100 bps
Key Metrics to Watch:
- Industrial segment growth (expected mid-single digits sequentially)
- Automotive recovery (expected down mid-single digits but stabilizing)
- Communications segment momentum (expected +10%)
- Free cash flow generation (39% of revenue in FY2025!)
- Progress toward 71% gross margin target by year-end FY2026
Upside surprise potential: With company guidance already 4.4% above consensus, analysts playing catch-up, and Industrial continuing to accelerate, there's meaningful upside surprise potential. A beat-and-raise here could send ADI to $290-300 quickly.
FY2026 Growth Trajectory 🌟
Management's long-term outlook provides major upside:
- Full-Year FY2026: Broad-based growth led by Industrial and Communications despite macro uncertainties
- 2028 Revenue Target: Management projects $14.3B revenue and $4.9B earnings by 2028
- Implied Growth: ~30% revenue growth from FY2025 baseline of $11B over 3 years
- Margin Expansion: Target of 71% gross margin by end of FY26 driven by Industrial mix shift and higher fab utilization
Why this matters: The $280 call strike is CONSERVATIVE if ADI executes on the 2028 roadmap. At $14.3B revenue with 71% gross margins, ADI could easily trade at $300-350+ by late 2026/2027.
AI Infrastructure Exposure 🤖
While not as direct as Nvidia/AMD, ADI plays a critical enabling role:
- Market Opportunity: Global AI/HPC demand expected to grow >15% in 2025
- ADI's Role: Power management and connectivity solutions for AI infrastructure
- Memory Segment: 74% YoY growth in HBM demand benefits broader semiconductor ecosystem including ADI's converters and power ICs
- Data Center Buildouts: Massive hyperscaler capex requires ADI's analog content (power delivery, thermal management, signal conditioning)
Automotive Semiconductor Recovery 🚗
Despite near-term softness, long-term drivers remain compelling:
- Semiconductor Content per Vehicle: Rising from $800 (2023) to expected $1,350 by 2030
- ADI's Auto Business: 30% of revenue, with connectivity and functionally safe power solutions driving growth
- Strategic Partnerships: TSMC capacity secured for wireless BMS and GMSL applications
- Design Wins: Record automotive design wins in China expected to support future growth
China Design Wins: Despite export restriction headwinds, ADI is winning major automotive design awards in China that will generate revenue for years to come.
⚠️ Risk Catalysts (Negative)
Tariff Escalation - Effective January 1, 2025 🚨
Major headwind potentially impacting margins:
- Section 301 Tariffs: U.S. tariffs on semiconductors increased from 25% to 50% effective January 1, 2025
- Products Affected: Diodes, transistors, photosensitive devices, integrated circuits, and parts
- ADI Exposure: Management explicitly cited tariff policy and geopolitical tensions as automotive/industrial headwinds
- Impact: Potential margin pressure if unable to pass costs to customers or relocate production
U.S.-China Trade Tensions:
- Escalating tariffs between U.S. and China exceeded 100% on certain goods in April 2025
- China export restrictions on gallium and germanium (95% global supply) create supply chain vulnerabilities
- December 2024 USTR investigation on China's mature-node chip policies
Automotive Softness Persisting 🚗
Near-term pressure in key segment:
- Q4 FY2025: Automotive down 1% sequentially despite +22% YoY
- Q1 FY2026 Guidance: Expected mid-single digit sequential decline
- EV Market Volatility: EV market uncertainty could impact wireless BMS and power management demand
- Industry Headwind: Automotive segment experienced abrupt slowdown in 2024 after nearly doubling from 2020-2023
Insider Selling Activity 📉
Notable executive sales in Q4 2024:
- CEO Vincent Roche: Sold 10,000 shares at $223.87 on Nov 1, then 10,000 shares at $215.83 on Dec 11 for $2.16M
- EVP Gregory Bryant: Sold 20,000 shares at $223.87 on Nov 4
- Total Q4 Insider Activity: 39,750 shares sold worth $9.6M, no purchases
Mitigating factor: All sales conducted under pre-established 10b5-1 trading plans (adopted March 1, 2024), suggesting routine tax/liquidity planning rather than bearish outlook. However, lack of ANY insider buying is notable at current levels.
🎲 Price Targets & Probabilities
Using gamma levels, implied move data, and upcoming catalysts, here are the scenarios through March 20th expiration:
📈 Bull Case (40% probability)
Target: $290-$310
How we get there:
- 💪 Q1 earnings (Feb 19) BEAT the already-raised guidance - revenue toward $3.2B high-end, gross margins expanding to 70%+
- 🚀 Industrial segment accelerating beyond mid-single digit expectations (up high-single digits or low-double digits)
- 🤖 AI infrastructure exposure materializes - ADI wins major hyperscaler power management design wins
- 🇨🇳 China automotive design wins start generating revenue ahead of expectations
- 📊 Automotive segment stabilizes and shows sequential growth by Q1 (vs. expected decline)
- 💰 Analysts continue raising price targets - multiple firms move to $300+ range
- 📈 Breakout above $280 gamma resistance triggers technical rally to $290-300
- 🏭 Tariff impact proves manageable - ADI successfully passes costs to customers or mitigates through supply chain adjustments
- 💵 $11.5B buyback authorization provides consistent bid under stock
Key metrics needed:
- Q1 revenue >$3.15B (above guidance midpoint)
- Gross margins expanding toward 71% target (proving pricing power)
- Industrial segment commentary confirming multi-quarter growth runway
- Free cash flow generation remaining strong (35-40% of revenue)
- FY2026 revenue guidance raised toward $13B+ (from current ~$12.5B street estimates)
Call P&L in Bull Case:
- Stock at $290 on Mar 20: Calls worth $10.00, profit = -$3.30/share × 4,000 = -$1.3M loss (25% loss)
- Stock at $300 on Mar 20: Calls worth $20.00, profit = $6.70/share × 4,000 = $2.7M gain (51% ROI!)
- Stock at $310 on Mar 20: Calls worth $30.00, profit = $16.70/share × 4,000 = $6.7M gain (126% ROI!)
Probability assessment: 40% because it requires solid execution (which ADI has demonstrated) plus favorable macro environment. The Industrial recovery is clearly happening (23% YoY growth validates this), and the setup into Q1 earnings looks favorable with guidance already above Street. Analyst upgrades continuing and $11.5B buyback provide technical tailwinds.
🎯 Base Case (45% probability)
Target: $265-$285 range (MODEST CONSOLIDATION)
Most likely scenario:
- ✅ Solid Q1 earnings meeting the raised guidance (~$3.1B revenue, $1.50-1.55 EPS)
- 📱 Industrial segment progressing steadily (mid-single digit growth as guided)
- ⚖️ Automotive stabilizing but not spectacular - sequential decline but less than feared
- 🤖 AI exposure acknowledged but not material revenue driver yet (longer-term story)
- 🇨🇳 Tariff impact manageable but creates modest margin headwind (69% gross margin vs. 69.8% in Q4)
- 🔄 Trading within gamma support ($270) and resistance ($280) bands for weeks
- 📊 Market digests strong FY2025 results, waits for FY2026 execution proof points
- 💤 Volatility normalizes - stock grinds higher but without fireworks
- 📈 Analyst price targets cluster in $280-290 range (in-line with current trajectory)
Call P&L in Base Case:
- Stock at $270 on Mar 20: Calls expire worthless, loss = -$13.30/share × 4,000 = -$5.3M (100% loss)
- Stock at $280 on Mar 20: Calls at-the-money, loss = -$13.30/share × 4,000 = -$5.3M (100% loss)
- Stock at $285 on Mar 20: Calls worth $5.00, profit = -$8.30/share × 4,000 = -$3.3M loss (62% loss)
This scenario is rough for the call buyer - they need meaningful upside above $280 to profit. At $285 they're still down 62%. This is why the probability of this being the intended hold-to-expiration play is lower - more likely this is a momentum trade to be closed on strength into earnings or after a breakout.
Why 45% probability: Stock at inflection point with solid fundamentals but rich valuation. Most likely path is continued consolidation in the $265-280 range as market waits for Q1 results. The call buyer may be planning to take profits on any spike toward $280 rather than holding to expiration.
📉 Bear Case (15% probability)
Target: $240-265 (TEST SUPPORT)
What could go wrong:
- 😰 Q1 earnings miss or weak guidance disappoints - revenue toward low-end of $3.0-3.1B range
- 🚨 Industrial segment momentum stalls - growth disappoints vs. mid-single digit guidance
- ⏰ Automotive segment weakness worse than expected - down high-single digits sequentially
- 🇨🇳 Tariff impact materializes negatively - gross margins compress to 68% or below
- 💸 Broader semiconductor selloff (Nvidia weakness, macro recession fears) drags ADI lower
- 📊 Analysts downgrade on valuation concerns after strong run (stock up 25% in month)
- 🤖 AI infrastructure story fails to materialize - ADI seen as "traditional" analog company missing AI wave
- 💰 Margin compression from competitive pricing pressure in Industrial segment
- 🔨 Break below $270 gamma support triggers cascade to $265, then $260
Critical support levels:
- 🛡️ $270: STRONGEST support (7.05B gamma) - MUST HOLD or structure breaks
- 🛡️ $265: Secondary floor (2.01B gamma) - likely institutional buying here
- 🛡️ $260: Major support (2.29B gamma) - test of November breakout level
- 🛡️ $250: Deep support (2.05B gamma) - disaster scenario
Call P&L in Bear Case:
- Stock at $265 on Mar 20: Calls expire worthless, loss = -$13.30/share × 4,000 = -$5.3M (100% loss)
- Stock at $250 on Mar 20: Calls expire worthless, loss = -$13.30/share × 4,000 = -$5.3M (100% loss)
Probability assessment: Only 15% because it requires multiple negative catalysts to align. ADI's fundamentals remain strong (best-in-class margins, $11.5B buyback, Industrial recovery validated), and guidance is already well above Street. The setup favors bulls. Biggest risk is macro selloff or tariff shock that's outside ADI's control.
Why calls lose 100% below $280: This is the nature of long calls - they're binary at expiration. Need stock materially above strike to profit. The call buyer is either planning to (a) close on strength before expiration, or (b) has very high conviction on >$290 outcome.
💡 Trading Ideas
🛡️ Conservative: Wait for Post-Conference Clarity
Play: Stay on sidelines until after UBS conference (today 12:15 PM ET) and monitor Q1 earnings setup
Why this works:
- ⏰ Conference happening TODAY could move stock materially - wait to see CFO commentary
- 📊 Stock at 52-week highs after 25% rally in one month - zero margin of safety at current levels
- 💸 Implied volatility still elevated (22.5% for March) - options expensive
- 🎯 Better entry likely on any pullback to $260-265 gamma support (5-8% cheaper)
- 📉 Historical pattern: Semiconductor stocks often consolidate after big earnings rallies
- 🤔 The $5.3M institutional call buy signals bullishness, but retail should wait for confirmation
Action plan:
- 👀 Watch today's UBS conference at 12:15 PM ET for Industrial/automotive commentary
- 🎯 Look for pullback to $262-265 for stock entry if bullish thesis confirmed
- ✅ Need to see Industrial segment data points confirming acceleration (PMI, channel checks, etc.)
- 📊 Monitor unusual options activity - if institutions add MORE calls at higher strikes, confirms conviction
- ⏰ Reassess in January for Q1 earnings play (6 weeks before Feb 19 report)
Risk level: Minimal (cash position) | Skill level: Beginner-friendly
Expected outcome: Avoid potential -8-12% pullback if conference disappoints or profit-taking accelerates. Get better entry if stock consolidates. Maintain optionality for Q1 earnings setup.
⚖️ Balanced: Bull Put Spread (Cash-Secured Play)
Play: Sell put spread to generate income while stock consolidates
Structure: Sell $265 puts, Buy $260 puts (January 16 expiration)
Why this works:
- 💰 Collect premium while stock consolidates in $265-280 range
- 📊 Defined risk spread ($5 wide = $500 max risk per spread)
- 🎯 Targets gamma support zone at $265 (2.01B gamma) - strong technical floor
- 🛡️ $11.5B buyback authorization provides natural support - management buying dips
- ⏰ 45 days to expiration gives time for any post-conference volatility to settle
- 📈 Bullish bias without paying expensive call premium (you're the seller, not buyer)
Estimated P&L:
- 💰 Collect ~$1.50-2.00 credit per spread (30-40% return on risk if held to expiration)
- 📈 Max profit: $150-200 if ADI above $265 at Jan expiration (keep entire credit)
- 📉 Max loss: $300-350 if ADI below $260 (defined and limited)
- 🎯 Breakeven: ~$263-263.50
- 📊 Risk/Reward: 1.5-2:1 (favorable for defined-risk bullish play)
Entry requirements:
- ⏰ Enter AFTER today's UBS conference if commentary is bullish
- 🎯 Only enter if stock trading above $268 (gives 3-point cushion)
- ❌ Skip if stock breaks below $265 support (structure too risky)
Management plan:
- 📊 Close at 50% profit if achieved quickly (take $0.75-1.00 on $1.50-2.00 credit)
- ⚠️ Roll down and out if stock approaches $265 before expiration
- 🎯 Let expire worthless if ADI above $265 at Jan expiration (max profit)
Position sizing: Risk only 3-5% of portfolio (even though defined risk, don't overconcentrate)
Risk level: Moderate (defined risk, bullish assumption) | Skill level: Intermediate
Why this is better than buying calls: You're selling elevated volatility instead of buying it. The $265 strike has 2.01B gamma support and sits 5% below current price. As long as ADI holds the November breakout, this spread profits.
🚀 Aggressive: Copy the Institutional Call Buyer (ADVANCED!)
Play: Buy smaller version of the $5.3M call trade
Structure: Buy $280 calls (March 20 expiration - SAME as institutional trade)
Why this could work:
- 🐋 "Smart money" deployed $5.3M at these levels - following institutional footsteps
- 📊 Call buyer clearly has conviction ADI breaks $280 and runs to $290-300+
- ⏰ March expiration captures Q1 earnings (Feb 19) plus 30-day post-earnings reaction
- 🎯 Only need 9.4% move to breakeven ($293.30) over 3.5 months - achievable if Industrial recovery continues
- 🚀 Analyst price targets clustering at $290 provide clear roadmap
- 💪 Best-in-class fundamentals: 69.8% gross margins, 43.5% operating margins, $11.5B buyback
- 🤖 AI infrastructure exposure provides upside optionality if story develops
Why this could blow up (SERIOUS RISKS):
- 💸 EXPENSIVE: Calls cost ~$13-14 per contract ($1,300-1,400 per call)
- ⏰ TIME DECAY: Theta burns ~$30-40/day as expiration approaches
- 😱 OUT-OF-THE-MONEY: Stock needs to rally 4.5% just to reach strike, then another 5% to breakeven
- 📊 Binary earnings risk: Q1 results on Feb 19 could gap stock down 10-15% if disappoints
- 🎢 Tariff wildcard: January 1 tariff increase could pressure margins and stock
- ⚠️ Automotive weakness: If auto segment deteriorates further, could weigh on valuation
- 💰 Valuation risk: Stock already up 25% in one month - profit-taking could stall momentum
Estimated P&L:
- 💰 Cost: ~$13-14 per call
- 📈 Profit scenario: Stock at $300 by March = $6-7 gain (43-50% ROI)
- 🚀 Home run: Stock at $310 by March = $16-17 gain (114-121% ROI!)
- 📉 Breakeven: Stock at $293-294 by March (9.4% rally needed)
- 💀 Total loss: Stock below $280 at expiration = lose entire premium (100% loss)
Position structure options:
- All-in bet: Buy naked calls (max leverage, max risk)
- Call spread: Buy $280 calls, sell $290 calls (reduces cost to ~$6-7 but caps upside at $290)
- Calendar spread: Buy March $280 calls, sell January $280 calls (reduce cost, benefit from time decay of short call)
CRITICAL WARNINGS - DO NOT attempt unless you:
- ✅ Can afford to lose ENTIRE premium (real possibility if stock consolidates!)
- ✅ Understand theta decay will erode value every day, even if stock moves sideways
- ✅ Have traded options through earnings and understand gap risk
- ✅ Accept that you're betting AGAINST current consolidation - need breakout to $280+
- ✅ Can monitor position regularly and take profits if stock spikes to $285-290 pre-expiration
- ⏰ Plan to close position after Q1 earnings reaction (don't hold to March expiration unless deeply in-the-money)
Entry timing:
- ⏰ Enter AFTER today's UBS conference if commentary confirms bullish thesis
- 🎯 Best entry on any pullback to $265-268 (reduces breakeven requirement)
- ❌ DO NOT chase if stock already at $275+ (too close to strike with limited time value)
Risk level: HIGH (can lose 100% of premium) | Skill level: Advanced only
Probability of profit: ~35-40% (needs material rally through resistance)
Why the institutional buyer might have edge: They may have:
- 🏢 Channel checks showing Industrial orders accelerating
- 📊 Advance knowledge of customer design wins
- 🤝 Insights into tariff mitigation strategies
- 💰 Hedges or portfolio positions retail can't replicate
- ⏰ Ability to average into position or roll if needed (deep pockets)
If you do this trade:
- 🎯 Set profit target at 40-50% gain and take it (don't get greedy)
- ⚠️ Set stop loss at -40% and honor it (down to ~$8 per call)
- 📊 Close immediately if stock breaks below $265 support (thesis invalidated)
- 💡 Consider scaling in: buy 1/3 now, 1/3 on dip to $265, 1/3 if breaks above $275
⚠️ Risk Factors
Don't get caught by these potential landmines:
-
⏰ UBS Conference TODAY creates immediate volatility risk: CFO Puccio speaking at 12:15 PM ET could move stock materially based on Industrial/automotive commentary. If he sounds cautious on Q1 or highlights tariff concerns, stock could gap down 3-5%. Conference happening SAME DAY as $5.3M call trade suggests institutional buyer may have advance knowledge of bullish talking points. Retail should wait for actual commentary.
-
💸 Tariff shock effective January 1, 2025: Semiconductor tariffs increasing from 25% to 50% in just 30 days. ADI's 69.8% gross margin provides buffer, but any inability to pass costs through could compress margins to 68% or below. Management explicitly cited tariff policy as headwind - this is REAL and IMMINENT risk.
-
🚗 Automotive segment deterioration: Down 1% sequentially in Q4 and guided for mid-single digit decline in Q1. At 30% of revenue, this is material. If decline accelerates to high-single digits or double digits, it overwhelms Industrial strength. EV market volatility and traditional auto weakness create double whammy.
-
📉 Insider selling totaling $9.6M in Q4: CEO sold $2.16M worth in two separate transactions, EVP sold $4.5M. While conducted under 10b5-1 plans (suggesting pre-planned), the LACK of any insider buying at current levels is notable. If executives truly believed in $300+ upside, why not buy alongside the $11.5B buyback?
-
🎢 Parabolic move creates pullback risk: Up 25% in ONE MONTH from $215 to $268 on earnings beat. This is classic "too far, too fast" setup. Even with strong fundamentals, stocks don't go straight up. Technical consolidation back to $260-265 or even $255 wouldn't invalidate bull thesis but would destroy these $280 calls. RSI likely extreme overbought.
-
💰 Valuation offers no margin of safety: At current levels, ADI needs PERFECT execution to justify price. Forward P/E stretched vs. historical range. If Q1 earnings are merely "good" instead of "great," stock could sell off 8-12% on profit-taking. The market has already priced in the Industrial recovery - what's the next leg of the story?
-
🇨🇳 China trade tensions wildcard: U.S.-China tariffs exceeded 100% on certain goods in April 2025. China export restrictions on critical materials create supply chain vulnerabilities. While ADI has record design wins in China automotive, geopolitical escalation could shut down that opportunity overnight.
-
📊 Q1 earnings binary event on Feb 19: Only 2.5 months away and falls 1 month before call expiration. Results could gap stock 10-15% either direction. Even though guidance is above Street, if Industrial momentum disappoints or automotive weakness worsens, stock could drop to $250-255. Conversely, major beat could send it to $285-290. This is embedded risk in the call trade.
-
🏭 Industrial segment execution risk: While Q4 showed strong +23% YoY growth, this is coming off depressed 2024 base. If the recovery stalls or was merely inventory rebuild (not end-demand), Q1 could disappoint. Management guiding only mid-single digit sequential growth - if it comes in low-single digits, bull thesis weakens.
-
💀 Gamma ceiling at $280 creates mechanical resistance: 1.52B call gamma at $280 strike means market makers will SELL into rallies as stock approaches. This creates natural supply. Would need sustained institutional buying to overcome. The call buyer is essentially betting they can BREAK through this level - but gamma dynamics work against them.
-
🌍 Macro recession risk: Semiconductors are highly cyclical. If U.S. or global economy enters recession in 2026, even ADI's best-in-class margins won't protect stock from 20-30% correction. Industrial and automotive segments would get crushed simultaneously. The call trade assumes benign-to-positive macro - risky assumption given yield curve, credit spreads, and global growth concerns.
🎯 The Bottom Line
Real talk: Someone just bet $5.3 MILLION that ADI breaks out above $280 and runs to $290-300+ over the next 3.5 months. This isn't a hedge or complex spread - this is a pure bullish bet by an institution that clearly believes the semiconductor recovery story has more room to run.
What this trade tells us:
- 🎯 Sophisticated player with deep conviction ADI continues rally (not just consolidates)
- 💰 Willing to pay $13.30/share for March $280 calls suggests they see path to $300+
- ⚖️ The timing (same day as UBS conference) is NOT coincidental - they may have insights into bullish CFO commentary
- 📊 They positioned AFTER the earnings beat/rally, not before - this is momentum chasing with conviction
- ⏰ March 20 expiration captures Q1 earnings (Feb 19) plus reaction time - perfectly structured for catalyst
This is a "buy the breakout and ride the momentum" signal, NOT a "bottom fishing" signal.
If you own ADI:
- ✅ Congrats on the 25% rally! Consider trimming 20-30% at $268+ levels to lock in gains
- 📊 If holding through Q1 earnings, set MENTAL STOP at $265 (gamma support) to protect remaining position
- ⏰ The institutional call buy validates your thesis - they're betting WITH you
- 🎯 If stock breaks $280, could re-add trimmed shares on momentum to $290-295
- 🛡️ Consider selling covered calls at $280 or $285 against position to generate income (that's what market makers are doing!)
If you're watching from sidelines:
- ⏰ TODAY at 12:15 PM ET - Watch UBS conference for CFO commentary on Industrial/automotive outlook
- 🎯 Post-conference dip to $262-265 would be EXCELLENT entry (buyback support + gamma floor)
- 📈 Looking for confirmation: Industrial data improving (PMIs, bookings), automotive stabilizing, tariff mitigation plan
- 🚀 Q1 earnings setup (Feb 19) looks favorable with guidance already 4.4% above Street
- ⚠️ Current price ($268) offers minimal margin of safety - patience pays at these levels
If you're considering the call trade:
- 🎯 This is HIGH RISK - only for traders comfortable losing 100% of premium
- ⏰ Better entry after conference if stock dips to $265 (lowers breakeven to $289)
- 📊 Consider call spread ($280/$290) instead of naked calls to reduce cost by 50%
- 💡 Plan to take 40-50% profits if achieved, don't hold for home run
- ⚠️ Set hard stop at -40% loss and honor it
Mark your calendar - Key dates:
- 📅 December 2 (TODAY) 12:15 PM ET - UBS Global Technology Conference (CFO presenting)
- 📅 January 1, 2025 - Semiconductor tariffs increase to 50% (watch for margin impact)
- 📅 January 16 - Monthly OPEX (intermediate expiration)
- 📅 February 19, 2025 - Q1 FY2026 earnings report (MAJOR CATALYST!)
- 📅 March 20, 2026 - March OPEX, expiration of this $5.3M call trade
- 📅 End of FY2026 - Management targeting 71% gross margin milestone
Final verdict: ADI's fundamental story is STRONG - Q4 beat with +26% revenue growth, Industrial recovery validated (+23% YoY), best-in-class 69.8% gross margins, $11.5B buyback authorization, and analyst upgrades continuing. The $5.3M institutional call buy is a CLEAR bullish signal.
BUT - at $268 after a 25% rally in one month with tariffs looming January 1st and automotive weakness persisting, the risk/reward for aggressive new call buying is MARGINAL unless you have the same information edge as the institutional buyer.
Smarter play: Wait for today's conference commentary, then look for entries on dips to $262-265. The semiconductor recovery will still be here in 2-3 weeks, and you'll sleep better paying $265 instead of $268.
If the institutional buyer is right and ADI runs to $300, you'll still make great returns from $265. If they're wrong and it consolidates at $260, you'll be glad you waited.
Be patient. Let the catalysts play out. Protect your capital while staying positioned for the bull case. 💪
Disclaimer: Options trading involves substantial risk of loss and is not suitable for all investors. This analysis is for educational purposes only and not financial advice. Past performance doesn't guarantee future results. The 93.6 Z-score reflects this specific trade's size relative to recent ADI history - it does not imply the trade will be profitable or that you should follow it. Always do your own research and consider consulting a licensed financial advisor before trading. The $280 strike calls are currently out-of-the-money and will expire worthless if ADI remains below $280 at March expiration. Time decay accelerates in final 30-60 days. UBS conference today could create immediate volatility. Tariffs effective January 1, 2025 present material margin risk.
About Analog Devices: Analog Devices is a leading analog, mixed-signal, and digital-signal processing chipmaker specializing in converter chips that transform analog signals to digital formats and vice versa, serving primarily industrial, automotive, and wireless infrastructure markets with a market cap of $130.5 billion in the Semiconductors & Related Devices industry.