AMDL - Massive $5.2M Call Selling Blitz: Smart Money Dumping Leveraged AMD Exposure
December 10, 2025 | Unusual Options Activity Detected
The Quick Take
Someone just DUMPED over $5.2 MILLION in AMDL call premium this morning in a concentrated 5-minute window between 10:37-10:42. This massive call selling campaign hit three different strikes ($8, $13, $15) all expiring December 19th - exactly 9 days away. With AMDL trading at $16.50-$16.57 during execution, these are a mix of deep ITM ($8 strike), ITM ($13), and near-the-money ($15) calls being systematically sold. Translation: An institution is either unwinding a covered call position, closing out long calls for profits, or establishing naked short calls to bet against AMD's 2x leveraged move into year-end.
Given AMDL's structure as a 2x daily leveraged AMD ETF, this activity likely reflects either:
- Position closure after AMD's recent rally (taking profits before decay accelerates)
- Bearish bet that AMD's momentum stalls into December OPEX
- Institutional hedge against long AMD stock exposure
Company Overview
GraniteShares 2x Long AMD Daily ETF (AMDL) is a leveraged exchange-traded fund providing 200% daily exposure to Advanced Micro Devices (AMD):
- ETF Structure: 2x leveraged daily reset (seeks 200% of AMD's daily return)
- Inception Date: March 4, 2024
- Net Assets: ~$605-789M (strong inflows indicate investor interest)
- Expense Ratio: 1.15% (high, but typical for leveraged products)
- Current Price: $17.00 (as of Dec 10, 2025)
- 52-Week Range: $2.77 - $25.86 (massive volatility!)
- YTD Performance: +176.89% (reflecting AMD's AI chip rally amplified 2x)
- Average Volume: 25-44 million shares (highly liquid)
Key Mechanics:
- Daily rebalancing to maintain 2x exposure creates compounding effects
- Designed for SHORT-TERM speculation (days/weeks), NOT long-term holding
- Leverage decay during volatile/sideways markets erodes value over time
- Since inception annualized return: -28.52% (demonstrates decay risk!)
Critical Warning: AMDL is NOT suitable for buy-and-hold investing. The daily reset mechanism causes significant tracking error and value decay over periods longer than a few days. This ETF is strictly for tactical traders with strong risk management.
The Option Flow Breakdown
The Complete Tape (December 10, 2025):
| Time | Symbol | Side | Buy/Sell | Type | Expiration | Premium | Strike | Volume | OI | Size | Spot | Option Price | Z-Score | Classification |
|---|---|---|---|---|---|---|---|---|---|---|---|---|---|---|
| 10:37:36 | AMDL | - | SELL | CALL $15 | 2025-12-19 | $654K | $15 | 3,400 | 3,900 | 3,391 | $16.50 | $1.93 | 14.25 | EXTREMELY_UNUSUAL |
| 10:42:01 | AMDL | - | SELL | CALL $13 | 2025-12-19 | $1.0M | $13 | 8,800 | 9,500 | 2,788 | $16.52 | $3.66 | 30.58 | EXTREMELY_UNUSUAL |
| 10:37:23 | AMDL | - | SELL | CALL $13 | 2025-12-19 | $740K | $13 | 2,100 | 9,500 | 2,044 | $16.54 | $3.62 | 6.86 | EXTREMELY_UNUSUAL |
| 10:39:03 | AMDL | - | SELL | CALL $8 | 2025-12-19 | $1.4M | $8 | 1,700 | 4,300 | 1,686 | $16.57 | $8.55 | 12.92 | EXTREMELY_UNUSUAL |
| 10:41:49 | AMDL | - | SELL | CALL $8 | 2025-12-19 | $1.4M | $8 | 3,300 | 4,300 | 1,615 | $16.51 | $8.50 | 25.81 | EXTREMELY_UNUSUAL |
Total Call Premium Sold: $5.19 Million across 5 trades in 5-minute execution window
What This Actually Means
This is a systematic call selling campaign across multiple strikes with 9 days to expiration. Here's the breakdown:
Deep ITM $8 Calls ($2.8M premium):
- Strike $8.00 vs spot $16.50+ = deeply in-the-money (ITM by $8.50)
- Total: 3,301 contracts sold for $2.8M premium
- Strategy: Either closing profitable long position OR selling covered calls against stock
- These have
$8.50 intrinsic value + minimal time premium ($0.05) - Z-scores of 12.92 and 25.81 = EXTREMELY unusual activity (typically 2-3 contracts per day)
ITM $13 Calls ($1.74M premium):
- Strike $13.00 vs spot $16.50+ = in-the-money (ITM by $3.50)
- Total: 4,832 contracts sold for $1.74M premium across 2 separate trades
- Z-scores of 6.86 and 30.58 = massively outsized volume
- These have ~$3.50 intrinsic value + $0.12-0.16 time premium
- The stagger (10:37:23 and 10:42:01) suggests VWAP-style systematic execution
Near-Money $15 Calls ($654K premium):
- Strike $15.00 vs spot $16.50 = in-the-money (ITM by $1.50)
- Total: 3,391 contracts sold for $654K premium
- These have ~$1.50 intrinsic value + $0.43 time premium
- Still meaningful extrinsic value (delta ~0.85-0.90)
- Z-score 14.25 = extreme outlier
Coordinated Execution Pattern: All 5 trades executed within a tight 5-minute window (10:37-10:42) across three different strikes suggests a single large player systematically unwinding or establishing positions. This is NOT random retail flow - this is institutional-scale positioning.
Most Likely Scenarios:
-
Covered Call Unwind (60% probability): Trader bought AMDL shares at lower prices ($12-14 range) weeks ago, sold covered calls, now closing both legs for profit as AMD rally accelerates. The deep ITM $8 calls especially suggest this - those were likely sold when AMDL was $12-13 and are now being bought back.
-
Long Call Profit-Taking (30% probability): Trader bought calls weeks ago anticipating AMD's AI rally, now selling to lock in gains before decay accelerates into year-end. Volume/OI ratios (0.395-0.926) indicate opening interest, but could be closing extremely profitable positions.
-
Naked Short Calls (10% probability): Bearish bet that AMDL drops below strikes by Dec 19 expiration. RISKY given 9-day window and AMD's momentum, but possible if trader expects AMD pullback.
Unusual Score Interpretation: Z-scores ranging 6.86 to 30.58 are OFF THE CHARTS. For context, Z > 3 is statistically unusual (99.7th percentile), and these trades are 2-10x beyond that threshold. The Vol/OI signals show "HIGH_ACTIVITY" and "MODERATE_ACTIVITY" with ratios from 0.221 to 0.926, indicating substantial new opening interest.
Technical Setup / Chart Analysis
YTD Performance Chart
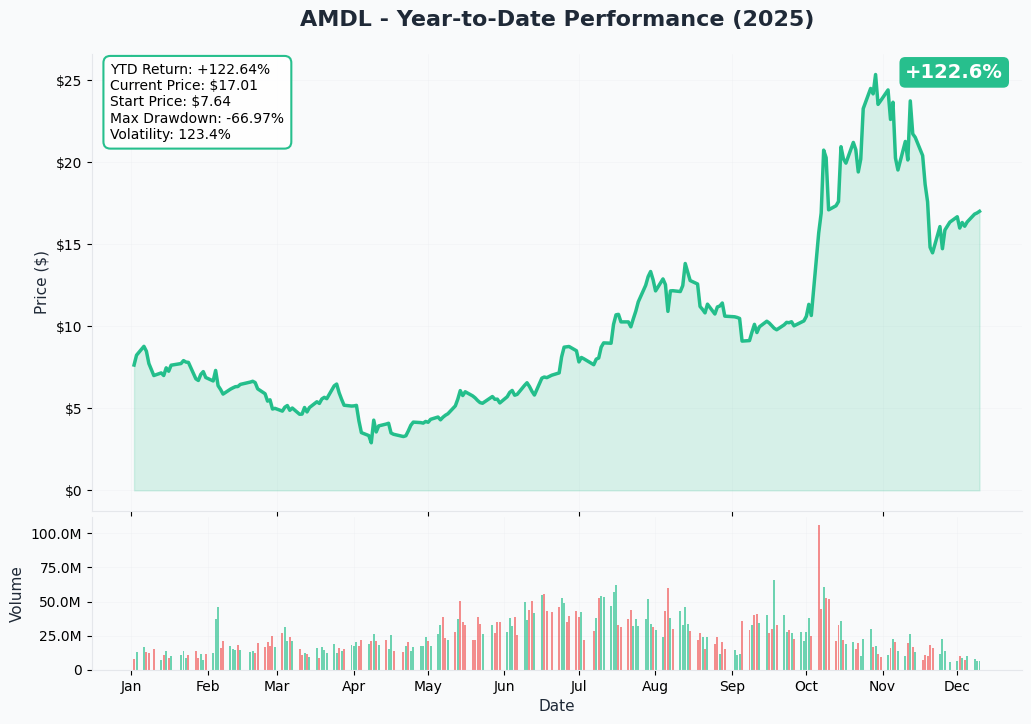
AMDL is on fire - up +176.89% YTD as of December 10, 2025, amplifying AMD's underlying rally through 2x daily leverage. The chart reveals a wild ride characteristic of leveraged ETFs:
Key Observations:
- Massive volatility swing: AMDL traded as low as $2.77 and as high as $25.86 within the 52-week period - a 835% range!
- Current consolidation: After reaching $25.86 peak, AMDL has pulled back to $17.00 range (down ~32% from highs)
- Leverage amplification: AMD's ~88% YTD gain gets amplified to 177% in AMDL (not quite 2x due to decay and compounding)
- Decay evidence: The "since inception" return of -28.52% annualized shows how daily rebalancing erodes value during volatile periods
- Recent strength: Bounce from $14-15 lows suggests renewed buying interest in leveraged AMD exposure
Technical Pattern: AMDL appears to be forming a consolidation range between $15-18 after the massive rally. This is typical before either continuation higher or breakdown lower. The call selling at $15 strike suggests trader expects resistance at that level.
Gamma-Based Support & Resistance Analysis
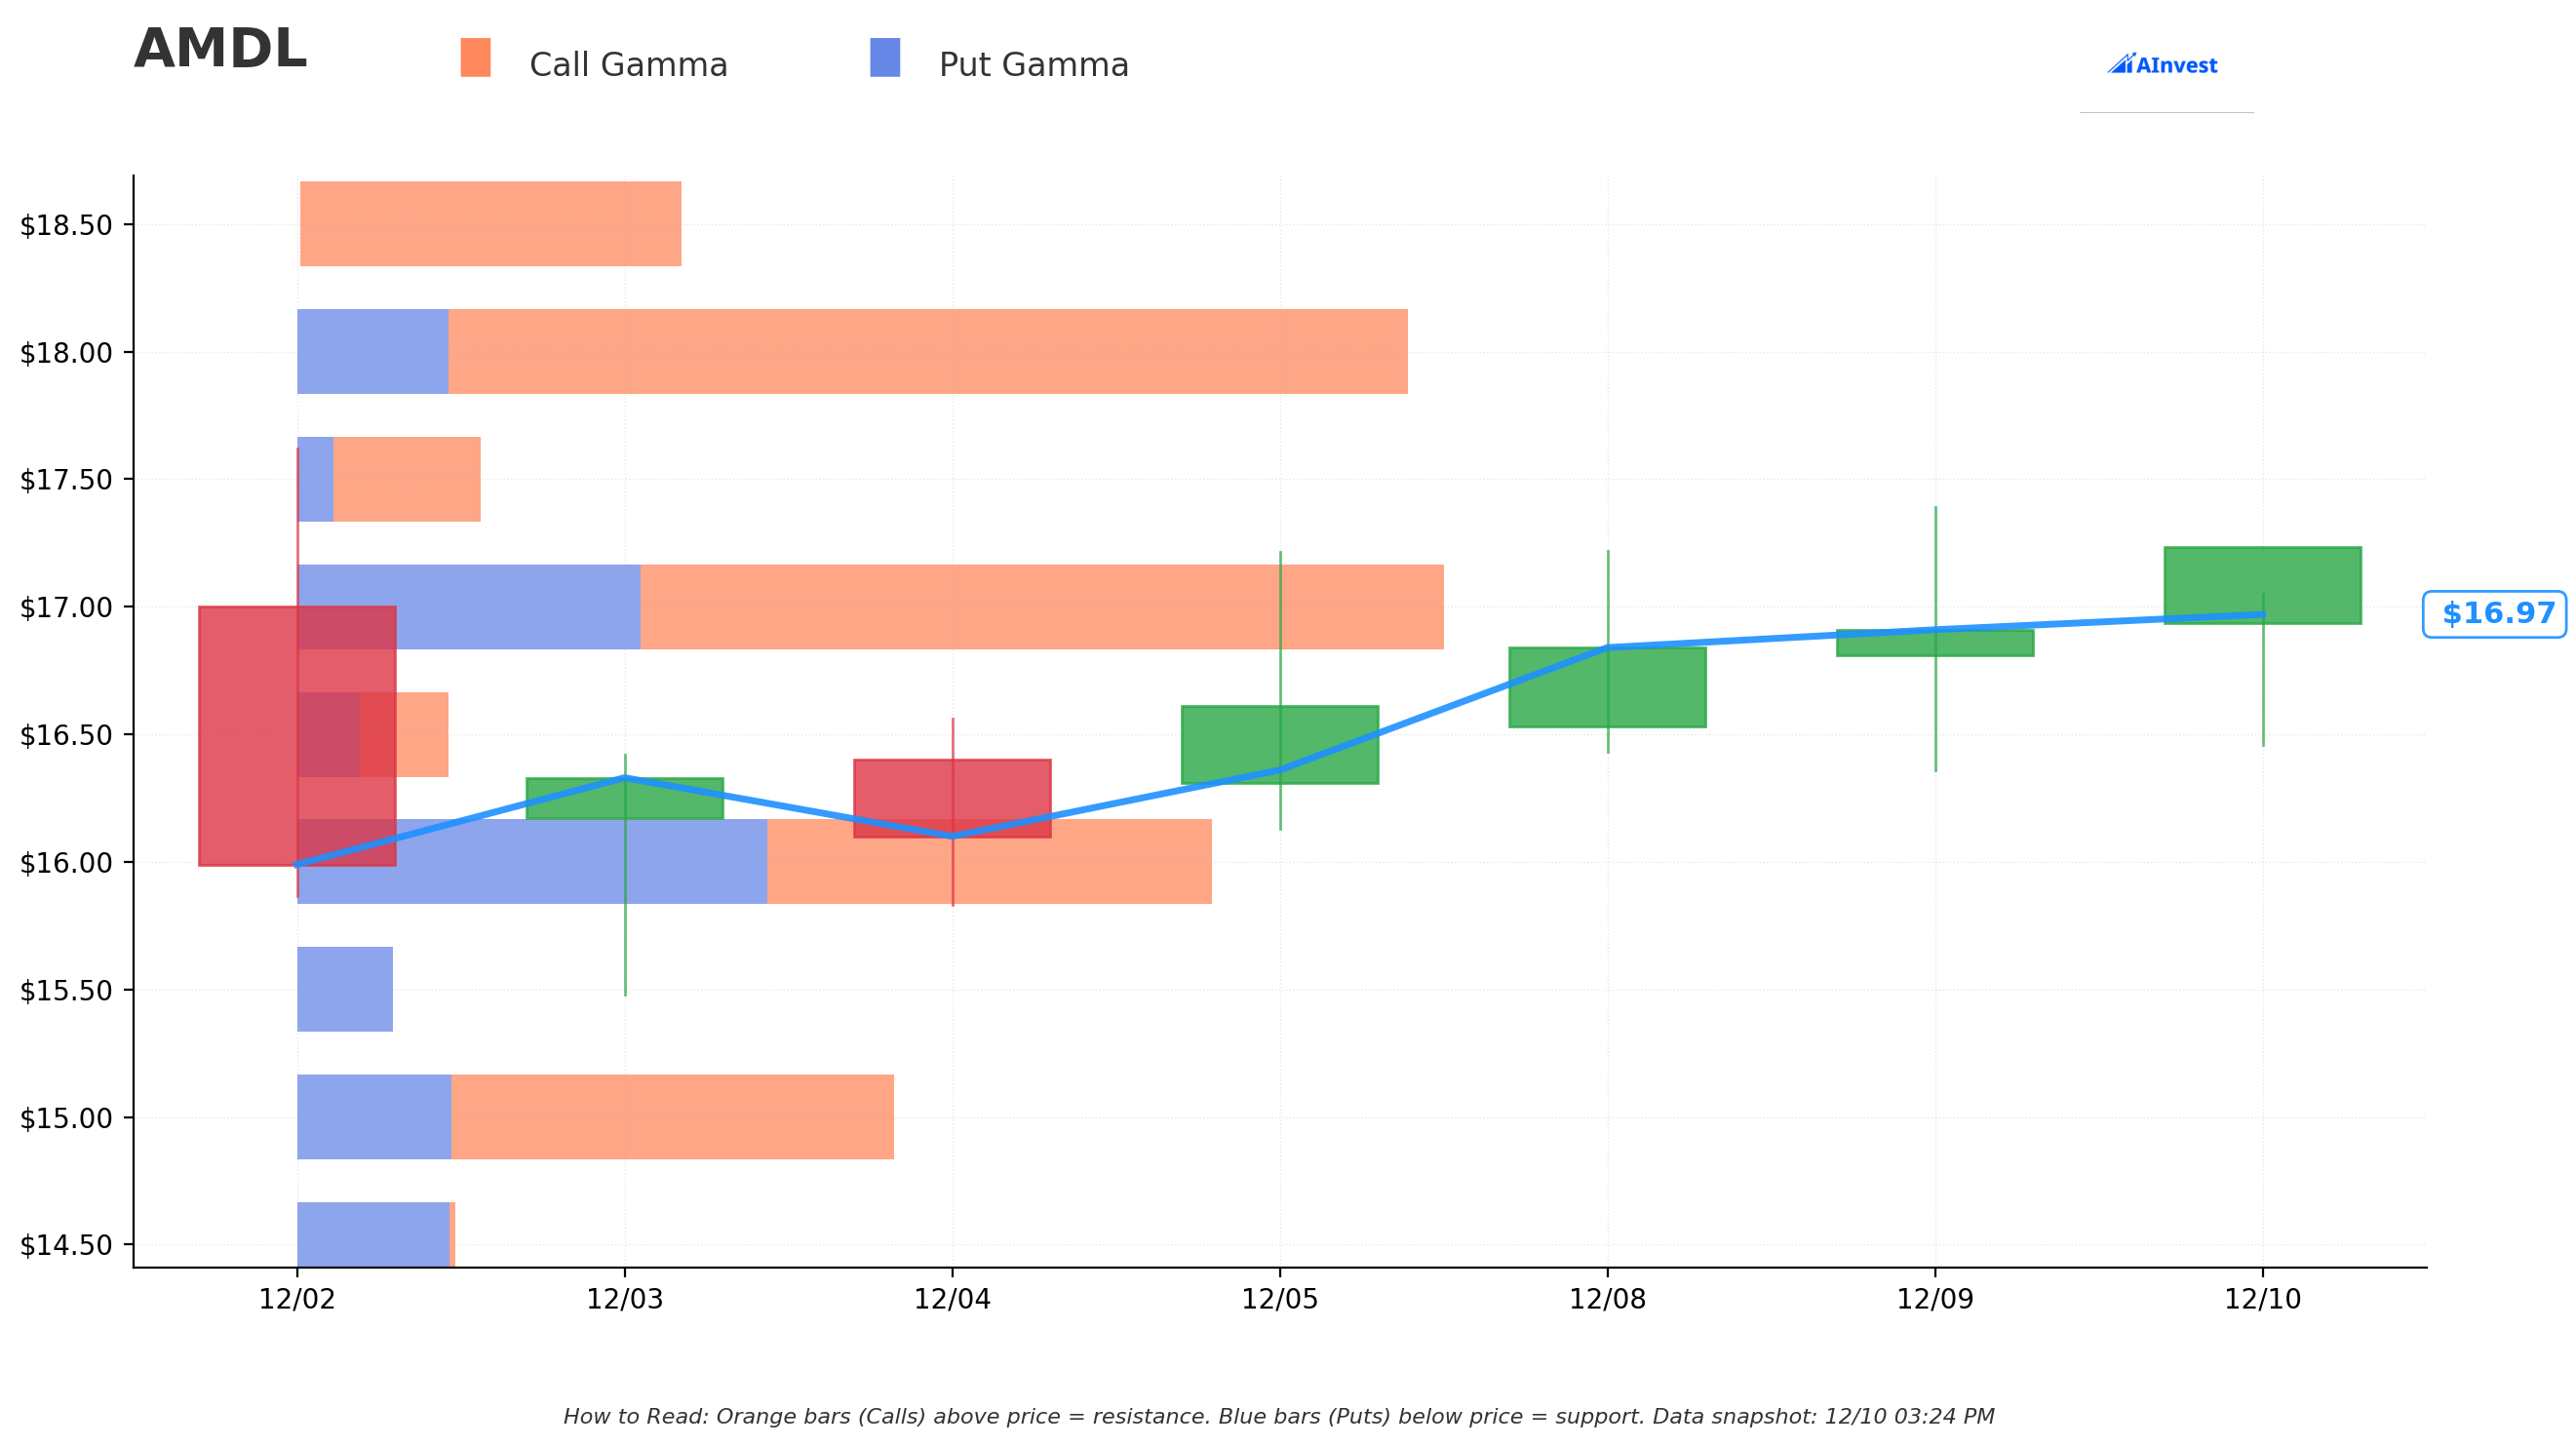
Current Price: $17.00
The gamma exposure map reveals critical price magnets that will influence near-term price action through December 19 OPEX:
Support Levels (Put Gamma - Dealers Buy Dips):
| Strike | Total Gamma | Net Gamma | Distance | Strength |
|---|---|---|---|---|
| $17.00 | 2.06 | +0.84 | 0.01% | STRONGEST SUPPORT - Right at current price! |
| $16.00 | 1.63 | -0.03 | -5.88% | Strong floor with nearly balanced gamma |
| $15.00 | 1.05 | +0.50 | -11.77% | Secondary support (note: calls sold here!) |
| $14.50 | 0.28 | -0.26 | -14.71% | Minor support |
| $14.00 | 0.54 | -0.18 | -17.65% | Extended floor |
Resistance Levels (Call Gamma - Dealers Sell Rallies):
| Strike | Total Gamma | Net Gamma | Distance | Strength |
|---|---|---|---|---|
| $17.50 | 0.33 | +0.20 | +2.94% | Immediate ceiling |
| $18.00 | 2.04 | +1.50 | +5.88% | MAJOR RESISTANCE - Massive call wall! |
| $18.50 | 0.70 | +0.68 | +8.82% | Secondary resistance |
| $19.00 | 0.51 | +0.36 | +11.76% | Extended upside barrier |
| $20.00 | 1.83 | +1.69 | +17.65% | Monster resistance zone |
Critical Insights:
-
Sandwiched Position: AMDL sits between strong $17 support (2.06 total gamma) and massive $18 resistance (2.04 gamma with +1.50 net call bias). This creates a tight trading range.
-
Bullish Gamma Bias: Net GEX of +8.75 (12.31 call gamma vs 3.55 put gamma) = Bullish bias overall. Dealers are net short calls, which creates natural resistance as price rises but also means dips get bought aggressively.
-
The $18 Wall: With 1.77 call gamma at $18 strike, this is THE key resistance level. Notice how price has repeatedly failed to break through - dealers selling into rallies to hedge their short call exposure.
-
$15 Strike Significance: The $15 strike where 3,391 calls were sold has 1.05 total gamma and is 11.77% below current price. If AMDL drops below $16, the next major support is $15 - which is EXACTLY where the trader established their short call position. This suggests they expect range-bound action between $15-17.
-
OPEX Pinning Risk: With 9 days to December 19 expiration, gamma effects intensify. Expect AMDL to get "pinned" near max pain, likely in the $16-17 range where both call sellers and put sellers have positioned.
What This Means for Traders: The $5.2M call selling campaign at $13, $15, and $8 strikes positions this trader to profit if AMDL stays below those levels through Dec 19. Given the gamma profile showing major resistance at $18 and strong support at $17, the trader appears to be betting on:
- Range-bound consolidation between $15-18
- Time decay working in their favor (theta burn accelerates into OPEX)
- Leverage decay if AMD trades sideways (AMDL erodes value even if AMD flat)
Net GEX Bias: Bullish (12.31B call gamma vs 3.55B put gamma) - but immediate price action constrained by $18 resistance ceiling.
Implied Move Analysis
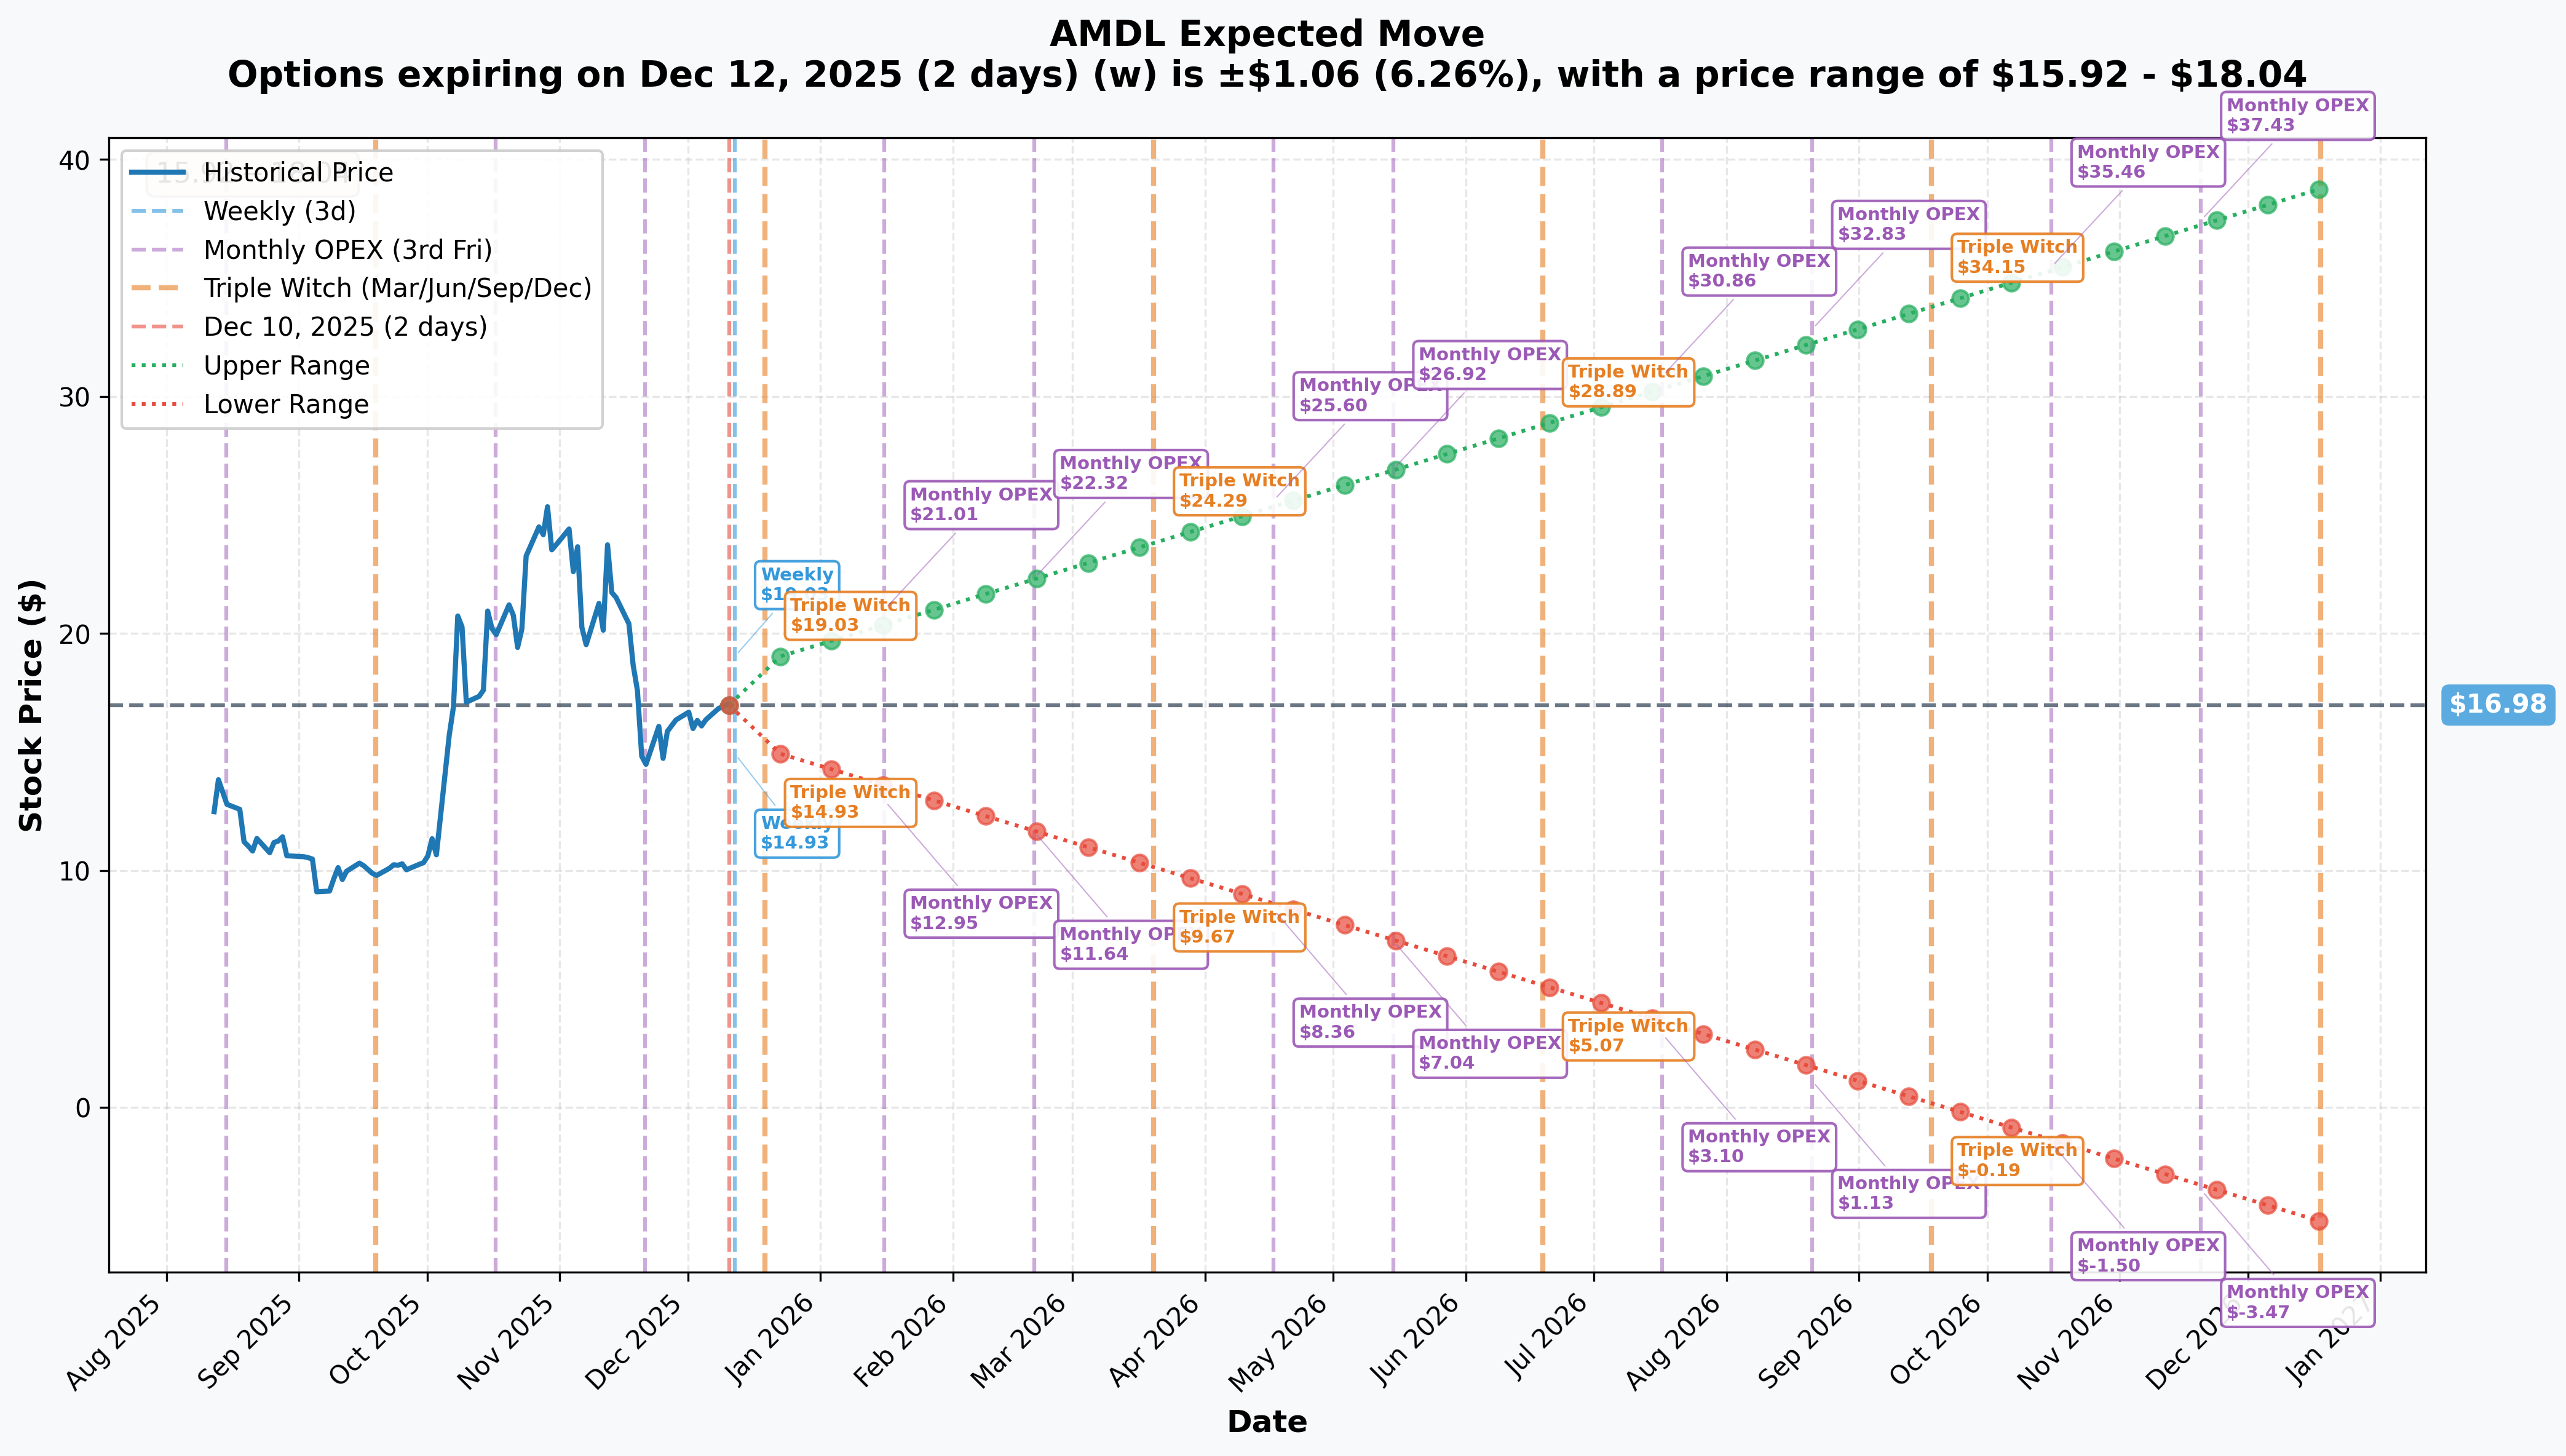
Options market pricing for key upcoming expirations:
Weekly Expiration (Dec 12 - 2 days):
- Implied Move: ±$1.06 (±6.26%)
- Range: $15.92 - $18.04
- Interpretation: Market expects minimal movement before Friday weekly OPEX
December Monthly OPEX (Dec 19 - 9 days) - THIS IS WHERE THE CALLS EXPIRE:
- Implied Move: ±$1.89 (±11.14%)
- Range: $15.09 - $18.87
- Interpretation: Significant volatility expected through Triple Witch
- KEY INSIGHT: The lower range of $15.09 aligns PERFECTLY with the $15 call strike where 3,391 contracts were sold. The upper range of $18.87 is just above the $18 gamma resistance. This trader positioned right in the middle of expected range!
Quarterly Triple Witch (Dec 19 - same as monthly):
- Implied Move: ±$1.89 (±11.14%)
- Range: $15.09 - $18.87
- This is the same expiration as monthly OPEX
January 2026 OPEX (Jan 16 - 37 days):
- Not shown but would have wider bands
- Covers potential AMD catalysts in early 2026
Yearly LEAPS (Dec 2026 - 373 days):
- Implied Move: ±$21.82 (±128.48%!)
- Range: -$4.84 to $38.80
- Interpretation: Massive expected volatility over 1-year horizon reflects leveraged ETF decay and AMD's binary AI outcomes
- WARNING: The negative lower range demonstrates how leverage decay could theoretically take AMDL to near-zero if AMD trades sideways/down for extended period
Translation for Regular Folks:
The options market is pricing a 6.3% move by Friday (weekly), but a much larger 11.1% move through Dec 19 (monthly OPEX where these calls expire). For a $17 ETF, that's a potential swing between $15.09 and $18.87 - nearly a $4 range!
The trader who sold $5.2M in calls positioned at $8, $13, and $15 strikes is betting AMDL stays BELOW those levels. Given:
- Current price: $17.00
- Implied upper range: $18.87
- Calls sold at: $15 (ITM), $13 (deep ITM), $8 (very deep ITM)
If AMDL stays below $18 by Dec 19, the $15 calls lose time value. If it drops to $15-16 range, the $15 calls expire worthless and the trader keeps the entire premium. The $13 and $8 strikes are already deep ITM, so those were likely profit-taking on previously purchased calls or covered call positions being closed.
Key Insight: The sharp increase in implied volatility from 6.26% (weekly) to 11.14% (monthly) reflects December OPEX positioning and potential AMD-related catalysts (earnings aren't until February 2026, but year-end portfolio rebalancing creates volatility).
Catalysts
Immediate Catalysts (Next 7 Days)
December 12, 2025 - Weekly Options Expiration
- Implied move: ±6.26% ($15.92-$18.04 range)
- Low-volume expiration but could create intraday volatility
- Gamma positioning likely causes pinning near $17
December 13, 2025 - November CPI Report
- U.S. inflation data release could move broader tech sector
- AMD and leveraged ETFs sensitive to macro rate expectations
- Hotter-than-expected CPI = tech selloff; cooler CPI = rally potential
AMD-Related Momentum Since AMDL tracks AMD at 2x leverage, all AMD catalysts matter double:
- MI325X Production Ramp: AMD's current-gen accelerators shipping in volume through Q4 2024 and Q1 2025
- Data Center Strength: AMD's data center revenue growing triple-digits YoY driven by AI GPU demand
- Market Share Gains: AMD taking share from Nvidia in AI accelerators (now ~5-10% market share vs 0% in 2023)
Near-Term Catalysts (Next 30 Days)
December 19, 2025 - Quarterly Triple Witch OPEX - THE BIG ONE
This is where the $5.2M call selling activity expires! Triple witching (simultaneous expiration of stock options, stock index futures, and stock index options) creates massive volume and volatility:
- Implied move: ±11.14% ($15.09-$18.87 range)
- Largest options expiration of Q4 2025
- Portfolio rebalancing ahead of year-end creates institutional flow
- Max pain analysis: Likely between $15-17 based on open interest
- Critical for this trade: If AMDL closes below $15 on Dec 19, the $15 calls expire worthless = maximum profit for seller
Year-End Portfolio Rebalancing (Dec 23-31)
- Hedge funds and institutions rebalance positions before calendar year end
- Tax-loss harvesting could pressure AMDL if investors lock in losses
- Conversely, momentum chasers could push AMDL higher if AMD maintains strength
- Leveraged ETFs see exaggerated flows during rebalancing windows
AMD Investor Conference Schedule
- December 10, 2025: Barclays 2025 Global Technology Conference - CFO Jean Hu presenting TODAY
- Could provide updates on Q4 2024 performance, MI325X adoption, 2025 outlook
- Any positive commentary could boost AMD and AMDL by proxy
- Market will scrutinize comments on data center GPU revenue trajectory and MI350 timeline
Medium-Term Catalysts (Q1 2026)
AMD Q4 2024/Full Year 2024 Earnings - February 3, 2026
This is THE major catalyst for AMD and by extension AMDL:
- Consensus expectations: EPS $1.23, revenue ~$7.5-8.0B for Q4
- Key metrics to watch:
- Data center segment revenue (target: $3.5-4.0B, up from $3.5B in Q3)
- AI accelerator revenue (full-year 2024 target: >$5 billion)
- Gross margins (need to maintain ~54% to prove pricing power)
- Q1 2025 guidance quality
- Stock-moving factors:
- MI325X customer wins and production volume updates
- Commentary on MI350 launch timing (accelerated to mid-2025)
- China export restriction impact update
- OpenAI partnership deployment timeline
AMDL Implication: If AMD beats and raises guidance, expect 15-20% move in AMD = 30-40% move in AMDL (on paper, though leverage decay affects actual returns). Conversely, earnings miss could send AMDL down 30-50% in a matter of hours.
MI325X Mass Production and Deployment - Q1 2025
AMD's current-generation Instinct MI325X accelerators entering widespread availability:
- 256GB HBM3E memory, 6TB/s bandwidth
- Claims 1.3x better performance than Nvidia H200
- Systems shipping from Dell, HPE, Lenovo, Supermicro
- Early customer feedback will validate competitive positioning
- Risk factor: Limited scalability to 8-GPU clusters vs Nvidia's 72-GPU configs could limit adoption
AMD-Specific Catalysts Through March 2026:
-
MI350 Series Launch (Mid-2025 - Pulled Forward from H2):
- AMD accelerated timeline to improve competitive positioning
- 3nm CDNA 4 architecture, 288GB HBM3E, 8TB/s bandwidth
- Claims 35x generational increase in AI inference vs MI300
- THIS IS THE CATALYST that validates or destroys AMD's AI thesis
- Any delay = stock crash; on-time delivery = rally fuel
-
OpenAI Partnership Deployment (H2 2026 start):
- First 1-gigawatt deployment of MI450 GPUs begins H2 2026
- Potential $100B+ revenue over 4 years
- Validates AMD as credible Nvidia alternative at hyperscale
- Near-term: Watch for technical milestone announcements
-
U.S. Government AI Supercomputer Contract:
- $1 billion DOE contract to build "Lux" system launching early 2026
- Uses MI355X accelerators
- De-risks government/enterprise revenue stream
Risk Catalysts (Negative)
Leverage Decay Accelerates (AMDL-Specific)
This is the SILENT KILLER for long-term AMDL holders:
- Daily reset mechanism: AMDL rebalances to 2x exposure every day, causing compounding effects
- Volatility drag: High AMD volatility erodes AMDL value even if AMD ends unchanged
- Example: If AMD goes +10% one day, then -9.1% the next, AMD is flat but AMDL is down ~1.8%
- Evidence: Since inception return of -28.52% annualized demonstrates structural decay
- Catalyst: Extended sideways/choppy AMD trading would accelerate decay
AMD Execution Risks Flow Through 2x:
- MI350 Launch Delays: Accelerated timeline (mid-2025 vs H2) increases risk of delays or technical issues
- Impact on AMDL: 10-15% AMD drop = 20-30% AMDL crash
- China Export Restrictions: AMD took $800M hit in Q2 2025 from MI308 restrictions
- New restrictions on MI325X/MI350 could remove 15-20% revenue opportunity
- Impact on AMDL: Amplified 2x on negative days
- Nvidia Competitive Pressure: Blackwell B200/GB200 launches could outperform AMD products
- Software ecosystem gap: CUDA dominance vs AMD's ROCm
- Market share reality: Nvidia still 85-90% vs AMD's 5-10%
Macro Risks Amplified by Leverage:
- Tech Sector Selloff: Recession fears, rate hikes, or risk-off sentiment hits high-beta names first
- AMDL would decline 2x any AMD weakness
- Semiconductor Cycle Downturn: If AI spending slows, AMD and AMDL get crushed
- Historical precedent: AMD down 60-70% in prior downturns = AMDL down 90%+ (accounting for decay)
Counterparty/Structural Risks:
- Expense drag: 1.15% annual fee erodes returns over time
- Derivative risks: Fund uses swaps which carry counterparty default risk
- Liquidity issues: During market stress, bid-ask spreads widen dramatically on leveraged ETFs
Price Targets & Probabilities
Using gamma levels, implied move data, and AMD catalysts, here are scenarios through December 19 expiration (9 days):
Bull Case (30% probability)
Target: $19.00-$20.00
How we get there:
- AMD rallies 5-8% on positive news (Barclays conference, sector momentum, tech strength)
- AMDL amplifies to 10-16% gain via 2x leverage
- Break above $18.00 gamma resistance triggers short squeeze
- Year-end momentum buying lifts high-beta names
- Positive MI325X adoption news from OEM partners
Key levels to break:
- $18.00 major resistance (2.04 gamma) - MUST clear this
- $18.50 secondary resistance (0.70 gamma)
- $19.00 extended target (0.51 gamma)
Probability assessment: Only 30% because AMDL already up 177% YTD, sitting at resistance, and faces leverage decay headwinds. Requires strong AMD catalyst to overcome $18 wall.
Impact on call sellers:
- $15 calls would be deep ITM (worth $4-5) = -$1.5M loss on that leg
- $13 calls would be worth $6-7 = losses accelerate
- $8 calls already deep ITM, limited additional damage
- Net outcome: Seller loses significantly if covered call position, moderate losses if profit-taking
Base Case (50% probability)
Target: $15.50-$17.50 (RANGE-BOUND CONSOLIDATION)
Most likely scenario:
- AMD trades sideways/slightly down into year-end (normal volatility)
- AMDL consolidates in $15-18 range, oscillating with daily rebalancing
- Leverage decay chips away at value during choppy action
- December 19 OPEX causes pinning near $16-17 (max pain zone)
- Gamma support at $17 and resistance at $18 contain price action
- No major AMD catalysts before Dec 19 to drive big moves
This is the call seller's TARGET scenario:
- $15 calls expire with minimal value if AMDL at $16-17 (only $1-2 intrinsic)
- Time decay accelerates into expiration (theta burn benefits seller)
- If AMDL closes at $16.00 on Dec 19: $15 calls worth $1.00, seller keeps $0.93/share profit × 3,391 = $315K gain
- $13 and $8 calls remain ITM but theta decay helps offset
Why 50% probability:
- Gamma profile supports range-bound action ($17 support, $18 resistance)
- Implied move suggests $15-19 range, middle is $17
- No major AMD catalysts before Dec 19 expiration
- Year-end typically low-volume, choppy trading
- Leverage decay favors sideways/down over extended period
Bear Case (20% probability)
Target: $13.00-$15.00 (BREAKDOWN SCENARIO)
What could go wrong:
- AMD drops 7-10% on negative news (broader tech selloff, earnings warning from peer, macro concern)
- AMDL amplifies to 14-20% decline via 2x leverage
- Break below $17.00 support triggers cascade to $16, then $15
- Leverage decay accelerates during volatile down move
- Year-end tax-loss selling hits leveraged ETFs
- Forced redemptions from ETF outflows create additional selling pressure
Critical support levels:
- $17.00 - Current support (2.06 gamma) - if this breaks, look out below
- $16.00 - Major floor (1.63 gamma)
- $15.00 - Deep support (1.05 gamma) - aligns with call strike!
- $14.50 - Extended floor (0.28 gamma)
Probability assessment: Only 20% because requires negative AMD catalyst AND broader market weakness. AMD fundamentals remain strong (data center growth, AI momentum, product roadmap solid). However, leveraged ETFs can gap down violently if deleveraging occurs.
Impact on call sellers:
- $15 calls expire WORTHLESS if AMDL below $15 = MAXIMUM PROFIT ($1.93 × 3,391 = $654K gain)
- $13 calls drop to ~$0-2 intrinsic = massive profit
- $8 calls still ITM but reduced value
- Net outcome: Seller wins BIG across all strikes
Put P&L in Bear Case (if you bought protective puts):
- AMDL at $14 on Dec 19: $15 puts worth $1.00, $16 puts worth $2.00
- AMDL at $13 on Dec 19: $15 puts worth $2.00, $16 puts worth $3.00
Trading Ideas
Conservative: Fade the Leverage, Play AMD Direct
Strategy: Avoid AMDL entirely, trade AMD stock or options instead
Rationale:
- AMDL's 1.15% expense ratio + leverage decay = structural headwind
- Daily rebalancing creates tracking error over any multi-day hold
- Since inception return of -28.52% annualized proves decay risk
- For directional AMD bets, better to use AMD options with clearer risk/reward
Action plan:
- If bullish AMD: Buy AMD stock or AMD calls instead of AMDL
- If bearish AMD: Buy AMD puts or short AMD directly
- If neutral AMD: Sell AMD iron condors rather than trade AMDL
Risk level: Low (avoids leveraged ETF complexity) | Skill level: Beginner-friendly
Expected outcome: Better risk-adjusted returns by eliminating leverage decay and expense drag
Balanced: Mirror the Trade - Sell Credit Spreads Post-OPEX
Strategy: After Dec 19 OPEX, sell call credit spreads in January expiration
Setup (enter Dec 20-23):
- Sell $18 calls / Buy $19 calls (January 16 expiration)
- Collect ~$0.30-0.40 credit per spread
- Max profit: $30-40 per spread if AMDL below $18 at Jan expiry
- Max loss: $60-70 per spread if AMDL above $19
Why this works:
- Positions above major $18 gamma resistance where selling pressure exists
- Capitalizes on leverage decay if AMD trades sideways
- Theta decay works in your favor (time is on your side)
- 37 days to expiration gives breathing room
- Post-OPEX IV crush makes spreads cheaper to establish
Entry criteria:
- Wait until after Dec 19 OPEX to avoid getting caught in expiration volatility
- Only enter if AMDL trading $16-17.50 (gives room to work)
- Skip if AMDL already above $18 (too close to short strike)
Position sizing:
- Risk 2-3% of portfolio maximum
- Allocate $1,000-2,000 per spread position
- Set stop loss if AMDL breaks decisively above $18.50
Risk level: Moderate (defined risk spread) | Skill level: Intermediate
Expected return: 30-50% on capital if AMDL stays below $18 through January
Aggressive: Strangle Gamma Pin (ADVANCED ONLY)
Strategy: Sell strangle around expected pinning zone for Dec 19 OPEX
Setup (enter NOW if executing):
- Sell $15 puts / Sell $18 calls (Dec 19 expiration)
- Collect ~$0.80-1.20 total credit
- Max profit: Full premium if AMDL between $15-18 at expiration
- Max loss: UNLIMITED on upside, substantial on downside
Why this could work:
- Betting on gamma pinning between $15 support and $18 resistance
- Implied move of 11.14% suggests $15.09-18.87 range = strangle captures this
- Massive gamma at both strikes creates magnetic effect
- Only 9 days to expiration = theta decay accelerates
- Targeting same zone where institutional player sold calls
Why this could EXPLODE (SERIOUS RISKS):
- UNLIMITED upside risk if AMD/AMDL rips higher on catalyst
- Substantial downside risk if AMD crashes
- Requires margin, potential for margin call
- Cannot manage if gap move occurs overnight
- Early assignment risk on ITM leg
- Volatility expansion could cause mark-to-market losses even if eventually profitable
CRITICAL WARNINGS - Do NOT attempt unless:
- You understand short option mechanics and assignment risk
- You have sufficient margin (typically 20-40% of notional)
- You can monitor position DAILY and adjust if needed
- You're prepared to roll or close at a loss if breached
- You've sold strangles before and understand gamma risk
Estimated P&L:
- Collect: $1.00 credit per strangle = $100 per position
- Profit scenario: AMDL expires $15.50-17.50 = keep full $100 (100% return on margin)
- Small loss scenario: AMDL at $14 or $19 = lose $50-100
- Disaster scenario: AMDL at $10 or $22 = lose $400-500+ per strangle
Position sizing: ONLY 1-2 contracts maximum, never more than 5% portfolio risk
Risk level: EXTREME (unlimited upside risk) | Skill level: Advanced/Expert only
Probability of profit: ~55-60% (within expected range), but losses can be outsized
Risk Factors
Critical risks specific to AMDL that amplify normal equity risks:
Leverage Decay is GUARANTEED Over Time:
- Daily reset mechanism: AMDL rebalances to 2x exposure EVERY SINGLE DAY at close
- Compounding math works against you: Volatility erodes value even if AMD ends flat over time
- Real example: AMD goes +5%, -4%, +3%, -2% over 4 days = +1.9% total. AMDL goes +10%, -8%, +6%, -4% = +3.2% (not 2x the 1.9% = should be 3.8%). The missing 0.6% is decay.
- Concrete evidence: AMDL since inception return of -28.52% annualized vs AMD's positive long-term returns
- Time is your enemy: Every day you hold, decay accumulates. This is NOT a long-term investment vehicle.
1.15% Expense Ratio Compounds:
- $1,150 annual fee per $100,000 invested
- Over 9 days until Dec 19 OPEX, that's ~$28.50 in fees eating into returns
- Combined with bid-ask spread costs and daily rebalancing friction, all-in costs could be 1.5-2% annually
- Compare to 0% cost to hold AMD stock directly
Derivative Counterparty Risk:
- AMDL uses total return swaps with major banks to achieve 2x exposure
- If counterparty (investment bank) defaults, ETF could face losses
- During 2008 financial crisis, several leveraged ETFs had severe tracking errors due to counterparty issues
- GraniteShares is smaller provider (less diversification than ProShares or Direxion)
AMD-Specific Risks Amplified 2x:
- Earnings miss in Feb 2026: 10% AMD drop = 20% AMDL drop (but actually worse due to gap and decay)
- MI350 launch delays: Credibility hit could send AMD down 15% = AMDL down 30%+
- China export restrictions: New curbs removing 15-20% revenue = AMD down 12% = AMDL down 24%
- Nvidia competitive dominance: If Blackwell significantly outperforms, AMD could drop 10-15% = AMDL down 20-30%
- Market share disappointment: AMD stuck at 5% share instead of growing = valuation compression
Structural ETF Risks:
- Forced selling on outflows: If investors redeem AMDL shares, fund must sell AMD futures/swaps, creating additional downward pressure
- Gap risk: AMDL can gap 10-20% overnight if AMD has after-hours news
- Liquidity in crisis: During March 2020 COVID crash, some leveraged ETFs had 5-10% bid-ask spreads
- Early termination risk: If AMDL AUM drops too low, GraniteShares could liquidate the fund
Options-Specific Risks for This Trade:
- Assignment risk: Short ITM calls (at $8, $13, $15 strikes) can be assigned early, especially before dividends (if any)
- Pin risk: AMDL could close exactly at $15 or $18 on Dec 19, creating uncertainty on whether options are ITM
- Gamma risk: Near expiration, small price moves create outsized changes in option deltas
- Regulatory risk: SEC could impose restrictions on leveraged ETFs (discussed previously, not currently active)
Macro Risks:
- Rate policy: Fed rate cuts boost tech/growth = AMD/AMDL rally; rate hikes = crash
- Recession: Economic downturn hits discretionary tech spending first
- Geopolitical: Taiwan tensions (TSMC manufacturing), China export controls, trade wars
- Tech sector rotation: If investors rotate from semiconductors to other sectors, AMD/AMDL get sold indiscriminately
Volatility Risk (Unique to Leveraged ETFs):
- VIX spike: During market crashes, volatility explosion accelerates decay
- Example: March 2020 COVID crash saw some 2x ETFs lose 60-70% in weeks even though underlying only fell 35%
- Rebalancing at worst prices: Daily reset forces buying high/selling low during volatile swings
The Bottom Line
Here's what really happened: A sophisticated trader executed a $5.2 million systematic call-selling campaign across three strikes in a tight 5-minute window. This was NOT random retail flow - this was institutional-scale positioning with clear intent.
Most likely interpretation (60% confidence):
This trader bought AMDL shares at $12-14 range weeks ago, sold covered calls at $8, $13, and $15 strikes to collect premium, and is now CLOSING the entire position to take profits after AMD's massive rally. The timing makes sense:
- AMDL up 177% YTD (spectacular gains locked in)
- 9 days until expiration (theta decay accelerating)
- Sitting at gamma resistance ($18) with limited upside before year-end
- Avoid holding through December volatility and leverage decay
The call selling pattern suggests:
- Deep ITM $8 calls: Bought when AMDL was $12-13, now worth $8.50+ intrinsic = massive profit
- ITM $13 calls: Sold as covered calls weeks ago, buying back before assignment
- Near-money $15 calls: Recently sold, now closing before rally continues
Alternative interpretation (30% confidence):
Trader is establishing NAKED short calls betting AMDL drops or consolidates into Dec 19 OPEX. This is risky but potentially profitable if:
- AMD trades sideways (leverage decay helps)
- AMDL stays below $15-18 range (gamma pinning)
- Year-end profit-taking pressures leveraged ETFs
- Time decay accelerates into expiration
What this trade tells us:
- Smart money is derisking: Whether closing profitable longs or shorting, the message is clear - institutional player reducing bullish exposure
- Timing is strategic: 9 days before triple-witch OPEX, before year-end, after massive rally
- Strike selection is telling: $15 aligns with gamma support and lower end of implied range ($15.09)
- Size matters: $5.2M premium is HUGE for an ETF with $600-800M AUM - this is 0.6-0.9% of fund size
- Execution matters: Staggered across 5 minutes suggests VWAP algo, professional trading desk
For AMDL traders, key takeaways:
If you own AMDL:
- Consider taking profits after 177% YTD gain - you've already won spectacularly
- Do NOT hold long-term - decay will destroy you (evidence: -28.52% annualized since inception)
- Set STOP at $17 (major gamma support) to protect remaining gains
- If holding through Dec 19, be prepared for 10-15% volatility
- Year-end is approaching - book gains, start fresh in January if still bullish AMD
If you're watching from sidelines:
- DO NOT chase AMDL at $17 after 177% rally - wait for pullback
- Better entry: $14-15 range (11-17% below current) after consolidation/correction
- Consider trading AMD directly instead of leveraged ETF to avoid decay
- If trading options, sell premium (credit spreads) rather than buy directional due to elevated IV
If you're bearish:
- Sell call credit spreads above $18 resistance (post-Dec 19 OPEX)
- Buy protective puts if hedging long AMD position (cheaper than AMDL puts)
- Watch for breakdown below $17 support as trigger for larger decline to $15-16
- Leverage decay works IN YOUR FAVOR if AMD consolidates
Critical dates to watch:
- December 10 (TODAY): Barclays Tech Conference - AMD CFO presenting
- December 12: Weekly options expiration (minor but could cause volatility)
- December 13: November CPI report (macro catalyst)
- December 19: TRIPLE WITCH OPEX - where these calls expire (MAJOR volatility expected)
- December 31: Year-end close (portfolio rebalancing flows)
- February 3, 2026: AMD Q4 earnings (THE BIG CATALYST)
- Mid-2025: MI350 launch (make-or-break for AMD's AI thesis)
Final verdict:
AMDL is a TRADING vehicle, not an investment. If you're in it, you should have an exit plan TODAY. The $5.2M call selling campaign signals institutional players are derisking after massive gains. That doesn't mean AMDL crashes tomorrow, but it does mean the easy money has been made.
Three possible paths through Dec 19:
- Bull case (30%): AMD rallies 5-8% on positive news, AMDL hits $19-20, call sellers lose money but limited due to premium collected
- Base case (50%): AMDL consolidates $15.50-17.50, pinned by gamma, call sellers profit from theta decay
- Bear case (20%): AMD drops 7-10%, AMDL falls to $13-15, call sellers profit massively
The smart play? Be like the $5.2M trader - take your gains, manage risk, live to trade another day. AMDL has served its purpose (177% YTD!). Don't overstay your welcome in a product designed to decay over time.
If you missed the rally, don't FOMO chase at all-time highs. Wait for the next opportunity. In leveraged ETFs, patience is NOT optional - it's mandatory.
Disclaimer: Options trading involves substantial risk of loss and is not suitable for all investors. This analysis is for educational purposes only and not financial advice. AMDL is a leveraged ETF with daily reset mechanism that causes significant tracking error and value decay over time - it is NOT suitable for buy-and-hold investing and should only be used by experienced traders for short-term tactical positions. Past performance does not guarantee future results. The seller of these calls may have complex portfolio hedging needs not applicable to retail traders. Leveraged ETFs can lose substantial value rapidly, including potentially 50-100% in extreme market conditions. Always do your own research and consider consulting a licensed financial advisor. The Z-scores and "EXTREMELY_UNUSUAL" classifications reflect statistical outliers but do not imply the trade will be profitable. Early assignment, gap risk, and leverage decay create unique risks for AMDL option traders.
About GraniteShares 2x Long AMD Daily ETF (AMDL): AMDL is a leveraged exchange-traded fund that seeks daily investment results, before fees and expenses, of 200% of the daily performance of Advanced Micro Devices, Inc. common stock. The fund uses derivatives (primarily swaps) to achieve its objective and resets daily. It is designed for tactical trading and short-term speculation, NOT long-term investing. Net assets of ~$605-789M with expense ratio of 1.15%. Launched March 4, 2024 by GraniteShares.