🚀 APP Short Straddle Eruption - $12.8M Institutional Bet on Volatility Collapse!
📅 September 30, 2025 | 🔥 Unusual Activity Detected
🎯 The Quick Take
Someone just dropped a $12.8M short straddle on AppLovin right at the $580 strike for November 21st expiration! This massive institutional play is collecting $11M in call premium and $1.8M in put premium, betting APP stays pinned around $580 (18% below current $708 levels) through the critical November 5th earnings. With the AXON Ads Manager launching tomorrow (October 1st), this is positioning for post-catalyst volatility crush. Translation: Big money thinks APP's explosive 108% YTD run is hitting exhaustion!
📊 Company Overview
AppLovin Corporation (APP) is a pure-play AI-powered advertising technology platform with:
- Market Cap: $241 Billion
- Industry: Computer Programming, Data Processing & Related Services
- Primary Business: AI-powered mobile advertising platform (AXON engine)
- Recent Transformation: Divested gaming business in June 2025 to focus on high-margin ad-tech
💰 The Option Flow Breakdown
📊 The Tape (September 30, 2025 @ 12:02:21)
| Time | Symbol | Buy/Sell | Type | Expiration | Premium | Strike | Volume | OI | Size | Spot | Option Price | Option Symbol |
|---|---|---|---|---|---|---|---|---|---|---|---|---|
| 12:02:21 | APP | SELL | PUT | 2025-11-21 | $1.8M | $580 | 701 | 864 | 700 | $708.03 | $26 | APP20251121P580 |
| 12:02:21 | APP | SELL | CALL | 2025-11-21 | $11M | $580 | 700 | 721 | 700 | $708.03 | $156 | APP20251121C580 |
Net Credit: $182 per contract = $12.74M total collected ($156 + $26 = $182 × 700 contracts)
🤓 What This Actually Means
This is a short straddle - the most aggressive way to bet on volatility collapse! The trader:
- Collects massive premium ($12.8M) by selling both calls AND puts at $580
- Maximum profit if APP lands exactly at $580 by November 21st expiration
- Profits anywhere between $398 and $762 (breakeven points)
- Unlimited risk if APP explodes higher OR crashes lower
- Betting on IV crush after AXON launch and before earnings
Unusual Score: EXTREME (2,302x average size) - This happens maybe once a year! 🔥
📈 Technical Setup / Chart Analysis
YTD Performance Chart
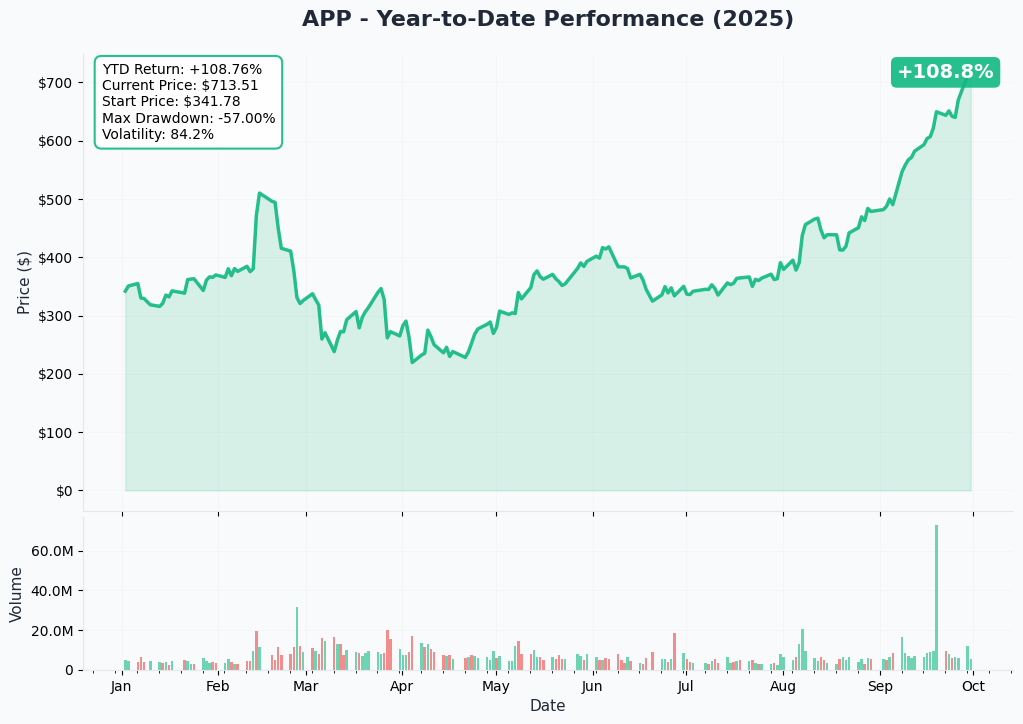
AppLovin's having an absolutely spectacular year with +108.8% YTD performance! The chart tells a story of transformation - after dipping to $240 in March, APP has been on an absolute tear, particularly accelerating in September from $450 to current levels around $713.
Key observations:
- Parabolic move: Nearly vertical rise in September alone
- High volatility: 84.2% implied volatility signals massive moves expected
- 52-week range: $341.78 start to $713.51 current (doubled!)
- Volume surge: Massive institutional interest in recent weeks
- Max drawdown: -57% earlier this year before recovery
Gamma-Based Support & Resistance Analysis
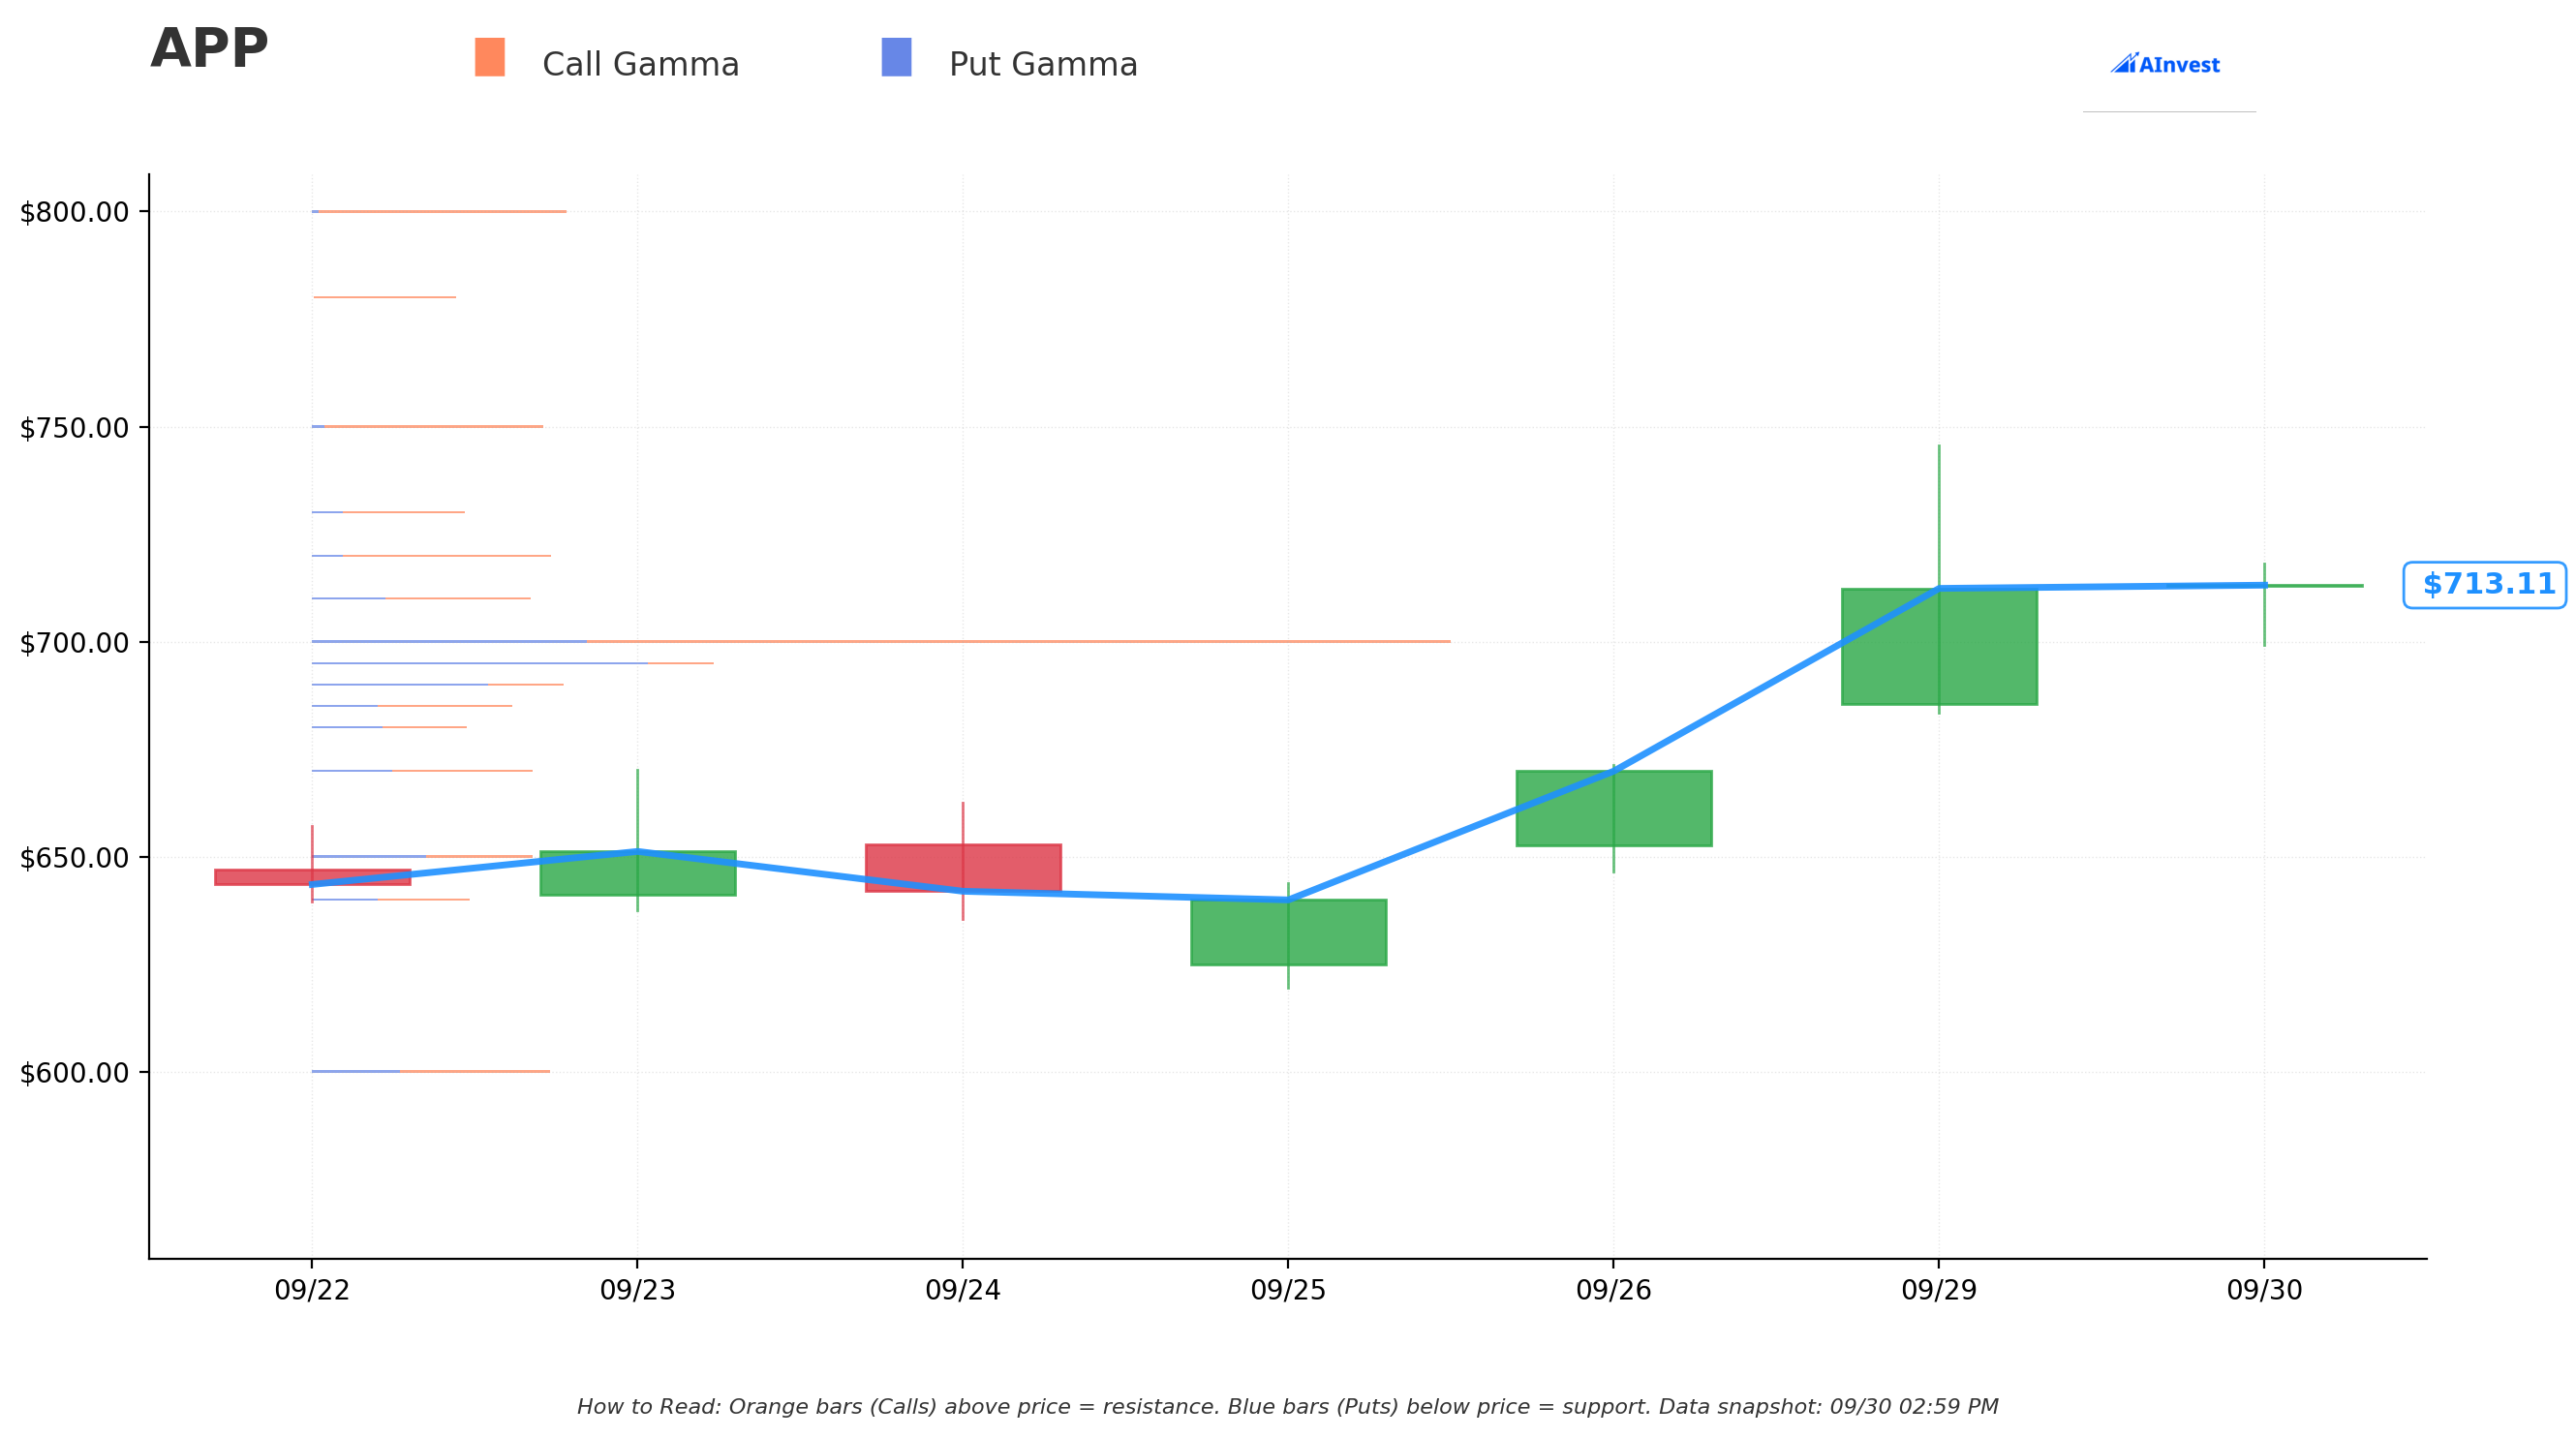
Current Price: $713.11
The gamma chart reveals critical levels that explain this massive straddle:
- Call Gamma Resistance: Heavy walls at $720, $750, and massive barrier at $800
- Put Gamma Support: Strong floors at $710 (immediate), $700, $670, and major support at $650
- Current Position: Trading at $713 right at first resistance with heavy gamma above
- Market Maker Impact: Huge put gamma at $580 (the straddle strike!) creates a gravity well
- Net GEX Bias: Bullish overall but resistance building rapidly above $720
The $580 strike selection is brilliant - it's where market makers will work to pin the stock due to massive gamma exposure!
🎪 Catalysts
Upcoming Events
AXON Ads Manager Launch - October 1, 2025 (TOMORROW!)
- Self-serve platform opens to non-gaming advertisers on referral basis
- International expansion to Japan, Korea, and other markets
- Morgan Stanley raised PT to $750 specifically for this catalyst
- Platform rebrand from "AppLovin" to "Axon" for advertising
Q3 2025 Earnings - November 5, 2025
- Consensus EPS estimate: $2.48
- Revenue guidance: $1.32-1.34 billion
- Adjusted EBITDA target: $1.07-1.09 billion (81% margin)
- First earnings as pure-play ad-tech after gaming divestiture
Non-Gaming Revenue Ramp - Q4 2025 & Beyond
- BTIG projects $531M in Q4 non-gaming revenue
- 2026 forecast: $2.58 billion non-gaming revenue
- E-commerce vertical expansion gaining traction
Recently Completed
Gaming Business Divestiture - June 2025
- Sold to Tripledot Studios for $400M cash plus equity
- Transformed into pure-play ad-tech company
- Eliminated lower-margin gaming operations
S&P 500 Inclusion - September 22, 2025
- Added to S&P 500 index driving institutional flows
- Enhanced liquidity and trading volume
- Broader investor awareness achieved
🎲 Price Targets & Probabilities
Using the gamma levels and straddle positioning:
🚀 Bull Case (20% chance)
Target: $750-$800
- AXON launch exceeds all expectations tomorrow
- Non-gaming revenue explodes higher than estimates
- Breaks above gamma resistance at $720 and runs to $750+
- Q3 earnings massive beat on November 5th
Risk to straddle: Unlimited losses above $762
😐 Base Case (60% chance)
Target: $600-$700 range
- AXON launch meets expectations, sells the news
- Stock consolidates after 108% YTD run
- Trades between gamma support at $650-670 and resistance at $720
- IV crushes from 84% to 50-60% post-catalyst
Straddle profits in this entire range
😰 Bear Case (20% chance)
Target: $500-$580
- AXON launch disappoints or has technical issues
- Profit-taking after parabolic September rally
- Tests major gamma support at $580 (straddle strike!)
- Valuation concerns at 101x P/E trigger correction
Straddle achieves maximum profit at $580
💡 Trading Ideas
🛡️ Conservative: Iron Condor Around the Straddle
Play: Sell $550/$600 put spread, $700/$750 call spread (Nov 21st)
- Sell $600 puts, buy $550 puts
- Sell $700 calls, buy $750 calls
Risk: $50 per spread max loss Reward: $15-20 credit per spread
Why this works: Ride the gamma walls with protection, benefit from IV crush
⚖️ Balanced: Calendar Spread at $650
Play: Sell Oct 18th $650 calls, buy Dec 20th $650 calls
Risk: Premium paid for long call minus credit from short Reward: Profits from IV crush and time decay
Why this works: AXON launch volatility collapses but longer-term uptrend intact
🚀 Aggressive: Fade the Straddle with Directional Bet
Play: Buy $620 calls (Nov 21st) if bullish on AXON
Risk: Premium paid (~$100 per contract) Reward: Unlimited upside if AXON success drives breakout
Why this works: If straddle seller is wrong about volatility collapse, explosive move possible
⚠️ Risk Factors
- Tomorrow's catalyst: October 1st AXON launch could gap stock either direction
- Extreme valuation: Trading at 101x P/E, 60x forward P/E - priced for perfection
- Parabolic exhaustion: Up 58% in September alone - due for consolidation
- Earnings volatility: November 5th earnings inside the straddle window
- Competition risk: Unity's Vector initiative could challenge dominance
- Execution risk: Non-gaming expansion unproven at scale
🎯 The Bottom Line
Real talk: This $12.8M straddle tells us institutional money is betting on AppLovin finding equilibrium around $580 after tomorrow's AXON launch. That's 18% below current levels! The gamma data shows massive resistance at $720 and the stock's already up 108% YTD.
If you own APP: Consider taking profits above $700 - smart money is positioning for a pullback
If you're watching: Tomorrow's AXON launch (October 1st) is THE catalyst - expect fireworks either direction
If you're bullish long-term: Wait for post-launch consolidation or use the pullback to $600-650 as entry
Mark your calendar:
- Tomorrow (October 1st) - AXON Ads Manager launches
- November 5th - Q3 earnings will validate or destroy the expansion thesis
The fact that someone's willing to risk unlimited losses to collect $12.8M in premium tells you they're VERY confident about where APP is heading. With the stock up 108% YTD and major catalysts hitting, this looks like smart money betting on "sell the news" after tomorrow's launch!
Disclaimer: Options trading involves substantial risk. This analysis is for educational purposes only and not financial advice. Past performance doesn't guarantee future results.
About AppLovin: AppLovin is a vertically integrated advertising technology company that acts as a demand-side platform for advertisers, a supply-side platform for publishers, and an exchange facilitating transactions, with a $241 billion market cap in the computer programming & data processing sector.