🐉 ASHR Massive $6.3M in LEAP Call Selling - Institution Caps China Upside! 🎯
📅 December 2, 2025 | 🔥 Unusual Activity Detected
🎯 The Quick Take
Someone just unloaded $6.3 MILLION in ultra-long-dated ASHR call options this morning at 10:25:28! This sophisticated trader sold 30,000 contracts total across two strikes ($36 and $45) expiring January 2028 - betting that China's ETF won't break above $36-45 over the next 26 months. With ASHR trading at $32.59 after a strong +22.14% YTD run on stimulus hopes, smart money is systematically capping upside and collecting massive premium. Translation: Institutions are getting paid to bet China's rally has peaked!
📊 Fund Overview
ASHR - Xtrackers Harvest CSI 300 China A-Shares ETF provides direct exposure to mainland China's largest companies:
- Fund Type: Exchange-Traded Fund tracking CSI 300 Index
- Net Assets: $2.32 Billion
- Expense Ratio: 0.65%
- Current Price: $32.59 (near 52-week high of $33.99)
- Primary Holdings: 290 companies including Kweichow Moutai (3.88%), CATL (3.47%), Ping An Insurance (2.57%)
- Top Sectors: Financial Services (22.44%), Technology (22.07%), Industrials (16.67%)
- YTD Performance: +22.14% driven by September stimulus and US-China trade truce
- Fund Flows: -$559.72M outflows in past month despite YTD gains (major warning sign!)
💰 The Option Flow Breakdown
The Tape (December 2, 2025 @ 10:25:28):
| Time | Symbol | Side | Buy/Sell | Type | Expiration | Premium | Strike | Volume | OI | Size | Spot | Option Price | Option Symbol |
|---|---|---|---|---|---|---|---|---|---|---|---|---|---|
| 10:25:28 | ASHR | BID | SELL | CALL $36 | 2028-01-21 | $4.6M | $36 | 15K | 0 | 15,000 | $32.59 | $3.05 | ASHR 36C 1/21/28 |
| 10:25:28 | ASHR | BID | SELL | CALL $45 | 2028-01-21 | $1.7M | $45 | 15K | 14 | 15,000 | $32.59 | $1.15 | ASHR 45C 1/21/28 |
🤓 What This Actually Means
This is a classic covered call or synthetic short play on China! Here's the breakdown:
- 💸 Total premium collected: $6.3M ($4.6M + $1.7M)
- 🎯 Short strikes: $36 (10.4% above current) and $45 (38.1% above current)
- ⏰ Time horizon: 781 days to January 2028 expiration - locking in bet for over 2 years!
- 📊 Massive size: 30,000 contracts total represents 3 million shares worth ~$98M
- 💰 Income strategy: Collecting $3.05 per share on $36 calls (8.5% yield) and $1.15 per share on $45 calls (3.0% yield)
What's really happening here:
This trader is either: (1) Holding a massive ASHR position and selling covered calls to generate income while capping upside at $36-45, OR (2) Running a synthetic short position betting China doesn't rally beyond these levels through January 2028.
The strategy is clear: pocket $6.3M in immediate premium, betting that ASHR never trades above $36-45 over the next 26 months. If correct, they keep the entire premium. If ASHR explodes past $45, they're obligated to deliver shares at those strikes (losing all upside beyond).
Key insight: The simultaneous sale of both strikes at identical timestamps suggests this is ONE sophisticated institution executing a two-legged income strategy. They're essentially saying: "China might go to $36, but NO WAY it gets to $45 by January 2028."
Unusual Score: 🔥🔥 EXTREMELY UNUSUAL
- $36 strike: Z-score N/A (no historical comparison due to zero open interest - this IS the first major trade!)
- $45 strike: Z-score 2,583.05 = "EXTREMELY_UNUSUAL" classification with 1,071x volume-to-OI ratio
This happens maybe a few times a year for ASHR. The $45 strike having only 14 contracts of existing open interest before this 15,000-contract dump is absolutely wild. Someone just became 99.9% of the open interest at that strike!
📈 Technical Setup / Chart Check-Up
YTD Performance Chart
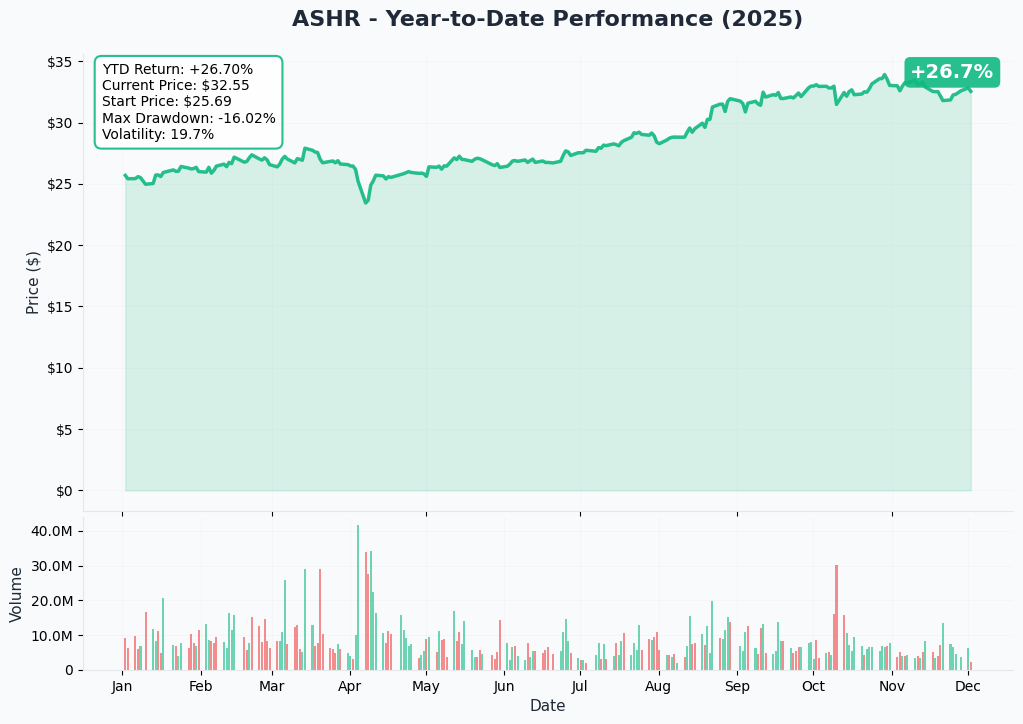
ASHR has delivered solid gains with +22.14% YTD returns riding China's stimulus wave and US-China trade détente. The chart shows a powerful September breakout from $26.50 to a 52-week high of $33.99 in October - a stunning 28% surge in 6 weeks driven by PBOC's "moderately loose monetary policy" shift and Trump-Xi trade deal cutting tariffs to 10%.
Key observations:
- 🚀 Stimulus-driven rally: Vertical move from $26.50 (late August) to $33.99 (mid-October) on massive volume
- 📉 November pullback: Currently $32.59, down 4% from October highs amid manufacturing PMI contraction and fund outflows
- 📊 Fund flow warning: -$559.72M outflows in past month despite YTD gains signals institutional profit-taking
- 🎢 Consolidation pattern: Trading in $31-34 range for past 6 weeks after explosive rally
- ⚠️ Resistance cluster: Failed multiple breakout attempts above $34 - natural ceiling forming
The chart screams "rally exhaustion" - institutions pumped it from $26 to $34, now they're locking in gains and selling calls against remaining positions. Classic topping behavior.
Gamma-Based Support & Resistance Analysis
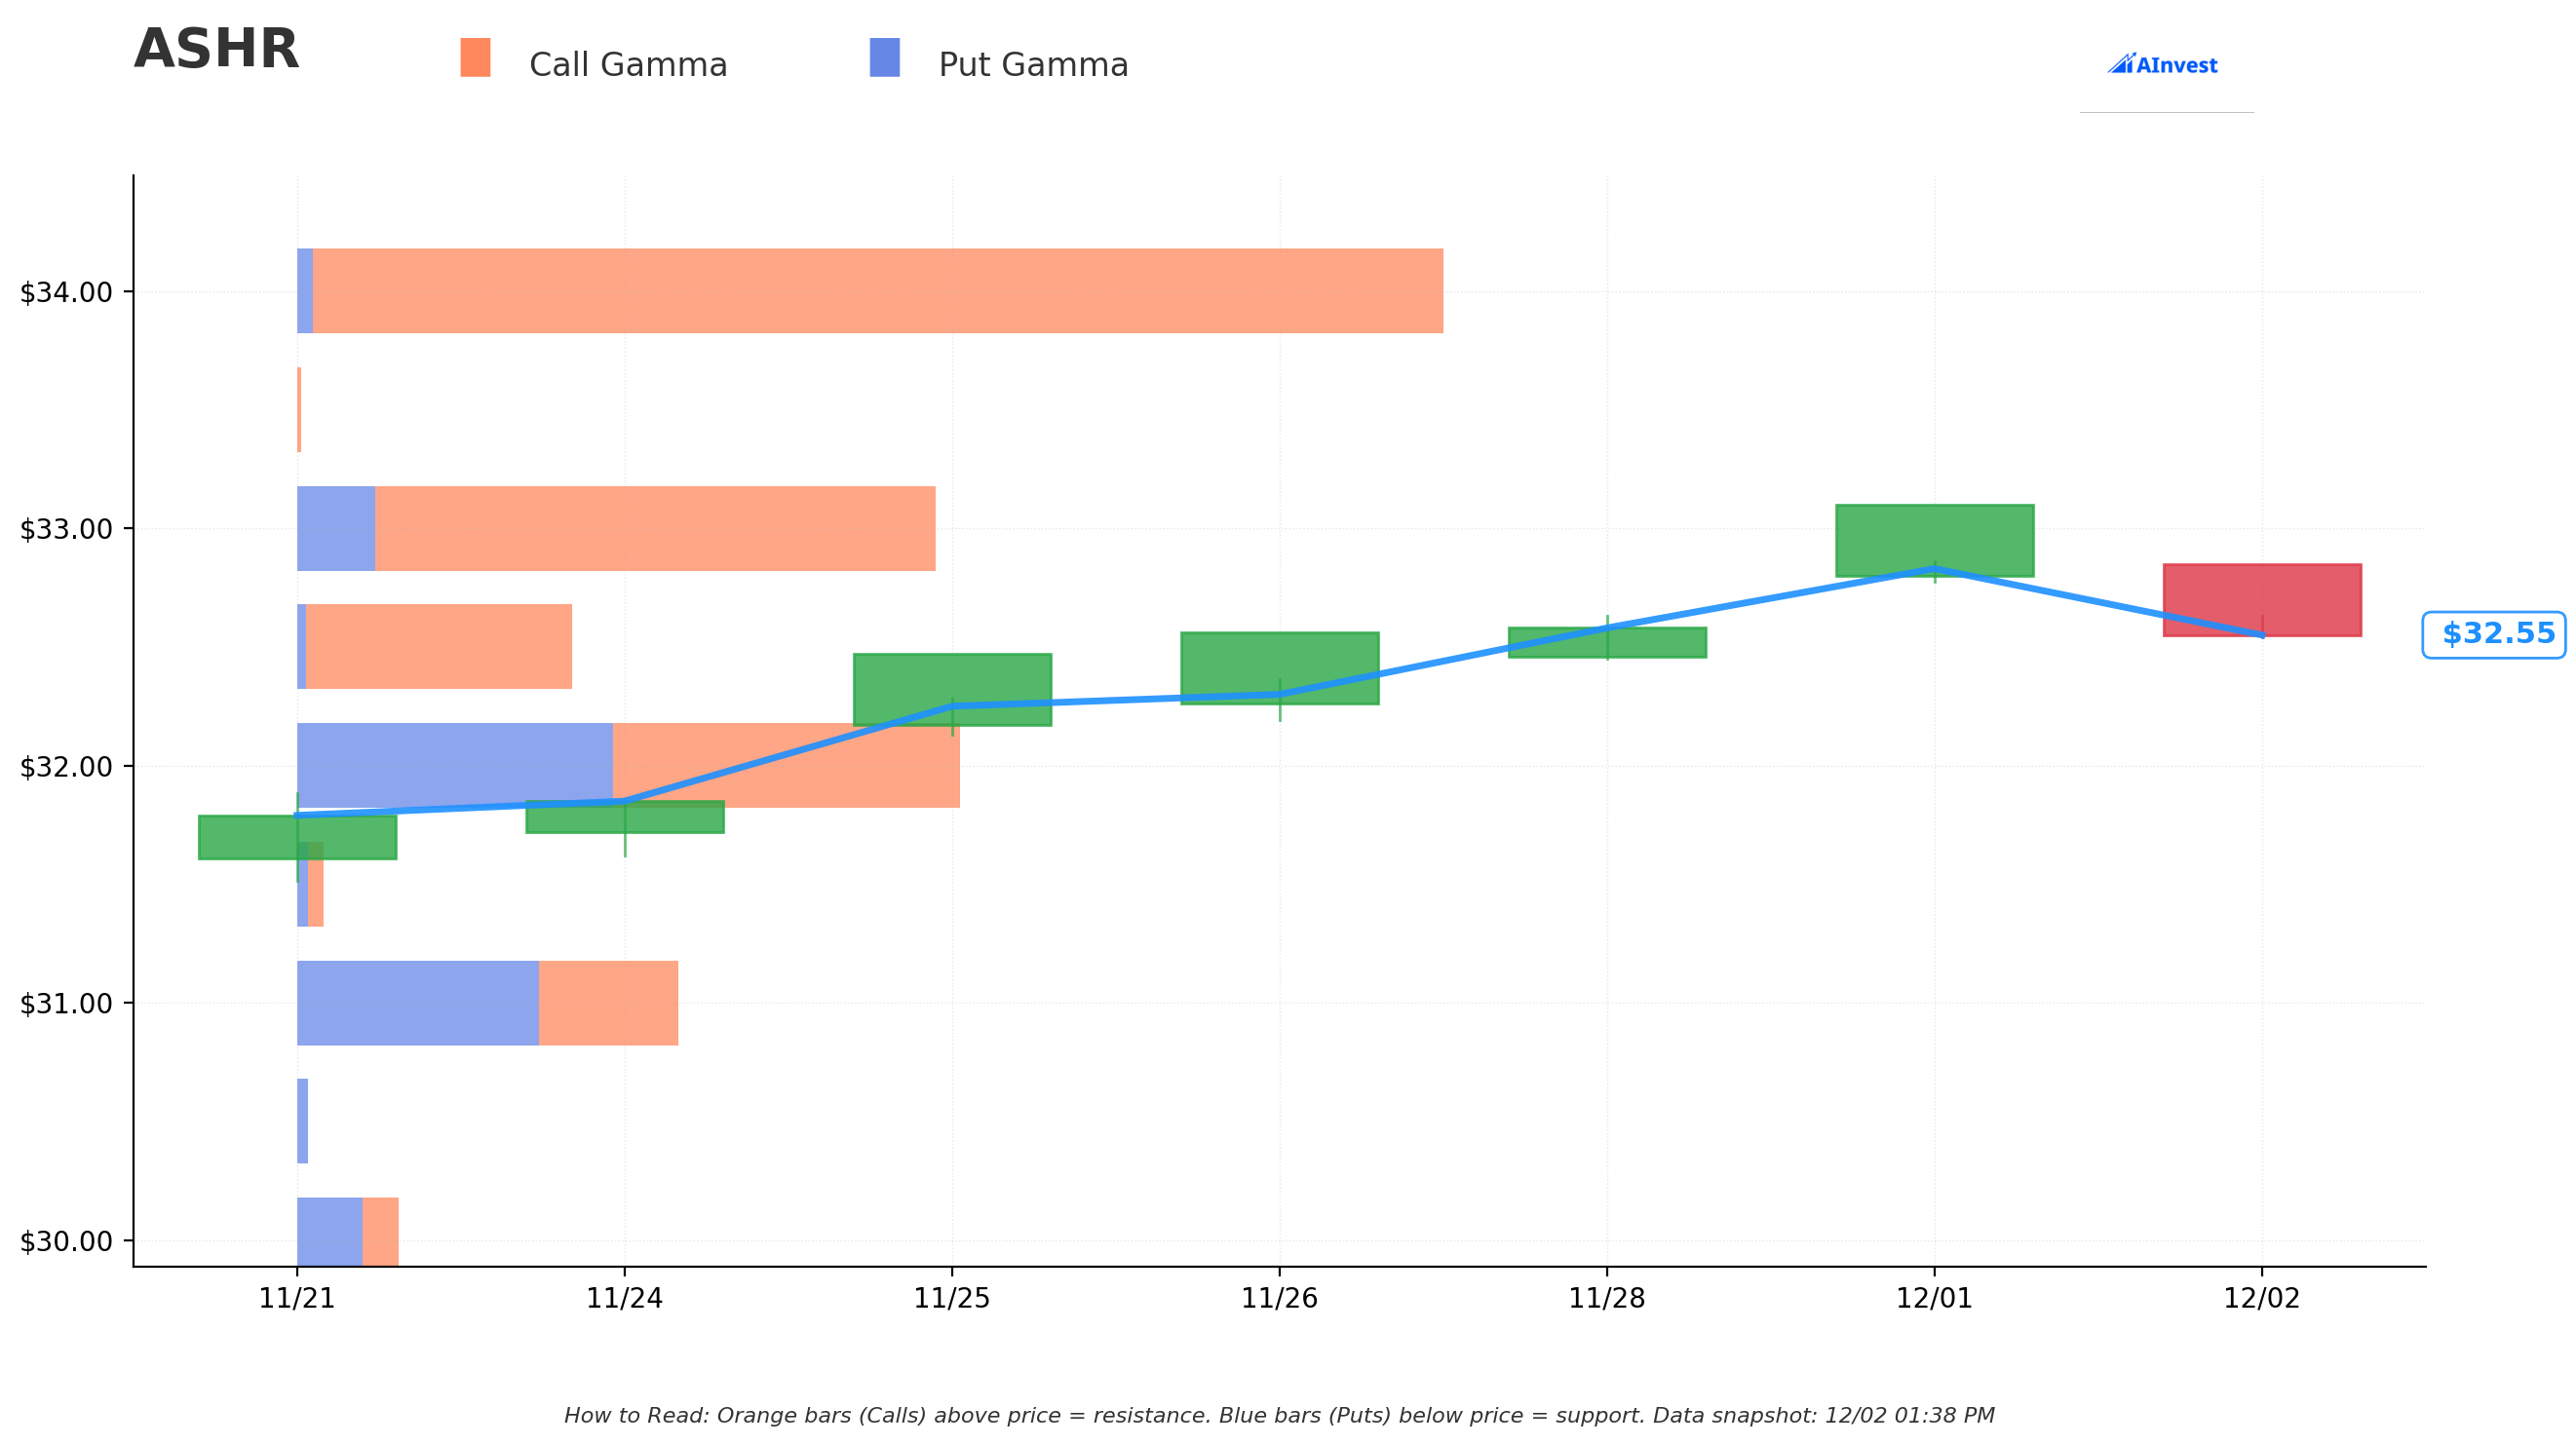
Current Price: $32.56
The gamma exposure landscape reveals critical price zones that will govern near-term action:
🔵 Support Levels (Put Gamma Below Price):
- $32.50 - Immediate support with 22.8B total gamma (21.3B net call gamma - dealers want price here!)
- $32.00 - Secondary floor with 54.9B gamma (strongest nearby support zone)
- $31.00 - Major structural support at 31.5B gamma
- $30.00 - Deep support level with 8.4B gamma
- $29.00 - Extended floor at 5.0B gamma
🟠 Resistance Levels (Call Gamma Above Price):
- $33.00 - Immediate ceiling with 52.8B gamma (40B net call gamma - STRONGEST RESISTANCE!)
- $34.00 - Major resistance at 94.9B gamma (92.3B net call gamma - MASSIVE WALL!)
- $35.00 - Secondary ceiling with 45.3B gamma
- $36.00 - Extended resistance at 32.8B gamma (EXACTLY where first call strike sits!)
- $38.00 - Upper ceiling with 4.9B gamma
What this means for traders:
ASHR is trapped in a tight range between $32.50 support and crushing $33-34 resistance. The gamma data shows absolutely MASSIVE call gamma at $34 (94.9B - the single largest level on the entire chain) creating natural selling pressure as price approaches. This is a concrete ceiling that will be extremely difficult to break.
Notice the pattern? The call seller struck at $36 (32.8B gamma) and $45 - both well above the major $34 resistance wall. They're betting that if ASHR can't even break $34 cleanly, it has zero chance of reaching $36-45 over 26 months. Smart positioning based on gamma structure.
Net GEX Bias: Bullish (295.3B call gamma vs 70.9B put gamma) - Overall dealer positioning remains bullish due to heavy call overwriting, but immediate price action constrained by overhead gamma resistance creating mechanical selling into rallies.
Implied Move Analysis
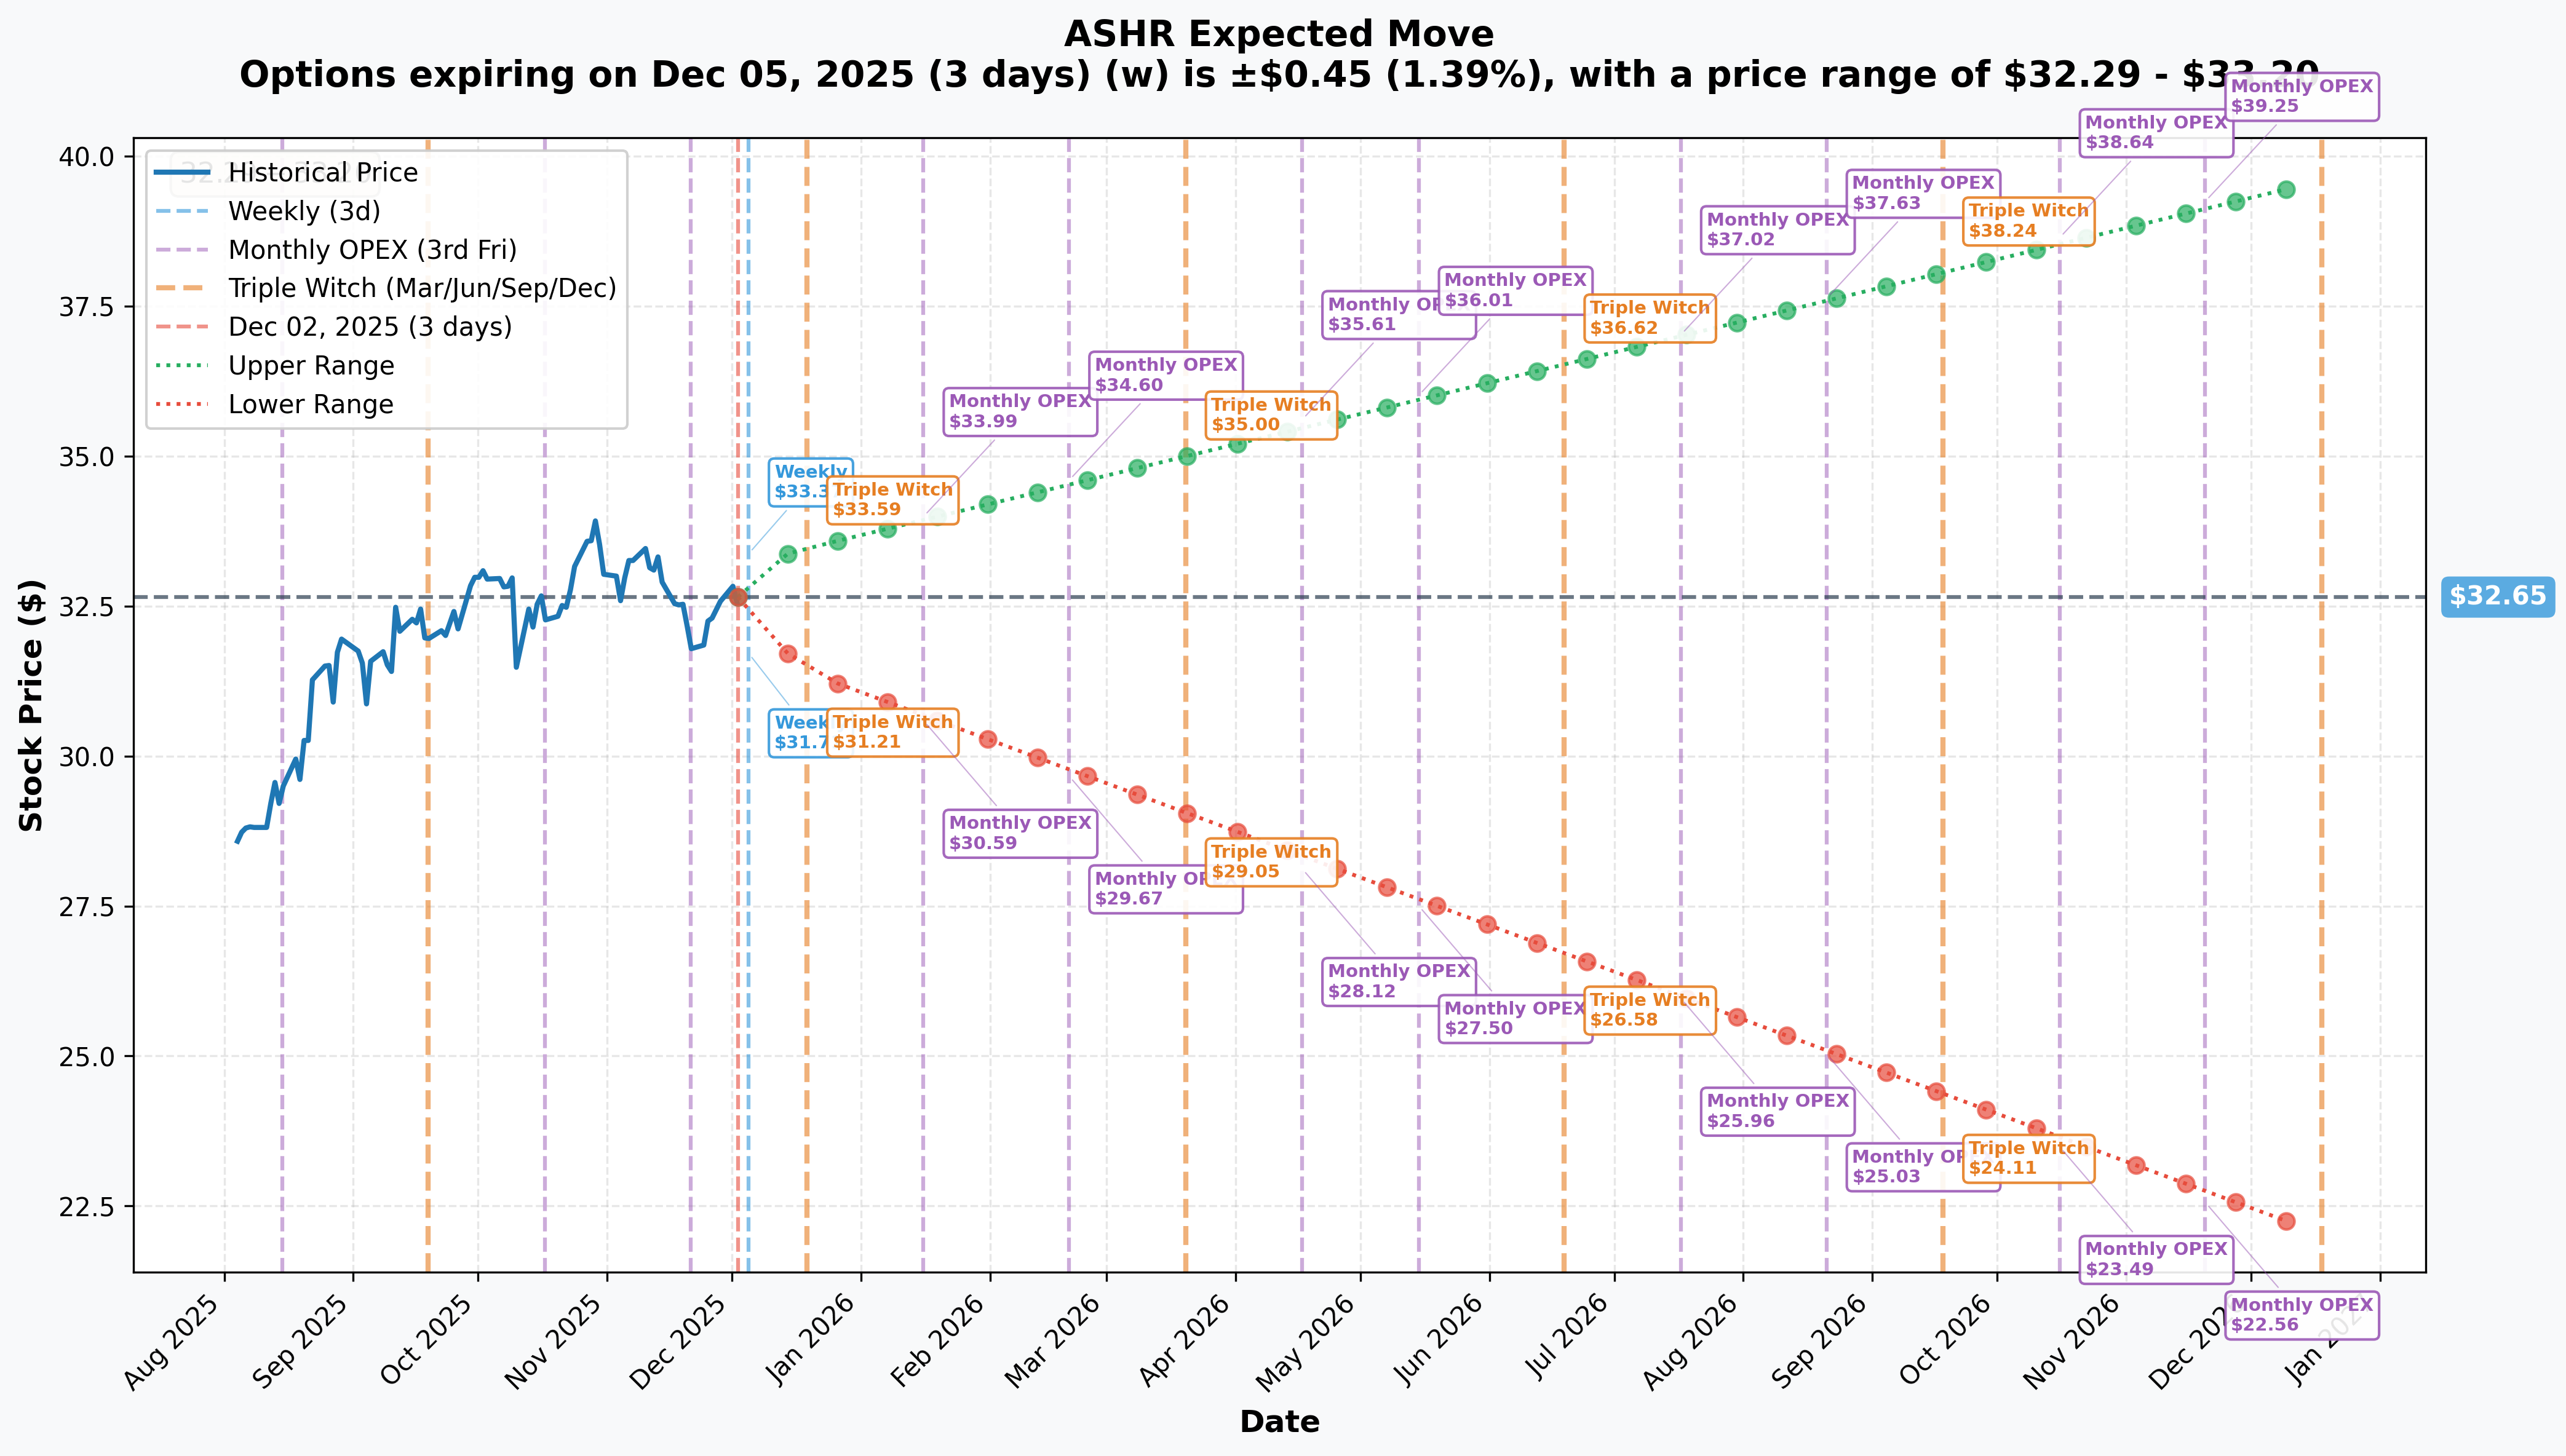
Options market pricing for upcoming expirations:
- 📅 Weekly (Dec 5 - 3 days): ±$0.45 (±1.39%) → Range: $32.29 - $33.20
- 📅 Monthly OPEX (Dec 19 - 17 days): ±$0.97 (±2.97%) → Range: $31.39 - $33.47
- 📅 Quarterly Triple Witch (Dec 19 - 17 days): ±$0.97 (±2.97%) → Range: $31.39 - $33.47
- 📅 January OPEX (Jan 16 - 45 days): ±$1.70 (±5.21%) → Range: $30.59 - $33.99
- 📅 Yearly LEAPS (Dec 18, 2026 - 381 days): ±$8.18 (±25.06%) → Range: $22.02 - $39.60
Translation for regular folks:
Options traders are pricing in relatively calm near-term action with only 1.4% weekly move and 3% monthly move - this is LOW volatility for a China ETF! The market expects ASHR to stay glued in the $31-34 range through year-end, which perfectly aligns with the gamma resistance analysis above.
For the long-dated view, the yearly LEAPS suggest a 25% potential range ($22-40), but notice the upper bound of $39.60 is still BELOW the $45 strike where the call seller positioned. Even the most aggressive 1-year options pricing doesn't see ASHR reaching $45, validating the short call thesis.
Key insight: The sharp drop in implied volatility (only 3% monthly move vs historical China ETF vol of 15-20%) suggests the market believes the September stimulus rally is DONE. No major fireworks expected - perfect environment for selling premium.
🎪 Catalysts
🔥 Past Catalysts (Already Happened - Rally Drivers)
September 2025 Stimulus Package - The Rally Catalyst 💰
The primary driver of ASHR's +22.14% YTD performance came from China's aggressive monetary policy shift announced in September 2025:
- 💵 PBOC Rate Cuts: Seven-day repo rate cut by 10bps to 1.4%, policy rate down 0.1%, RRR cut by 50bps
- 💰 Liquidity Injection: Released ~RMB 1 trillion in long-term liquidity
- 🏠 Housing Support: Provident fund loan rates lowered 0.25%, mortgage rates to ~3.1%
- 📊 "Moderately Loose" Policy: First use of this terminology since 2010 signals major policy pivot
Market Impact: ASHR surged 28% in 6 weeks (late Aug to mid-Oct) on this stimulus wave. However, the rally has since stalled as PBOC held rates unchanged for 6 consecutive months through November, leading Goldman Sachs to retract calls for further easing.
US-China Trade Truce - October 2025 🤝
The Trump-Xi "Kuala Lumpur Joint Arrangement" signed October 30, 2025 dramatically eased trade tensions:
- 🎯 Tariff Cuts: Reciprocal tariffs lowered to 10% (down from peak 145% in May 2025)
- ⏰ Truce Duration: Extended through November 10, 2026 (11 months from now)
- 🌾 China Commitments: Purchase minimum 12 million tons US soybeans by year-end, 25 million tons annually 2026-2028
- ⚠️ Fentanyl: China suspended all retaliatory tariffs, strengthened precursor controls
Market Impact: This was the second leg of ASHR's rally - removed worst-case trade war scenario that had tariffs averaging $1,200 per US household. However, notice the call seller positioned PAST the November 2026 expiration - they're betting even if trade peace holds, it won't drive ASHR above $36-45.
Q3 2025 GDP Data - Mixed Results 📊
China reported Q3 GDP growth of 4.80% YoY in October 2025:
- ✅ Target On Track: Q1-Q3 GDP of 5.2% keeps "around 5%" annual target achievable
- 💪 Manufacturing: Growth at 6.3% YoY (strongest sector)
- 📉 Construction: Contracted -2.3% (biggest drag on economy)
- 😰 Deflation Persists: 10th consecutive quarter of economy-wide price declines
- 💔 Retail Sales: Expanded only 3% in September (worst monthly result since Nov 2024)
Market Impact: Mixed data failed to extend the rally - growth "good enough" to hit target but too weak to justify further upside. Persistent deflation and weak consumption killed momentum.
DeepSeek AI Rally - January 2025 🤖
The launch of DeepSeek R1 on January 20, 2025 catalyzed significant tech sector re-rating:
- 🚀 MSCI China Top 10 Tech Innovators: +28% through May 2025
- 📊 MSCI China Overall: +19%
- ⚖️ Non-AI MSCI China: Only +4%
- 🎯 CSI 300: Only +2%
Market Impact: Demonstrates selective investor appetite for AI-related Chinese stocks rather than broad-based optimism. Since ASHR tracks CSI 300 (only +2% on this catalyst vs AI stocks +28%), it underperformed the AI theme significantly. This divergence likely reinforces the call seller's thesis - ASHR won't benefit from AI hype like pure-play tech names.
🚀 Upcoming Catalysts (Next 6-26 Months)
Central Economic Work Conference - Mid-December 2025 (IMMINENT!) 📋
China's annual policy-setting meeting expected in next 2 weeks will outline 2026 economic priorities:
- 🎯 2026 GDP Target: Likely "around 5%" again (2025 target source)
- 💰 Fiscal Deficit: 2025 was record 4% of GDP - will 2026 go higher?
- 🏗️ Stimulus Allocation: Economists anticipate up to RMB 10 trillion over 2-3 years
- 💵 Consumption Stimulus: Morgan Stanley expects RMB 700 billion in 2026
Bull case catalyst: Aggressive fiscal spending announcement (>RMB 10 trillion) could spark 5-10% rally to $34-36 range, testing the first short call strike.
Bear case catalyst: Disappointing stimulus (continued "stability over stimulus" approach) would confirm rally is over, drop to $30-31 support.
Probability assessment: The Northern Trust analysis "China Stimulus: Better Luck Next Year" suggests expectations should be LOW. If they're right, this catalyst is neutral-to-negative.
Property Market Stimulus Package - Q4 2025/Q1 2026 🏠
China weighing aggressive measures to address 4-year property slump:
- 🏡 Proposed Measures: Nationwide mortgage subsidies, increased tax rebates, reduced transaction costs, buy-back programs for idle land
- 💔 Context: Home prices down 42 consecutive months, RMB 3.5 trillion in bad loans
- 🏗️ CSI 300 Exposure: Property impacts financials (22.44%), materials (9.16%), and industrials (16.67%) - nearly 50% of index weight
- ⏰ Timeline: Under debate since Q3 2025, announcement likely before Q1 2026
Catalyst potential: MASSIVE if implemented - could stabilize construction sector (currently -2.3% YoY) and boost consumer confidence. Property resolution is THE key to unlocking Chinese consumption. Success could drive ASHR to $36-38 range.
Risk: Government has prioritized "stability over direct intervention" historically. Past attempts failed. If this round disappoints, confirms secular decline - bearish for ASHR.
Q4 2025 GDP Data Release - Late January 2026 📊
Based on Q1-Q3 performance of 5.2%, China on track to meet "around 5%" target. However, Q4 faces headwinds:
Bullish factors:
- 💻 Manufacturing high-tech PMI at 50.1 for 10 consecutive months
- 📈 Improved business outlook index (53.1 in November)
- Base effects from weak Q4 2024
Bearish factors:
- 📉 Manufacturing PMI in contraction for 8 months at 49.2
- 🚨 Non-manufacturing PMI first contraction since Dec 2022 at 49.5
- 😰 10 consecutive quarters of deflation
- 💔 Weak retail sales (3% in September)
Market impact: Meeting the 5% target = neutral (maintains status quo, ASHR stays $31-34). Missing target = bearish (pressure to $28-30). Beating target = unlikely but would test $35 resistance.
US-China Trade Relations - Tariff Truce Expiration (November 10, 2026) ⚠️
Current 10% tariff truce expires November 10, 2026 - 15 months from now and BEFORE the January 2028 call options expire!
Key monitoring points:
- 🌾 Implementation of China's 25 million ton soybean purchase commitments
- 💊 Fentanyl precursor export controls enforcement
- 🔋 Rare earth element export policy adherence
Scenarios:
- Bullish (20% probability): Further normalization, tariffs reduced below 10% → ASHR to $38-40
- Neutral (60% probability): Status quo extension → ASHR stays $30-35 range
- Bearish (20% probability): Breakdown, reversion toward 145% peak levels → ASHR to $22-26
Critical insight for the call trade: The options expire January 2028, meaning they cover the November 2026 tariff expiration. If negotiations break down, calls would benefit (ASHR drops), but if trade peace extends or improves, upside capped at $36-45 strikes. The call seller is betting the current 10% tariff level is THE CEILING for improvement.
PBOC Monetary Policy Decisions - Ongoing through H1 2026 💵
Current stance: November pause (6th consecutive month of unchanged LPR) suggests limited near-term easing appetite.
Next decision points:
- 📅 Monthly Loan Prime Rate announcements (next: Dec 20, 2025)
- 📊 Potential RRR cuts (9 rounds totaling ~RMB 7 trillion since 2021)
Market expectations: Goldman Sachs retracted calls for further cuts in 2025 given GDP on track for 5% target. May 2026 could see renewed easing if Q1 2026 growth disappoints.
Catalyst potential: Further rate cuts would support equity valuations but corporate/household credit demand remains weak due to confidence issues and "stimulus without rebalancing" approach. Diminishing returns evident - September cuts drove 28% rally, but subsequent holds saw 4% pullback.
Impact on call trade: More easing = short-term positive but undermines structural confidence in Chinese economy. Validates bear thesis that China needs constant stimulus to maintain growth. Supports capping upside at $36-45.
Foreign Investment Flow Trends - Ongoing Crisis 💸
Current trajectory: Net FDI plummeted from $334B inflows (2021) to -$154B outflows (2024) - largest capital outflow on record!
2025 performance:
- 📉 Utilized FDI down -12.7% YoY through August
- ✅ However, high-tech FDI reached RMB 127.87B in H1 2025
- 🚀 E-commerce services FDI +127.1%, chemical pharma +53%, aerospace +36.2%
Stock Connect flows:
- 💰 Southbound flows: $78B net buying YTD (75% of full 2024)
- 🎯 Predicted full-year southbound: $110B
ASHR specific flows: -$559.72M outflows in past month, -$1.95B over one year
Market impact: Institutional exodus from China continues despite rally. The call seller is likely part of this trend - selling calls to generate income while exiting exposure. Foreign investors remain "too controlled and opaque to fully trust" per CNBC analysis.
🎲 Price Targets & Probabilities
Using gamma levels, implied move data, and catalyst analysis, here are scenarios through January 2028 expiration (26 months):
📈 Bull Case (20% probability)
Target: $38-42 (Calls at $36 exercised, $45 survives)
How we get there:
- 💪 Property stimulus DELIVERS: Aggressive nationwide measures stabilize housing, boost construction sector from -2.3% to positive growth
- 🎯 GDP acceleration: 2026-2027 growth exceeds 5.5% on consumption rebound
- 🤝 US-China relations improve: Tariffs reduced below 10%, trade tensions ease further
- 💰 Massive fiscal stimulus: RMB 10+ trillion over 2-3 years actually deployed (not just announced)
- 📊 Foreign investment reverses: Net FDI turns positive, Stock Connect inflows accelerate
- 🇨🇳 Consumer confidence rebounds: Retail sales growth accelerates to 6-8% sustained
- 🌐 CSI 300 breakout: Index breaks through 5,000 level (current 4,527)
Key metrics needed:
- Property prices stabilize (end 42-month decline)
- Deflation ends (positive CPI for 2+ quarters)
- Manufacturing PMI back above 50 sustained
- Foreign reserves growing (capital inflows)
Probability assessment: Only 20% because it requires PERFECT execution on multiple structural challenges China has failed to solve for 4+ years. Property crisis, deflation, consumption weakness, foreign capital flight - these aren't cyclical issues fixed by more stimulus. The "stimulus without rebalancing" critique from Bruegel shows monetary easing without structural reforms has diminishing returns.
Call seller P&L in Bull Case:
- ASHR at $38: $36 calls exercised, lose $2/share × 15K = -$30M loss (but kept $4.6M premium = net -$25.4M loss)
- $45 calls expire worthless, keep $1.7M premium
- Total P&L: -$23.7M loss on $6.3M collected (bad outcome but manageable if hedged)
Critical resistance: $34 gamma wall (94.9B) must break first, then $36 level with 32.8B gamma. Historical precedent shows ASHR struggles above $34 - has failed multiple breakout attempts since October.
🎯 Base Case (60% probability)
Target: $28-36 range (Both calls expire worthless)
Most likely scenario:
- ✅ GDP targets met but not exceeded: 2026-2027 growth "around 5%" (same as 2025)
- 📱 Property measures implemented but underwhelm: Home price declines moderate to -5% annually but don't turn positive
- ⚖️ Trade truce extended at 10% tariff level: Status quo maintained through November 2026 and beyond
- 💰 Moderate stimulus: RMB 5-7 trillion over 2-3 years (less than RMB 10T bull case)
- 🇨🇳 Consumer confidence improves marginally: Retail sales 4-5% growth (better than 3% but not robust)
- 🔄 Fund flows stabilize but don't reverse: Outflows slow but don't turn to inflows
- 📊 ASHR consolidates: Trades in $28-36 range for 26 months, testing both boundaries but breaking neither
- 😴 Volatility stays low: Implied vol compresses further, no major catalysts materialize
This is the call seller's TARGET scenario:
ASHR meanders in $30-35 range for 2+ years, both call strikes expire worthless in January 2028, seller keeps entire $6.3M premium. This represents 20% ROI on the $32M notional exposure (assuming covered call strategy) over 26 months, or ~9% annualized. In a low-vol environment with China "muddle-through" growth, this is attractive income generation.
Why 60% probability:
China has demonstrated remarkable ability to maintain 5% growth through massive stimulus even as underlying economy deteriorates. J.P. Morgan notes China is "past the bottom in earnings downgrades" though recovery path bumpy. The government will do WHATEVER it takes to hit GDP targets, but structural reforms needed for breakout growth won't happen. Result: stable but uninspiring performance.
The gamma resistance at $33-34 (147.7B combined) creates mechanical ceiling. Implied move data shows market pricing only 25% range over 1 year ($22-40) - supports range-bound thesis.
Call seller P&L in Base Case:
- Both $36 calls and $45 calls expire worthless
- Total P&L: +$6.3M profit (100% of premium collected)
- ROI: ~20% over 26 months = 9% annualized
📉 Bear Case (20% probability)
Target: $22-28 (Calls worthless but stock position bleeds)
What could go wrong:
- 😰 Property crisis deepens: Major developer bankruptcies, bad loans exceed RMB 3.5T, financial system stress
- 🚨 GDP misses 5% target: Q4 2025 or 2026 growth disappoints, forces policy panic
- ⏰ US-China trade war reignites: November 2026 negotiations fail, tariffs spike back toward 145% peak levels
- 💸 Capital flight accelerates: Net FDI outflows worsen beyond -$154B, yuan devaluation pressure
- 🇨🇳 Consumption collapse: Retail sales growth drops below 2%, household savings surge further
- 📉 Deflation entrenches: 15+ consecutive quarters of price declines, debt deflation spiral
- 🌍 Global recession: Weak external demand hammers Chinese exports
- 🏗️ Local government debt crisis: Despite RMB 12T restructuring plan, defaults occur
- 🔨 ASHR breaks $30 support, cascades to $26-28 range, tests yearly lows
Critical support levels:
- 🛡️ $32.00: Major gamma floor (54.9B) - current battleground
- 🛡️ $31.00: Secondary support (31.5B gamma) - MUST HOLD
- 🛡️ $30.00: Psychological floor (8.4B gamma) - break triggers panic
- 🛡️ $28.00: Disaster scenario - back to pre-stimulus levels
- 🛡️ $22.02: Yearly LEAPS lower bound - crisis level
Probability assessment:
20% because China has proven willing to deploy unlimited stimulus to prevent crisis. However, structural headwinds are REAL: 10 consecutive quarters of deflation, 42-month property price decline, record net FDI outflows of -$154B, manufacturing PMI contracting for 8 months. The "muddle-through" approach works until it doesn't.
Call seller P&L in Bear Case:
- $36 calls and $45 calls expire worthless (keep $6.3M premium)
- But if running covered calls, underlying ASHR position bleeds:
- ASHR at $26: -$6.59/share × 3M shares = -$19.8M loss
- Net P&L: +$6.3M premium - $19.8M stock loss = -$13.5M total loss
- If synthetic short (no stock ownership), pure profit of +$6.3M even in bear case!
This explains the strategy: If running synthetic short or hedge against other China exposure, the call seller WINS in both base case (range-bound) and bear case (crash). Only loses if China breaks out above $36-45, which they clearly view as <20% probability.
💡 Trading Ideas
🛡️ Conservative: Fade the Rally - Sell into Strength
Play: If you own ASHR, sell 25-50% on any bounce toward $34, avoid new longs above $32
Why this works:
- 📊 Gamma resistance at $33-34 (147.7B combined) creates mechanical ceiling extremely difficult to break
- 💸 Fund outflows of -$559.72M in past month show institutions EXITING despite rally - follow the smart money
- 🚫 Manufacturing PMI contracting for 8 months, non-manufacturing first contraction since Dec 2022 - economy weakening
- 😰 10 consecutive quarters of deflation shows structural demand deficiency monetary stimulus can't fix
- 🎯 $6.3M institutional call sale signals smart money CAPPING upside at $36 - they know something
- ⏰ Central Economic Work Conference (mid-Dec) likely disappoints on stimulus based on "Better Luck Next Year" Northern Trust analysis
Action plan:
- 📈 Set sell limit orders at $33.50-33.99 to capture any spike toward resistance
- 🎯 Take profits on 25% position at $33, another 25% at $34 if hit
- 🛡️ Keep 50% core position only if you believe in multi-year China recovery story
- ⏰ Revisit Q1 2026 after property stimulus details clear and Q4 GDP data released
- 💰 Reinvest proceeds into US equities (SPY, QQQ) with cleaner growth trajectory
Risk level: Minimal (reducing exposure, locking gains) | Skill level: Beginner-friendly
Expected outcome: Avoid giving back YTD gains if China disappoints. Can always re-enter lower if wrong.
⚖️ Balanced: Copy the Institution - Sell Covered Calls
Play: If you own ASHR, sell covered calls at $35-36 strikes, 6-12 month expirations
Structure: Own 100+ shares ASHR, sell 1 covered call per 100 shares at $36 strike, June or Sept 2026 expiration
Why this works:
- 💰 Generate 6-10% annualized income on range-bound position (similar to institution's 9% target)
- 🎯 Cap upside at $36 (10.4% above current) where gamma resistance (32.8B) makes breakout unlikely
- 📊 Implied vol at low levels (3% monthly move) makes this IDEAL time to sell premium
- 🤝 Essentially "copying" the $6.3M institutional trade at smaller scale
- 🛡️ Reduces cost basis - if ASHR drops to $30, premium collected cushions loss
- ⏰ 6-12 month timeframe captures Central Economic Work Conference, Q4 GDP, property stimulus, trade developments
Estimated P&L (example on 1,000 shares):
- 💰 Sell 10 contracts of $36 June 2026 calls for ~$1.80-2.20 each = $1,800-2,200 income
- 📈 Max profit: ASHR at $36+ at expiration = keep premium + gains to $36 = $3,410 + $1,800 = $5,210 profit (16% ROI)
- 📉 Downside protection: Premium lowers cost basis from $32.59 to $30.79-30.39
- 🎯 Breakeven: $30.39-30.79 vs $32.59 without covered calls (7% cushion)
When to roll:
- 🔄 If ASHR approaches $35 before expiration, consider rolling up and out (sell $38 calls, extend expiration)
- ❌ If ASHR drops below $30, consider closing calls for profit and reassessing position
- ✅ If calls expire worthless, repeat strategy selling next 6-month cycle
Position sizing: Only use on existing ASHR holdings, don't buy new shares just to sell calls
Risk level: Moderate (capped upside, undefined downside on stock) | Skill level: Intermediate
Probability of profit: ~70% (keep premium if ASHR stays below $36, which is base case + bear case combined = 80%)
🚀 Aggressive: Short-Term Bear Put Spread (ADVANCED ONLY!)
Play: Buy put spread betting on near-term pullback to $30-31 support
Structure: Buy $32 puts, Sell $30 puts (January 16, 2026 expiration - 45 days)
Why this could work:
- 📉 Fund outflows accelerating (-$559.72M in 1 month) suggest institutional exodus continues
- 🚨 Central Economic Work Conference (mid-Dec) catalyst likely disappoints based on PBOC 6-month pause pattern
- 📊 ASHR at $32.59 sitting on gamma support - small break triggers cascade to $31-30 levels
- ⏰ Year-end profit-taking after +22% YTD gains
- 🇨🇳 Manufacturing and non-manufacturing PMI both contracting - negative surprise risk
- 💸 Implied move only 5.2% through Jan 16 - market complacent, underpricing downside risk
Why this could blow up (SERIOUS RISKS):
- 🛡️ Strong gamma support at $32.00 (54.9B) could hold - need sustained selling to break
- 💪 China announces surprise property stimulus - immediate 5-10% pop
- 📊 Gamma floor at $30 (8.4B) - if you're right, gains limited to $2 wide spread
- ⚠️ Low implied vol means put spreads relatively expensive on risk/reward basis
- ⏰ Only 45 days to expiration - need quick move or theta decay kills position
Estimated P&L:
- 💰 Cost: ~$0.60-0.80 net debit per spread (check actual pricing)
- 📈 Max profit: $1.20-1.40 if ASHR below $30 at January expiration (150-175% ROI)
- 📉 Max loss: $0.60-0.80 if ASHR above $32 (100% loss of premium)
- 🎯 Breakeven: ~$31.20-31.40
- 📊 Risk/Reward: ~2:1 (decent for defined-risk directional play)
Entry timing:
- ⏰ Enter on any bounce toward $33 (better entry point)
- ❌ Skip if ASHR already below $31.50 (spread too close to at-the-money)
- ✅ Best entry after Central Economic Work Conference if stimulus disappoints
Position sizing: Risk only 2-5% of portfolio max (this is directional speculation)
Exit strategy:
- 🎯 Take profits at 50-75% max gain (don't be greedy waiting for full $2)
- ⏰ Close position if ASHR rallies above $33.50 (thesis invalidated)
- 🚫 Don't hold to expiration if down >50% - cut losses early
Risk level: HIGH (can lose 100% of premium) | Skill level: Advanced only
Probability of profit: ~40% (need break below $31.40 in 45 days - possible but not likely in base case)
CRITICAL WARNING - DO NOT attempt unless you:
- ✅ Understand China macro risks and can monitor geopolitical developments
- ✅ Accept total loss of premium is real possibility
- ✅ Can handle volatility of overnight China policy announcements
- ✅ Have traded put spreads before and understand mechanics
- ⏰ Will close position early if thesis invalidated (don't marry the trade)
⚠️ Risk Factors
Don't get caught by these potential landmines:
-
🏠 Property crisis wildcard - THE structural issue: China's 4-year property slump with 42 consecutive months of price declines and record RMB 3.5 trillion in bad loans creates existential risk. Property-related sectors (financials, materials, industrials) represent ~50% of CSI 300 weight. If aggressive stimulus under consideration FAILS again, entire Chinese equity thesis collapses. Government has tried multiple approaches over 4 years - none worked. Construction sector already contracting -2.3% YoY despite "easy" monetary conditions.
-
😰 Deflation death spiral - 10 quarters and counting: Economy-wide price declines for 10 consecutive quarters reflect structural demand deficiency that stimulus can't solve. Deflation creates vicious cycle: consumers delay purchases expecting lower prices → companies cut production → layoffs → weaker demand → more deflation. Real debt burdens INCREASE in deflation even as nominal rates drop. Monetary easing becomes "pushing on a string" - you can't force people to spend. Bruegel's analysis of "stimulus without rebalancing" highlights this trap.
-
💸 Capital flight accelerating - foreigners voting with feet: Net FDI collapsed from +$334B inflows (2021) to -$154B outflows (2024) - largest exodus on record! 2025 shows utilized FDI down -12.7% YoY. Even ASHR seeing -$559.72M outflows in 1 month, -$1.95B over 1 year. Foreign investors describe China as "too big to ignore, but too controlled and opaque to fully trust". Capital controls prevent repatriation, policy opacity creates regulatory risk. When institutions managing billions are FLEEING despite 22% YTD gains, that's a RED FLAG.
-
🚨 Manufacturing in 8-month contraction streak: Official PMI at 49.2 for 8th consecutive month below 50, private RatingDog PMI fell to 49.9 missing 50.5 expectations. WORSE: Non-manufacturing PMI dropped to 49.5, first contraction since December 2022 dragged by real estate and services. This is BROAD-BASED weakness, not just one sector. When both manufacturing AND services contracting simultaneously, recession risk is real.
-
🤝 US-China trade truce fragile - November 2026 cliff: Current 10% tariff rate expires November 10, 2026 - just 11 months away. Negotiations could collapse, reverting to 145% peak tariff levels from May 2025. China must hit soybean purchase targets (25 million tons annually), strengthen fentanyl controls, maintain rare earth exports. Any violation triggers renegotiation. Structural US-China rivalry over Taiwan, South China Sea, technology remains - tariff truce is tactical pause, not strategic resolution.
-
💰 "Stimulus without rebalancing" diminishing returns: Bruegel analysis and Northern Trust's "Better Luck Next Year" report both highlight China's approach of monetary easing without structural reforms. September rate cuts drove 28% rally in ASHR... then November pause saw 4% pullback despite rates still at historic lows. Corporate/household credit demand WEAK despite "easy" money - confidence issues and household savings at historically high levels. You can lead a horse to water but can't make it drink - monetary stimulus ineffective when private sector won't borrow/spend.
-
🐋 Smart money selling $6.3M in calls at peak - follow the leaders: This institutional trade signals sophisticated players expect ASHR capped at $36-45 over 26 months. They're BETTING against breakout with real money ($6.3M premium at risk). When funds managing billions choose to cap upside and collect income rather than stay fully long into potential China recovery, that's incredibly bearish on magnitude of upside. They're saying "best case is $36" - not $45, not $50, just $36 (10% above current). That's WEAK conviction on China story.
-
📊 Gamma ceiling at $33-34 nearly impenetrable: Combined 147.7B gamma at $33-34 creates mechanical selling pressure as market makers hedge exposure. ASHR has failed MULTIPLE breakout attempts above $34 since October - this isn't random, it's structural. Would require sustained institutional BUYING (opposite of current -$559.72M outflows) to overcome. Current rally exhaustion pattern after 28% surge suggests momentum fading.
-
😱 Policy opacity and regulatory risk - remember 2021 crackdowns: Chinese government's unpredictable regulatory interventions create tail risk. 2021 education/tech sector crackdowns wiped out hundreds of billions overnight. Capital controls can be tightened without warning. State intervention in markets for "stability" undermines price discovery. Unlike US equities with clear regulatory frameworks, Chinese markets are "controlled and opaque" per institutional investors. This is POLITICAL risk that can't be hedged.
-
🌍 Global recession risk - China export-dependent: Weak global demand would hammer Chinese exports (critical growth driver). China's investment-heavy model created massive overcapacity in multiple sectors contributing to deflation. If advanced economies slip into recession in 2026, Chinese exports collapse, and even unlimited stimulus won't offset external demand shock. China tried this during 2008-2009 with RMB 4 trillion stimulus - created debt bubble that's still unwinding.
-
💔 Consumer confidence structurally broken - won't spend: Despite consumer confidence at 89.20 (August 2025), retail sales growth only 3% in September (worst since Nov 2024). Household savings at historically high levels amid property wealth destruction, job insecurity, demographic aging. No amount of rate cuts makes people spend when they're scared about the future. This is BEHAVIORAL/PSYCHOLOGICAL - takes YEARS to rebuild confidence, not quarters.
🎯 The Bottom Line
Real talk: Someone just pocketed $6.3 MILLION betting that China's rally is DONE and ASHR won't break above $36-45 over the next 26 months. This isn't a short-term hedge or earnings protection - this is a multi-year strategic view that China's structural problems (property crisis, deflation, capital flight, weak consumption) will cap any upside despite government stimulus efforts.
What this trade tells us:
- 🎯 Sophisticated institution expects RANGE-BOUND price action ($28-36) through January 2028, not breakout
- 💰 They're confident enough to collect $6.3M premium and cap upside at $36 (only 10% above current price!)
- ⚖️ The timing (after 22% YTD rally, amid -$559.72M fund outflows) shows profit-taking and risk reduction
- 📊 They struck ABOVE major gamma resistance ($33-34) knowing those levels extremely unlikely to break
- ⏰ 26-month timeframe captures ALL major catalysts: property stimulus, GDP data, trade negotiations, PBOC policy - and they STILL capped upside
This is NOT a "sell everything and run" signal - it's a "the easy money has been made, cap your risk" signal.
If you own ASHR:
- ✅ Consider trimming 25-50% at $32.50-33.50 levels (lock in 22% YTD gains before they evaporate)
- 📊 If holding through year-end, consider selling covered calls at $35-36 strikes to generate 6-10% income
- ⏰ Don't get greedy - you've already won! Up 22% YTD in China exposure is GREAT. Protecting profits is smart.
- 🎯 Set mental stop at $31 (major gamma support) if planning to hold - break below confirms bear case
- 🛡️ Consider selling covered calls to copy institutional strategy at smaller scale
If you're watching from sidelines:
- ⏰ Mid-December Central Economic Work Conference is next major catalyst - wait for clarity on 2026 stimulus
- 🎯 Pullback to $29-31 would be BETTER entry (10% off current with gamma support cushion)
- 📈 Looking for confirmation of: property stimulus that actually works, deflation ending (positive CPI), foreign capital inflows reversing
- 🚀 Longer-term (2-3 years), IF China executes property resolution + consumption rebalancing, $40-45 is possible
- ⚠️ Current setup (range-bound, low vol, institutional outflows) suggests WAITING is better than chasing
If you're bearish:
- 🎯 Support at $32.00 (54.9B gamma), major floor at $31.00, psychological level at $30
- 📊 Post-Conference put spreads ($32/$30) offer defined-risk way to play disappointment
- 📉 Watch for break below $31 - that's the trigger for cascade to $28-29 testing yearly lows
- ⚠️ Don't fight the 22% momentum blindly - wait for technical breakdown confirmation
- ⏰ Best bearish entry AFTER resistance rejection at $33-34 (lower risk, better R/R)
Mark your calendar - Key dates:
- 📅 Mid-December 2025 - Central Economic Work Conference (2026 GDP target, stimulus details)
- 📅 December 19 - Monthly/Quarterly OPEX (±2.97% implied move window)
- 📅 January 16, 2026 - Monthly OPEX (±5.21% implied move)
- 📅 Late January 2026 - Q4 2025 GDP data release (will China hit "around 5%" target?)
- 📅 Q1 2026 - Property stimulus implementation (if announced)
- 📅 November 10, 2026 - US-China tariff truce expiration (renegotiation risk)
- 📅 January 21, 2028 - Expiration of this $6.3M call sale
Final verdict:
China's long-term story remains compelling IF they execute on property market resolution, structural consumption rebalancing, and maintain trade peace with US. BUT, the track record over 4 years shows "stimulus without rebalancing" approach of monetary easing without structural reforms has DIMINISHING RETURNS.
At $32.59 after 22% YTD rally with 10 quarters of deflation, 8 months of manufacturing contraction, record -$154B net FDI outflows, and -$559.72M ASHR fund outflows in 1 month, the risk/reward is NO LONGER favorable for aggressive new positioning.
The $6.3M institutional call sale is a CLEAR signal: smart money is capping upside at $36, collecting premium, and preparing for range-bound-to-lower prices over the next 26 months.
Be patient. Let the Central Economic Work Conference clear in mid-December. Look for better entry points at $29-31 if you want exposure. The China opportunity will still be here in Q1 2026, and you'll sleep better at night paying $30 instead of $33.
This is a marathon, not a sprint. Protect your capital. 💪
Disclaimer: Options trading involves substantial risk of loss and is not suitable for all investors. This analysis is for educational purposes only and not financial advice. Past performance doesn't guarantee future results. China investing carries additional risks including capital controls, regulatory uncertainty, geopolitical tensions, and policy opacity. The 2,583x Z-score reflects this specific trade's size relative to recent ASHR history - it does not imply the trade will be profitable or that you should follow it. Always do your own research and consider consulting a licensed financial advisor before trading. China stimulus announcements can create volatile overnight gaps of 5-10% in either direction.
About ASHR - Xtrackers Harvest CSI 300 China A-Shares ETF: ASHR is an exchange-traded fund providing direct exposure to mainland China's 290 largest companies across the Shanghai and Shenzhen stock exchanges, tracking the CSI 300 Index with $2.32 billion in net assets and a 0.65% expense ratio. The fund offers diversified access to Chinese equities across financial services (22.44%), technology (22.07%), and industrials (16.67%) sectors.