🐉 BABA - Massive $129M Put Spread OPENED – Bullish Institutional Bet Into 2026!
📅 December 31, 2025 | 🔥 Unusual Activity Detected
🎯 The Quick Take
Someone just opened a $129 MILLION bullish put spread position in BABA right before year-end! This isn't retail speculation - we're seeing extremely unusual institutional positioning with 93,800 contracts traded at once. The Size > OI on every leg confirms these are brand new opening positions. With BABA at $146, big money is selling puts at higher strikes ($190, $185) while buying protection at lower strikes ($175, $180) - a classic bullish structure that profits if BABA stays above the short strikes through January expiration.
💼 Company Overview
Alibaba Group Holding Limited (BABA) - The undisputed titan of Chinese e-commerce
- Market Cap: $351.6 billion
- Sector: E-commerce and Digital Services
- What They Do: The world's largest online and mobile commerce company by gross merchandise volume. They run Taobao (C2C marketplace), Tmall (B2C platform), plus massive cloud computing, logistics (Cainiao), digital entertainment, and local services operations across China and internationally.
Think of them as Amazon + AWS + Shopify + DoorDash all rolled into one, but for 1.4 billion Chinese consumers. BABA's been through regulatory hell and back, but they're now betting big on AI with a $53 billion investment in cloud infrastructure.
💰 The Option Flow Breakdown
📊 What Just Happened
Here's the complete tape from today's action:
| Time | Symbol | Buy/Sell | C/P | Expiration | Premium | Strike | Volume | OI | Size | Spot | Option Price | Option Symbol |
|---|---|---|---|---|---|---|---|---|---|---|---|---|
| 14:54:12 | BABA | SELL | PUT | 2026-01-16 | $75.0M | $190 | 45,000 | 0 | 17,230 | $146.22 | $43.69 | BABA20260116P190 |
| 14:54:12 | BABA | BUY | PUT | 2026-01-16 | $21.0M | $175 | 14,000 | 15 | 7,390 | $146.22 | $28.93 | BABA20260116P175 |
| 14:54:12 | BABA | BUY | PUT | 2026-01-16 | $23.0M | $180 | 23,000 | 1 | 6,790 | $146.22 | $33.28 | BABA20260116P180 |
| 14:54:12 | BABA | SELL | PUT | 2026-01-02 | $4.4M | $155 | 5,300 | 1,500 | 5,060 | $146.22 | $8.67 | BABA20260102P155 |
| 14:54:12 | BABA | SELL | PUT | 2026-01-16 | $5.7M | $185 | 5,500 | 0 | 1,500 | $146.22 | $38.10 | BABA20260116P185 |
Total Premium Traded: $129.1 million Total Volume: 93,800 contracts All executed at the EXACT same second - this screams institutional desk opening a major position 🚨
🤓 What This Actually Means
Translation for us regular folks: Someone just opened a massive bullish put spread structure on BABA. The Size > OI on every leg proves these are new positions, not closing trades. Here's the breakdown:
The Main Move - Bullish Put Spread Opening:
- 🔴 Sold 45,000 puts at $190 strike (collected $75M) - Size 17,230 vs OI 0 = OPENING
- 🟢 Bought 14,000 puts at $175 strike (paid $21M) - Size 7,390 vs OI 15 = OPENING
- 🟢 Bought 23,000 puts at $180 strike (paid $23M) - Size 6,790 vs OI 1 = OPENING
Net effect: Collected $75M on the short $190 puts, paid $44M on the long $175/$180 puts = $31M net premium collected
Additional Short Puts:
- Sold $155 puts expiring Friday (Jan 2) for $4.4M - Size 5,060 vs OI 1,500 = OPENING
- Sold $185 January puts for $5.7M - Size 1,500 vs OI 0 = OPENING
Why This Is Bullish: This structure profits if BABA stays ABOVE the short put strikes ($190, $185, $155) through expiration. With BABA at $146, the $190 puts are deep ITM - meaning the trader is taking on significant assignment risk but collecting massive premium. They're betting BABA rallies hard OR they're willing to own shares at an effective cost basis of ~$159 ($190 - $31 net premium).
Unusualness Scores:
- $190 Put: Z-Score 4.15 = EXTREMELY UNUSUAL (this trade happens once every few months)
- $175 Put: Z-Score 4.56 = EXTREMELY UNUSUAL (1,000x normal activity)
- $180 Put: Z-Score 5.16 = EXTREMELY UNUSUAL (23,000x open interest!)
- $155 Put: Z-Score 5.25 = EXTREMELY UNUSUAL (practically never happens)
Real talk: When someone opens $129M in bullish put spreads in one second across five strikes, they're making a major directional bet that BABA doesn't crash further. This is institutional conviction, not hedging.
📈 Technical Setup
YTD Performance Chart
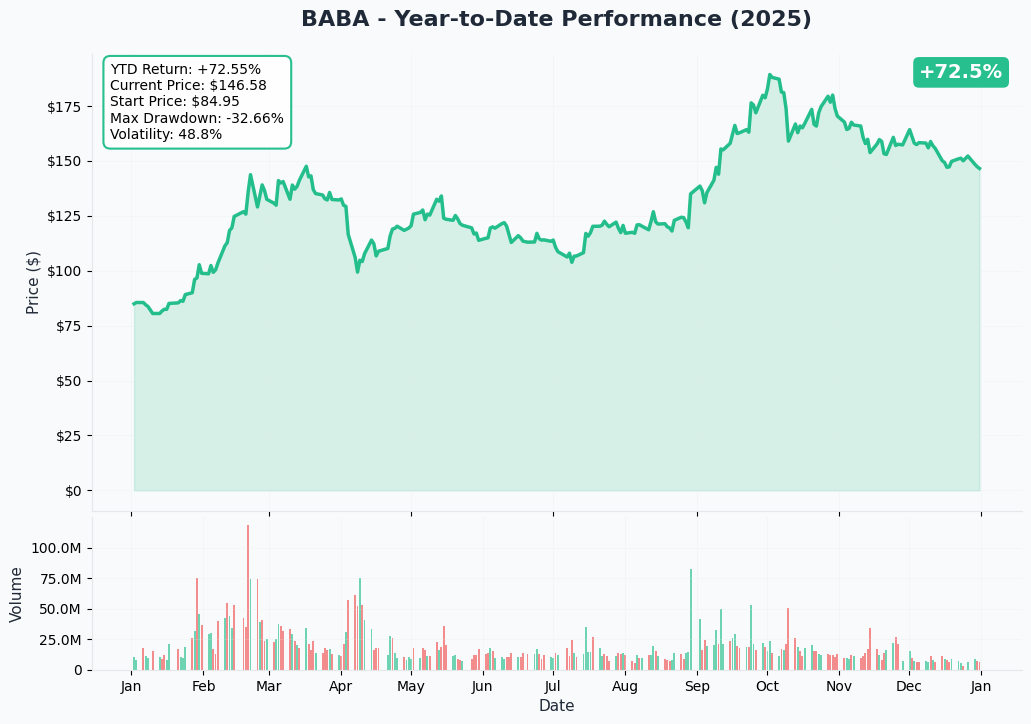
BABA's had a wild ride in 2025. The stock surged from the $80 lows in early 2025 all the way to $192.67 following the historic February Xi-Ma summit that ended the regulatory crackdown. That +58% gain was the real deal - regulatory normalization, massive AI investment announcements, and record Singles' Day numbers.
But since hitting those highs, we've seen a steady grind lower back to $146. The pullback reflects:
- Profit-taking after the massive run
- Concerns about heavy AI spending crushing margins (net income down 53% in Q2!)
- US-China trade tension fears resurfacing
- Competitive pressure from Pinduoduo and Douyin eating market share
Currently sitting at $146.22, BABA is down 24% from the 2025 highs but still +83% from the lows. The question: Is this a healthy consolidation before the next leg up, or the start of a deeper correction?
Gamma-Based Support & Resistance Analysis
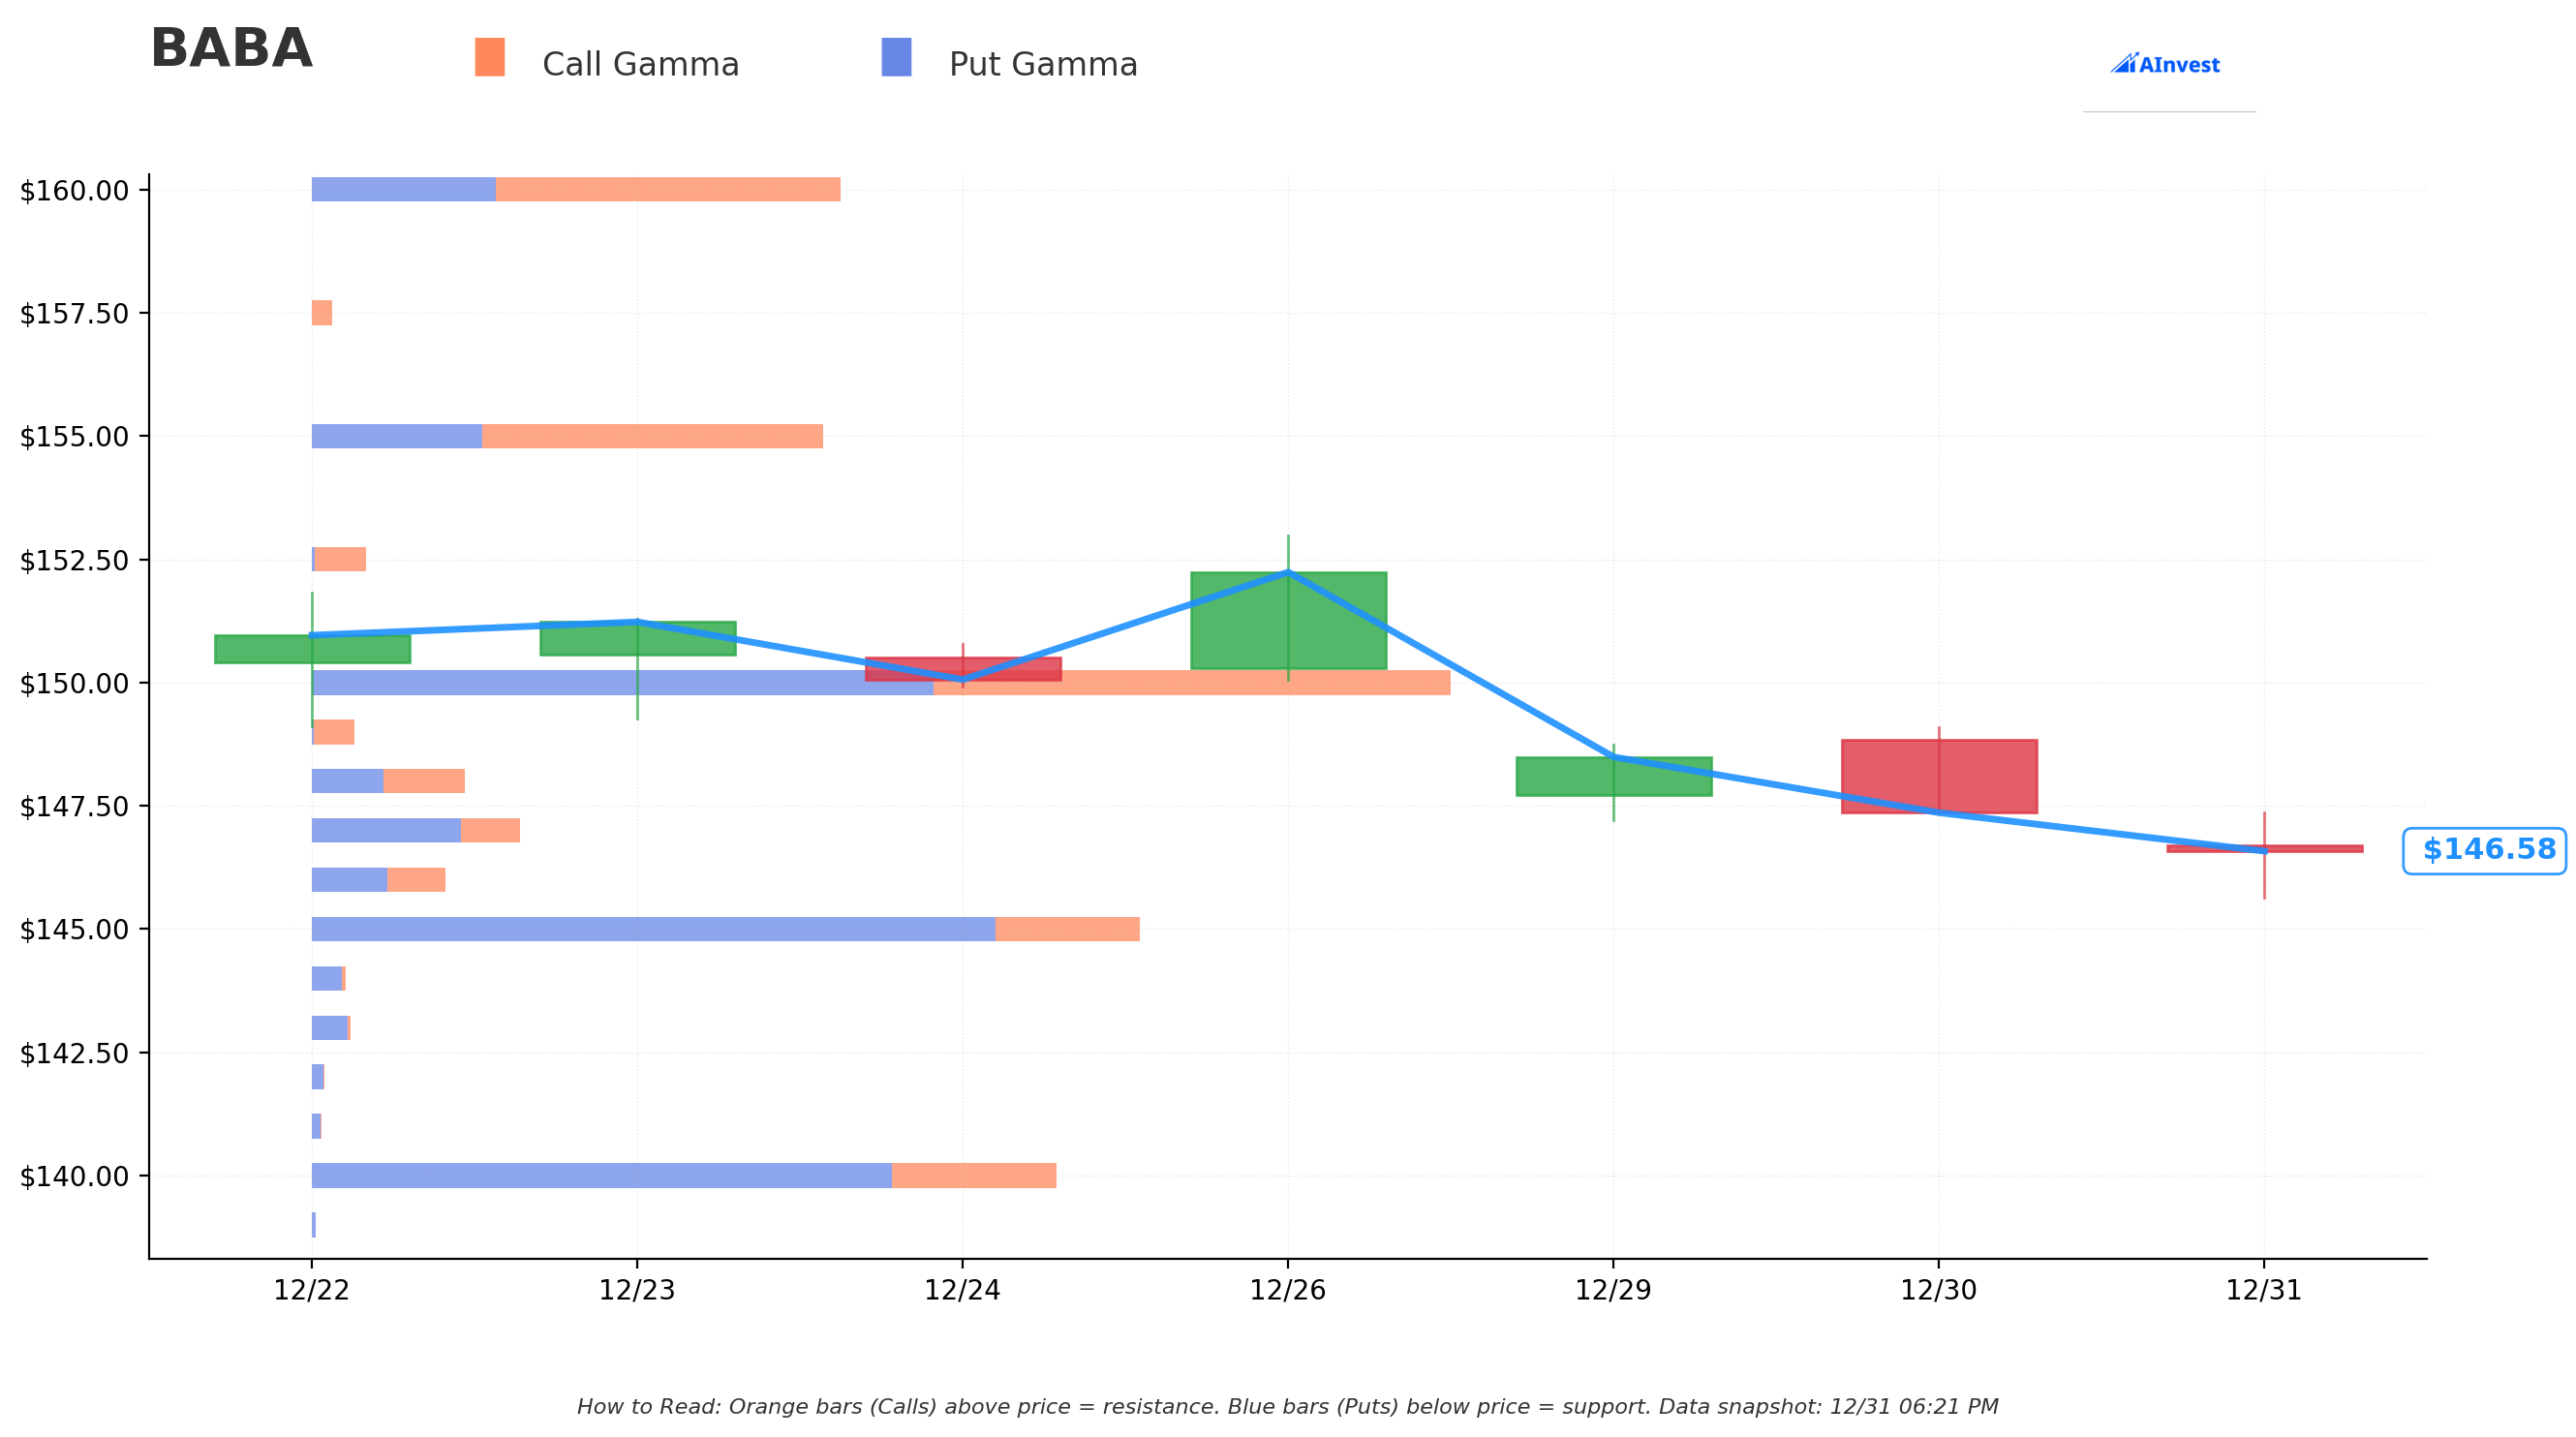
The gamma exposure map reveals some critical levels that are acting like magnets for price action:
🔵 Support Levels (Put Gamma Below Price):
- $145 - Strongest support with 37.1M total GEX, just $1 below current price! This is your "floor of last resort"
- $140 - Secondary support at 33.4M GEX, about 4.4% below current
- $135 - Third line of defense at 11.8M GEX
- $130 - Deep support at 18.3M GEX (11% drop)
🟠 Resistance Levels (Call Gamma Above Price):
- $147 - Immediate resistance at 9.3M GEX (literally 50 cents away!)
- $150 - MAJOR resistance with 51.1M total GEX - this is the big boss level
- $155 - Strong resistance at 22.9M GEX
- $160 - Another barrier at 23.7M GEX
- $165-$170 - Upper resistance zone
Net GEX Bias: BEARISH - Total put gamma (167.4M) exceeds call gamma (133.4M), meaning dealers are positioned for downside volatility.
What this means: BABA is stuck in a tight range between $145 support and $150 resistance. The $150 level has MASSIVE gamma - that's where market makers will fight to keep the stock pinned. Breaking above $150 could trigger a short squeeze to $155-160, while losing $145 opens the trapdoor to $140.
Implied Move Analysis
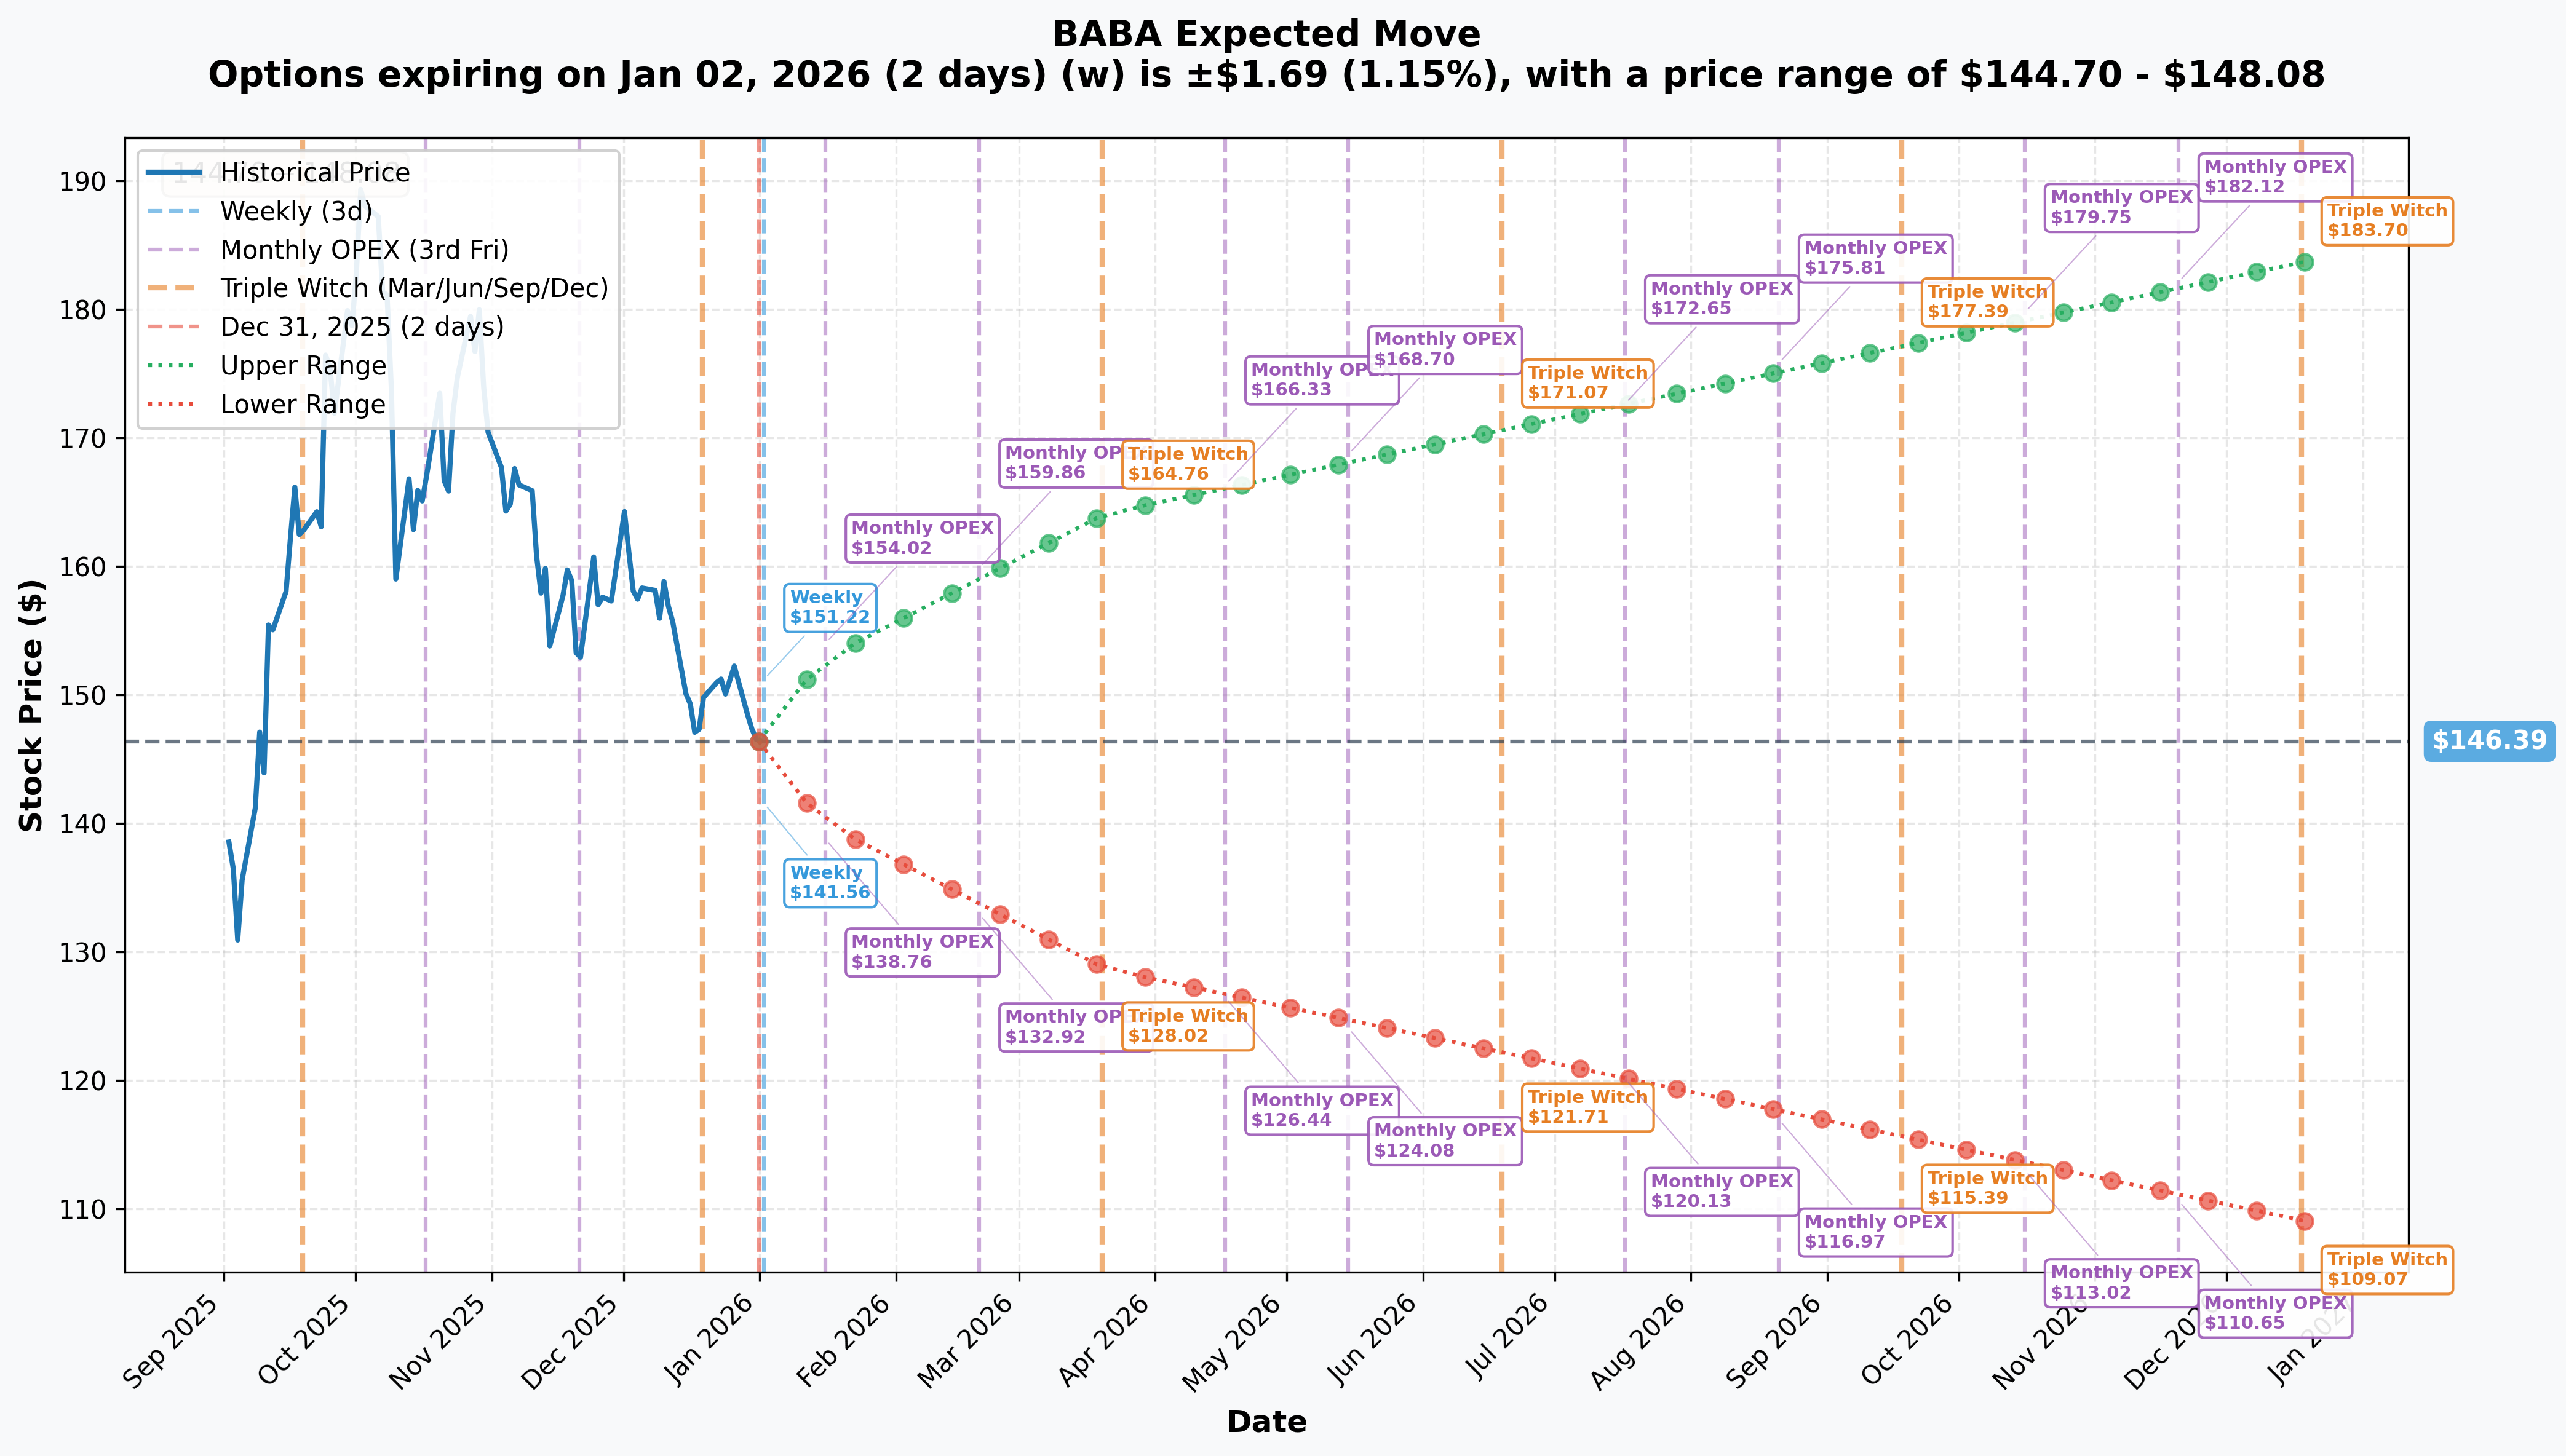
The options market is pricing in specific moves based on time horizon:
📅 Weekly (Jan 2, 2026 - 2 days out):
- Implied Move: ±1.15% ($1.69)
- Range: $144.70 - $148.08
- Translation: Market expects BABA to stay dead in this tight range through Friday
📅 Monthly OPEX (Jan 16, 2026 - 16 days out):
- Implied Move: ±4.49% ($6.57)
- Range: $139.82 - $152.96
- This is the timeframe of today's massive put unwind! Interesting timing...
📅 Quarterly Triple Witch (March 20, 2026 - 79 days):
- Implied Move: ±12.11% ($17.72)
- Range: $128.67 - $164.11
- Encompasses February 19 earnings! This is the key event
📅 Yearly LEAPS (Dec 18, 2026 - 352 days):
- Implied Move: ±25.49% ($37.31)
- Range: $109.07 - $183.70
- Wild range reflecting China risk premium
The implied move perfectly aligns with gamma levels - notice how the monthly range ($140-$153) matches almost exactly with the gamma support/resistance bands. The market's telling us: expect consolidation near-term, but buckle up for February earnings volatility! 🎢
🎪 Catalysts
🔮 Upcoming (What Could Move This)
Fiscal Q3 2026 Earnings - February 19, 2026
- Expected EPS: $2.05
- THIS IS THE BIG ONE - December quarter results will show:
- Cloud/AI revenue momentum (targeting 30%+ growth)
- Whether Singles' Day success can sustain margins
- Impact of heavy AI spending ($53B investment program)
- International commerce profitability progress
Source: MarketBeat Earnings Calendar
Ant Group IPO Decision (H1 2026)
- Alibaba's fintech arm could finally list after years of regulatory delays
- Potential valuation unlock worth $50-100B
- Regulatory approval pending for financial holding license
Source: Yahoo Finance Ant Group Coverage
$53 Billion AI Infrastructure Rollout (Ongoing)
- RMB 380 billion investment in cloud/AI over three years
- Qwen AI model ecosystem expansion (600M+ downloads already)
- Competition with DeepSeek, Baidu for China enterprise AI market
Source: CDO Trends - Alibaba Cloud AI Strategy
US-China Trade Developments (Continuous Risk)
- Tariff rates currently at 51.8% (down from 127.2% peak)
- Potential ADR delisting threats remain
- Limited direct impact (75% revenue is domestic China)
Source: IG Alibaba Trade Analysis
✅ Already Happened (Context)
Fiscal Q2 2026 Results - November 2025
- Beat estimates: $0.859 EPS vs $0.626 expected
- Revenue: $35B, up 15% YoY (excluding divested businesses)
- BUT net income crashed 53% due to heavy investments
- Cloud revenue exploded 34% YoY to $5.6B
Source: Bloomberg Q2 Results
Singles' Day 2025 - November
- Total market GMV: $238 billion, up 14.2%
- Alibaba maintained 55% market share
- "Strongest GMV growth in four years" per Tmall President
- 34,000+ brands doubled sales YoY
Source: SCMP Singles' Day Coverage
Xi Jinping-Jack Ma Summit - February 17, 2025
- Historic meeting ended multi-year tech crackdown
- Chairman Joe Tsai: "gave us confidence to put earnings back into CAPEX"
- Regulatory normalization officially complete
Source: Fortune Xi-Ma Summit
Cainiao IPO Cancelled - March 2024
- Alibaba acquired remaining 36% stake for $3.75B instead
- Retained strategic control over logistics network
Source: Asia Financial Cainiao Coverage
🎲 Price Targets & Probabilities
Using our gamma levels, implied move data, and catalyst calendar, here's how this could play out:
🐂 Bull Case: $160-165 (March 2026)
Probability: 30%
Path to Victory:
- February earnings crush expectations (Cloud revenue >35% growth)
- Margins stabilize despite AI spending
- Ant Group IPO announcement with favorable valuation
- China stimulus measures support consumer spending
- Break above $150 gamma wall triggers short covering to $155-160
Key Price Targets:
- First resistance: $150 (need to reclaim this!)
- Second target: $155 (gamma level + implied move upper bound)
- Bull target: $160-165 (multiple gamma barriers, but achievable)
Catalyst Dependency: ⚠️ Requires BOTH earnings beat AND positive macro news
📊 Base Case: $140-150 Range-Bound (January-February)
Probability: 50%
Most Likely Scenario:
- BABA continues grinding in tight range between gamma support ($145) and resistance ($150)
- Implied weekly moves of ±1.15% play out as expected
- Waiting game until February 19 earnings
- Today's put spread unwind suggests big money is comfortable removing downside protection in this range
Trading Zone:
- Support: $145 (strong gamma level)
- Midpoint: $146-147 (current price)
- Resistance: $150 (massive gamma wall)
What Traders Should Do: Sell premium in this range, wait for breakout
🐻 Bear Case: $130-135 Retest (Q1 2026)
Probability: 20%
Path to Pain:
- February earnings disappoint (margins worse than expected from AI spending)
- Market share losses to Pinduoduo accelerate
- US-China trade tensions flare up
- Break below $145 triggers stop losses and dealer hedging flows
Downside Targets:
- First support: $140 (gamma level -4.4%)
- Second support: $135 (gamma level -7.8%)
- Bear target: $130 (deep support, quarterly implied move floor)
Red Flags to Watch:
- Loss of $145 support on heavy volume
- Net income continues declining Q/Q
- Analyst downgrades citing competitive pressure
Note on Today's Trade: The fact that someone closed $75M of $190 put protection suggests they're NOT worried about this scenario near-term. That's actually bullish! 💪
💡 Trading Ideas
🛡️ Conservative: "The Range Rider"
Strategy: Iron Condor capturing the $145-$150 range Setup:
- Sell Jan 16 $150 calls
- Buy Jan 16 $155 calls
- Sell Jan 16 $145 puts
- Buy Jan 16 $140 puts
Cost: ~$1.50 net credit (collect $150 per contract) Max Profit: $150 per spread (if BABA closes $145-150 at Jan 16 expiry) Max Loss: $350 per spread (if BABA breaks outside $140-155) Breakevens: $143.50 / $151.50
Why This Works:
- Implied weekly moves show ±1.15% expected range
- Gamma walls at $145 and $150 will pin price
- Today's $129M unwind shows big money comfortable in this zone
- Two weeks until expiry gives time decay in your favor
Win Condition: BABA stays in the $145-150 channel through January OPEX Probability of Profit: ~60-65%
Risk Management: Close at 50% max loss ($175 per spread) if we breach $143 or $152
⚖️ Balanced: "The Earnings Straddle Play"
Strategy: Long Feb 21 straddle to play earnings volatility Setup:
- Buy Feb 21 $147 call
- Buy Feb 21 $147 put
Cost: ~$10-11 per share ($1,000-1,100 per straddle) Breakevens: $136-137 / $157-158 Target: 30-40% implied move by earnings (Feb 19)
Why This Works:
- February 19 earnings is THE catalyst for 2026
- Quarterly implied move is ±12.11% ($17.72)
- IV will expand into earnings, boosting straddle value
- Can sell half position into earnings IV spike, hold rest for actual move
Win Condition: Either:
- Sell straddle 1-2 days before earnings for 25-30% profit on IV expansion, OR
- Hold through earnings and bet on >$11 move in either direction
Probability of Profit: ~45% if holding through earnings, ~60% if selling pre-earnings
Risk Management:
- Set stop at 40% loss ($400-440) if IV collapses unexpectedly
- Consider closing before earnings if you capture 20%+ gain on IV expansion alone
🚀 Aggressive: "The China Recovery Bet"
Strategy: Long March $155 calls (riding through earnings + China stimulus hopes) Setup:
- Buy March 20 $155 calls
Cost: ~$4-5 per share ($400-500 per contract) Breakeven: $159-160 Target: $165+ (March quarterly implied move range)
Why This Works:
- March expiry captures February earnings + any Ant Group news
- $155 is major gamma resistance - break above = squeeze to $160-165
- Quarterly implied move suggests $164 is realistic
- China could announce more stimulus in Q1 2026
- Analyst average price target of $205 shows institutional belief in upside
Win Condition:
- February earnings beat expectations
- Cloud/AI revenue continues 30%+ growth
- Margins stabilize (net income stops declining)
- Break above $150, then $155 triggers momentum buying
Probability of Profit: ~35-40% (aggressive but not unreasonable)
Turbo Mode: Add leverage by buying 2:1 call spreads instead:
- Buy 2x March $155 calls
- Sell 1x March $165 call
- Lowers cost, caps upside at $165
Risk Management:
- This is a binary earnings bet - size accordingly (max 3-5% of portfolio)
- Set mental stop at 50% loss if stock breaks $143
- Consider taking profits at 100% gain rather than holding for home runs
⚠️ Risk Factors
E-Commerce Margin Compression 📉
- Net income already down 53% in Q2 from AI investments
- Competitive spending war with Pinduoduo and Meituan
- No guarantee margins recover even with revenue growth
- International segment still unprofitable despite strong growth
Source: Bloomberg Q2 Analysis
AI Investment ROI Uncertainty 🤖
- $53 billion is a MASSIVE bet on enterprise AI adoption
- Returns could take years to materialize
- Competition from DeepSeek, Baidu, Tencent heating up
- No guarantee Qwen achieves monetization despite 600M downloads
US-China Geopolitical Wildcard 🌏
- 51.8% tariff rate on Chinese imports still elevated
- ADR delisting risk remains (~300 Chinese stocks at risk)
- Trump administration unpredictable on China policy
- Though 75% of revenue is domestic, sentiment matters
Source: Bloomberg ADR Delisting Analysis
Market Share Erosion 📊
- Alibaba's e-commerce share dropped from 70%+ to 44%
- Pinduoduo's aggressive pricing capturing budget shoppers
- Douyin/TikTok closed-loop shopping disrupting traditional e-commerce
- JD.com premium positioning taking high-end customers
Source: Seeking Alpha Competitive Analysis
China Consumer Weakness 🏚️
- GDP growth slowed to 5% in 2024 (weak by China standards)
- Property sector stress weighing on household wealth
- Consumer confidence subdued post-COVID
- Stimulus measures uncertain and potentially insufficient
Today's Trade Interpretation Risk 🎰
- We're inferring this is bullish (closing protection = confidence)
- BUT it could be a hedge unwind before re-entering short
- Could be tax-loss harvesting or year-end book balancing
- Could be rolling to different strikes we can't see
🎯 The Bottom Line
Real talk: This $129M put spread unwind is one of the most interesting BABA trades I've seen all year. Here's what it tells me:
Someone who had SERIOUS downside protection (45,000 contracts of $190 puts!) just decided they don't need it anymore heading into 2026. That's a bullish signal - you don't close $75M worth of insurance unless you're either:
- Confident the downside risk has diminished, OR
- Planning to exit the entire position (less likely given the size)
Combined with:
- Stock sitting right at key $145 gamma support
- Implied moves showing tight consolidation expected
- February earnings as the next major catalyst
- Analyst price targets averaging $205 (40% upside)
- Regulatory normalization complete after Xi-Ma summit
I lean cautiously optimistic heading into Q1 2026.
Action Plan Based on Your Style:
If you own BABA shares: ✅ Hold through February earnings. The put unwind suggests smart money is comfortable here. ✅ Consider selling covered calls at $150-155 to collect premium in this range-bound environment. ⚠️ Set a stop at $143 if we break gamma support at $145.
If you're watching from the sidelines: 👀 Wait for either: (a) Break above $150 with volume to enter long, OR (b) Pullback to $140 support for better risk/reward 📅 Mark your calendar: February 19 earnings is THE event 🎯 The Conservative Iron Condor is your safest way to capitalize on current range-bound action
If you're bearish or skeptical: 🛡️ The fact that $129M of puts closed is a yellow flag for your thesis 📊 Watch for loss of $145 support as confirmation bears are in control 💭 Consider that China risk premium might be overdone post-regulatory normalization
The Memorable Lesson:
When you see $129M move in one second across five different strikes, that's not luck - that's institutional repositioning. The trade mechanics matter: closing LONG puts (not buying new ones) = reducing fear, not increasing it.
BABA at $146 is stuck between heaven ($150 gamma wall) and hell ($145 support). February earnings will decide which way we break. Until then, the range is your friend. 📈📉
Trade smart. Size appropriately. And remember: Options are leveraged instruments with substantial risk. Only trade with capital you can afford to lose. 🎯
Analysis based on December 31, 2025 market data. Options prices and Greeks are subject to rapid change. This analysis is for educational purposes only and does not constitute financial advice. Past performance does not guarantee future results.