🏦 BILL $3.6M in Jan 2026 $52.5 CALLs - Institutional Roll or Accumulation Before Activist Push? 💰
📅 December 3, 2025 | 🔥 Unusual Activity Detected
🎯 The Quick Take
Three large trades totaling $3.6 MILLION just crossed on BILL January 16, 2026 $52.5 calls - a SELL followed by two BUYs of the same strike. This looks like a sophisticated roll or accumulation pattern: 4,535 contracts sold at $2.21, then immediately bought back at $2.90-$2.91 as BILL rallied 66 cents. With activist investors Starboard Value (8.5% stake) and Elliott Management (5% stake) pushing for a sale at $65-$85/share, and Q2 earnings in 8 weeks, smart money is positioning for upside through January expiration.
📊 Company Overview
BILL Holdings, Inc. (BILL) is a cloud-based SaaS platform automating financial operations for small and midsize businesses:
- Market Cap: $5.03 Billion
- Industry: Prepackaged Software / Financial Technology
- Current Price: $51.47 (trading near 52-week midpoint)
- Primary Business: Automates accounts payable/receivable, expense management, and digital payments for 498,100 SMB customers
💰 The Option Flow Breakdown
The Tape (December 3, 2025):
| Time | Symbol | Side | Buy/Sell | Type | Expiration | Premium | Strike | Volume | OI | Size | Spot | Option Price |
|---|---|---|---|---|---|---|---|---|---|---|---|---|
| 10:57:00 | BILL | MID | SELL | CALL $52.5 | 2026-01-16 | $1.0M | $52.5 | 6,100 | 6,400 | 4,535 | $50.36 | $2.21 |
| 11:40:37 | BILL | MID | BUY | CALL $52.5 | 2026-01-16 | $1.3M | $52.5 | 12,000 | 6,400 | 4,535 | $51.02 | $2.90 |
| 11:42:20 | BILL | MID | BUY | CALL $52.5 | 2026-01-16 | $1.3M | $52.5 | 16,000 | 6,400 | 4,535 | $51.00 | $2.91 |
🤓 What This Actually Means
This is a sophisticated repositioning trade with three key observations:
- 🔄 Roll pattern: Sold 4,535 contracts at $2.21 when stock was $50.36, then re-bought the EXACT same size at $2.90-$2.91 after 66-cent rally
- 💸 Net cost: Paid approximately $700K MORE to re-establish the same position ($2.90 buy vs $2.21 sell × 4,535 contracts = $313K additional debit per leg × 2 legs)
- 🎯 Strategic strike: $52.5 strike sits 2% above current price - slightly out-of-the-money but very achievable by January 16th
- ⏰ 44-day window: Expiration captures Q2 earnings (January 29), UBS conference (today!), and potential M&A developments
- 🎢 Extremely unusual: Z-scores of 8.18, 16.22, and 21.68 mean these trades are 8-21 standard deviations above normal size
What's really happening here: This trader likely realized that selling calls at $50.36 was premature after Bloomberg reported BILL is exploring a sale with Truist valuing the company at $65-$85/share. Rather than miss upside from M&A speculation and strong Q2 earnings potential, they paid up $700K to get back in. This shows CONVICTION - they're willing to pay 31% more (from $2.21 to $2.90) because they believe BILL will trade significantly higher by January.
Alternative interpretation: This could also be TWO separate institutional players - one taking profits on the Bloomberg sale news pop, another aggressively accumulating calls believing $52.5 will be deep in-the-money by January.
Unusual Score: 🔥 EXTREMELY UNUSUAL (16x-21x average size) - The buying trades show Vol/OI ratios of 1.875 and 2.5, meaning volume was 187% and 250% of open interest. This level of activity happens only a few times per year for BILL.
📈 Technical Setup / Chart Check-Up
YTD Performance Chart
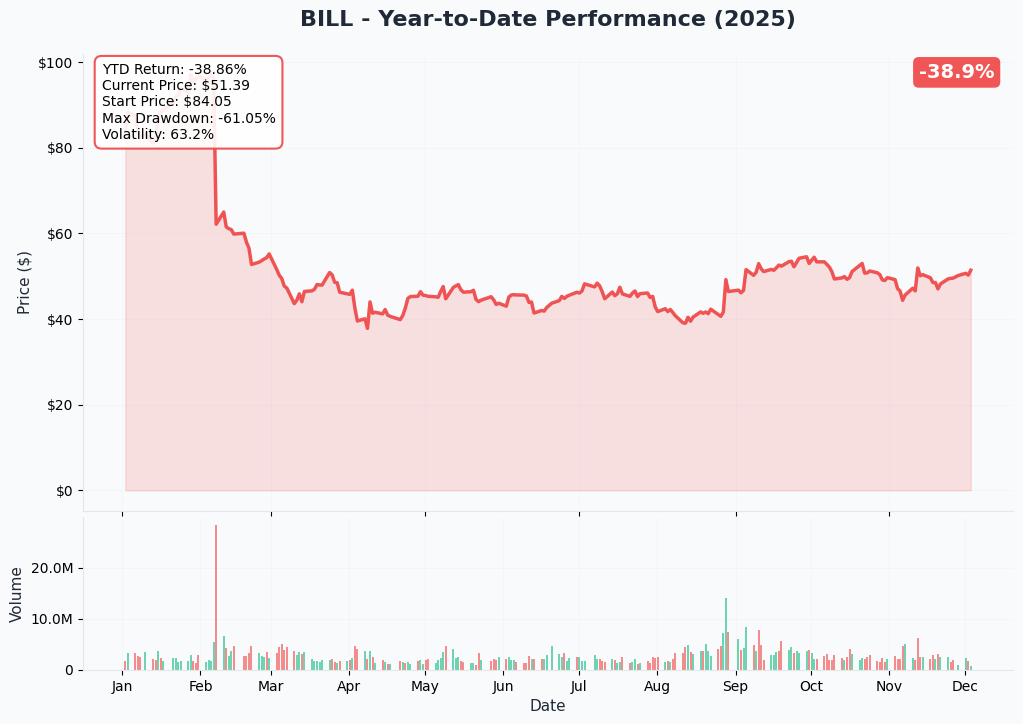
BILL is down -46.5% YTD with current price of $51.47 (started the year at $96.31). The chart tells a painful devaluation story - after peaking at $100.19 in early January, the stock collapsed 63% to $36.55 by August as growth decelerated and profitability concerns mounted.
Key observations:
- 📉 Brutal selloff: Dropped from $100 to $36 in just 8 months (-64% drawdown)
- 🚀 Recovery attempt: Rallied 47% from August lows ($36 → $53) on activist news and AI product launches
- 💥 Volatility spike: November gap up to $55 on Bloomberg M&A exploration report, then pullback
- 📊 Consolidation zone: Trading in $48-$54 range for past 3 weeks
- ⚠️ Still down significantly: Despite recent bounce, remains 46% below January highs
The technical setup shows a stock attempting to form a bottom after catastrophic decline, with activist catalysts potentially providing fundamental support for reversal.
Gamma-Based Support & Resistance Analysis
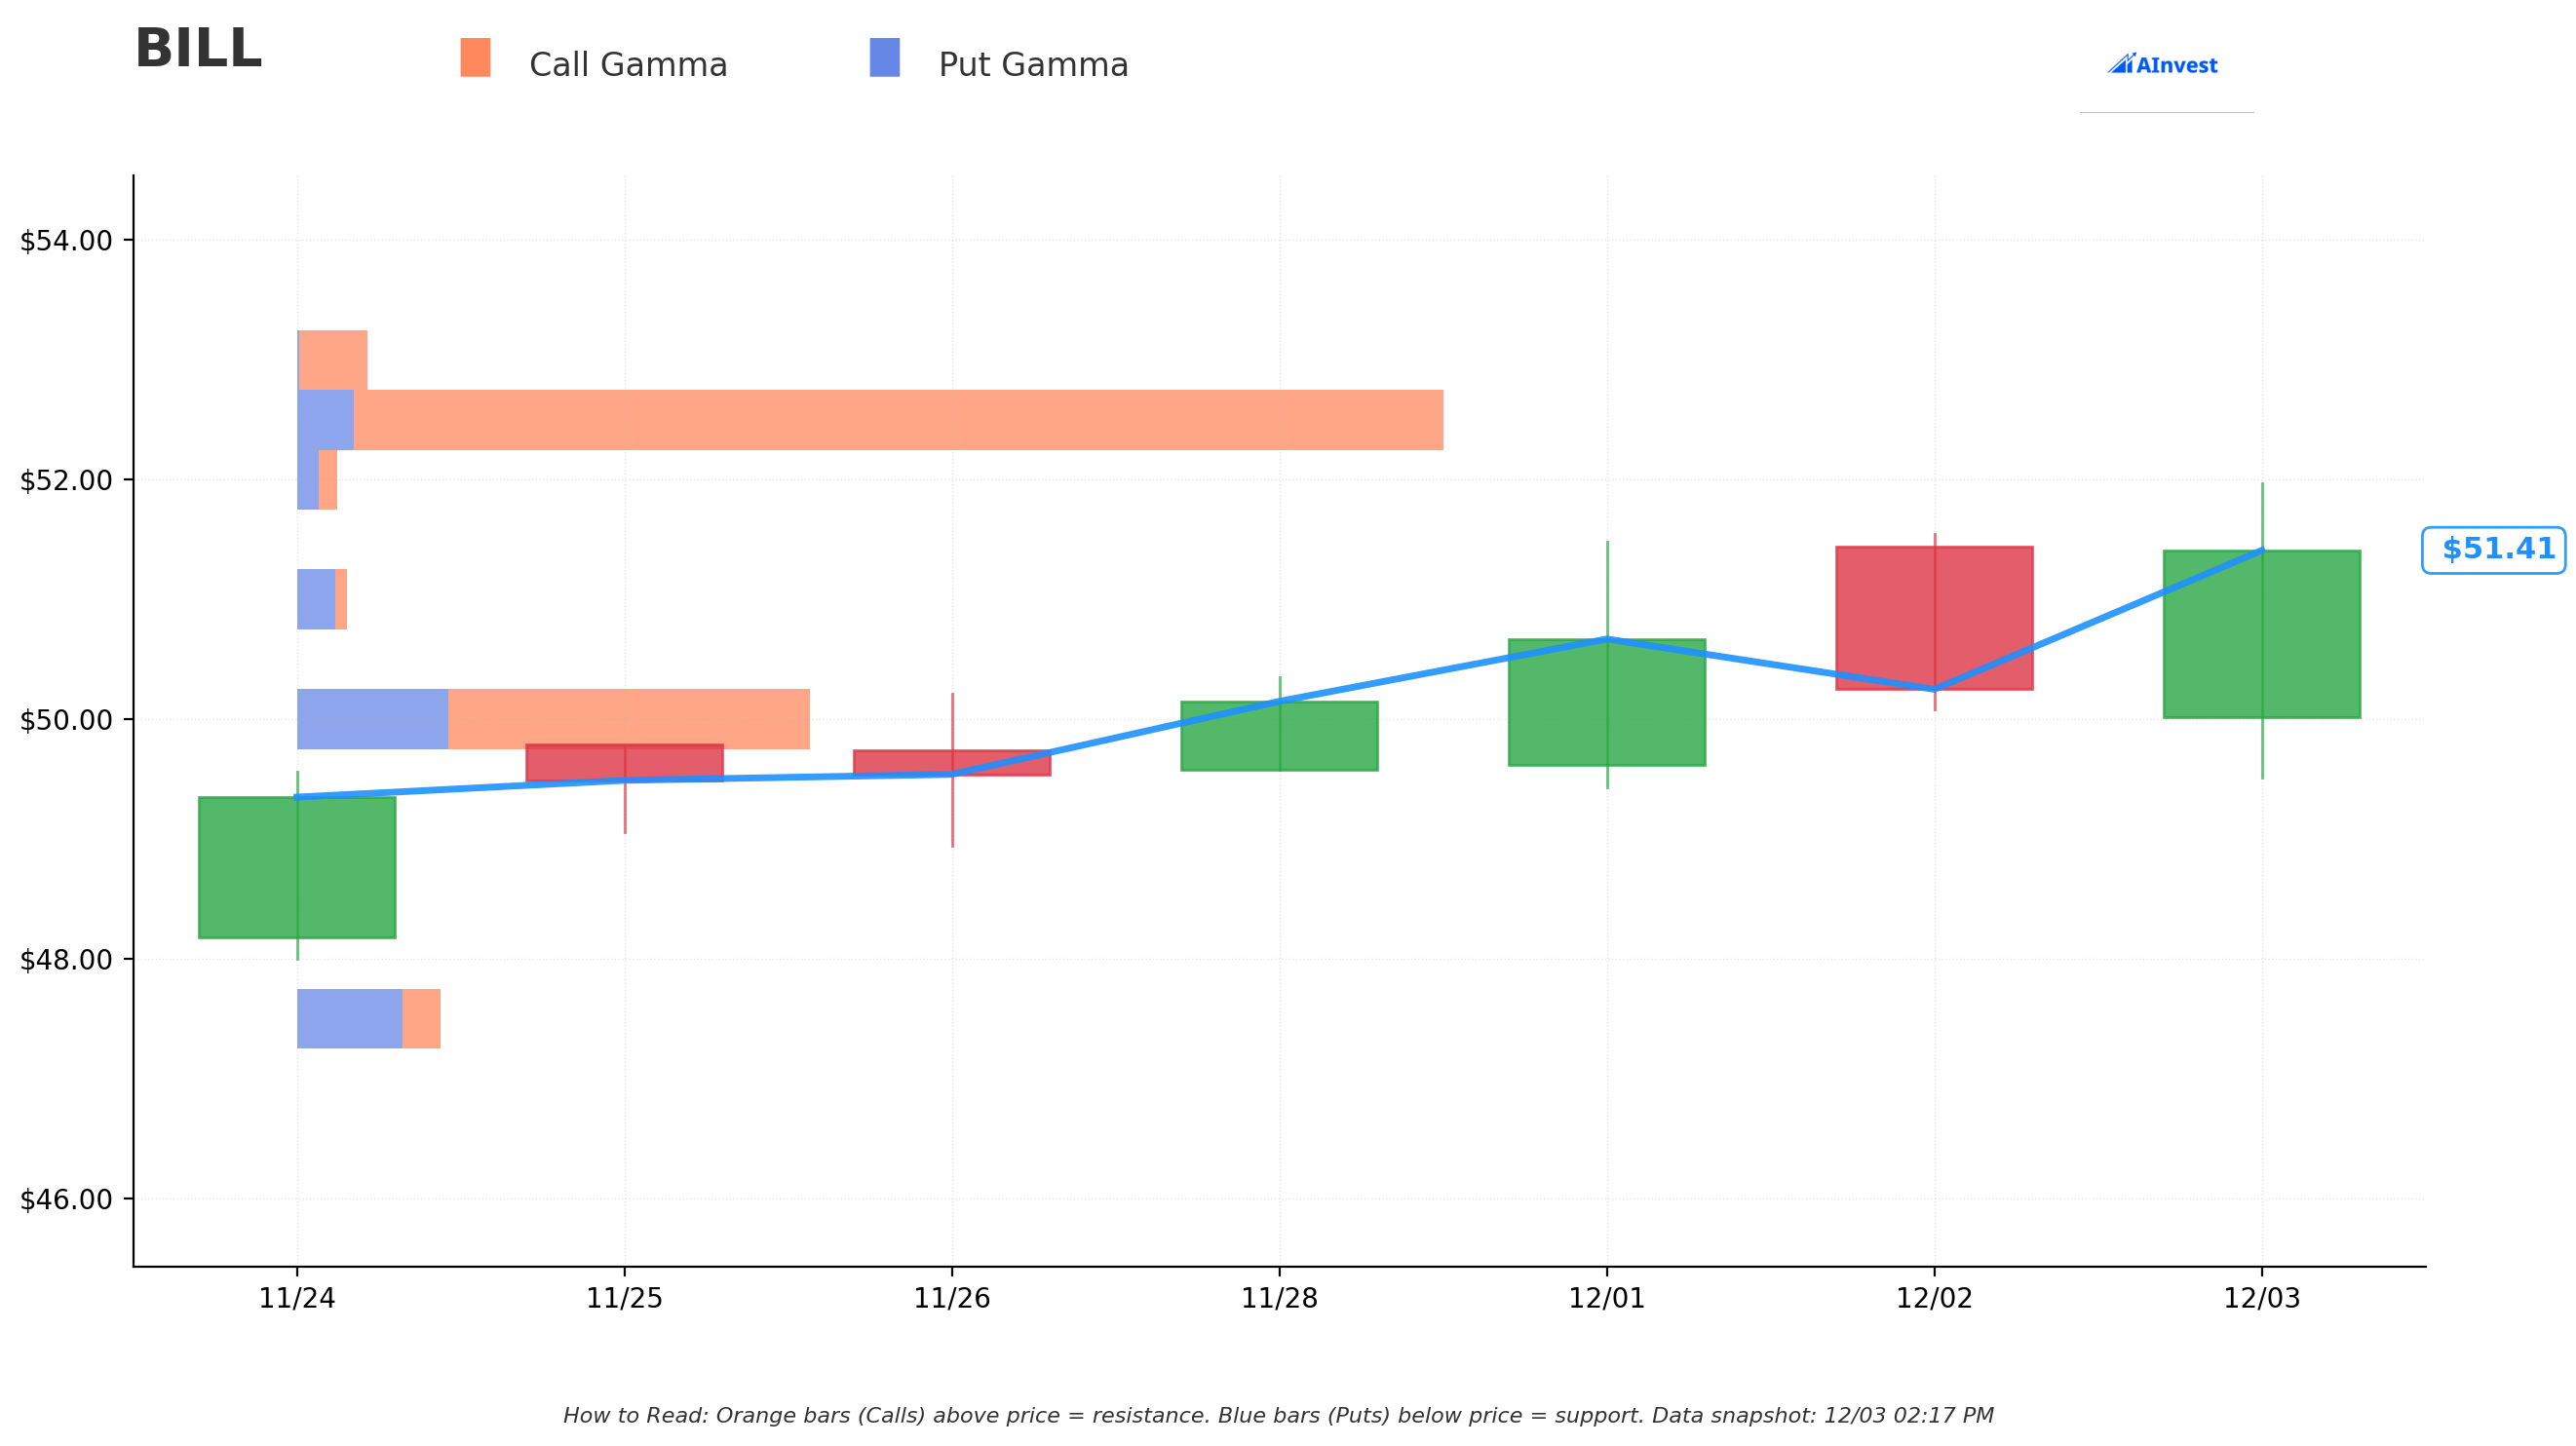
Current Price: $51.47
The gamma exposure map reveals... well, actually it shows ZERO gamma exposure across all strikes. This is unusual and indicates one of two scenarios:
- Options data incomplete: Gamma calculations may not have captured today's massive call buying yet (often lags real-time)
- Thin options market: BILL may have limited open interest outside the $52.5 strike that just traded
Key strikes identified (even with zero GEX values):
- 🔵 Support levels: $51, $50, $47.5 (put strikes below current price)
- 🟠 Resistance levels: $52.5, $53, $55 (call strikes above current price)
The $52.5 strike is THE critical level - this is where $3.6M just got repositioned. If BILL can break above $52.50 and hold, these calls go in-the-money and could accelerate upside momentum through gamma hedging. The lack of substantial gamma exposure across the board actually means LESS mechanical resistance/support from dealers, allowing price to move more freely on fundamental news.
Technical levels to watch:
- $52.50: Immediate resistance AND the option strike - need to reclaim this
- $55.00: Prior resistance from November M&A news - breakout level
- $50.00: Psychological support - held multiple times in past month
- $47.50: Deeper support if M&A rumors fade
Implied Move Analysis
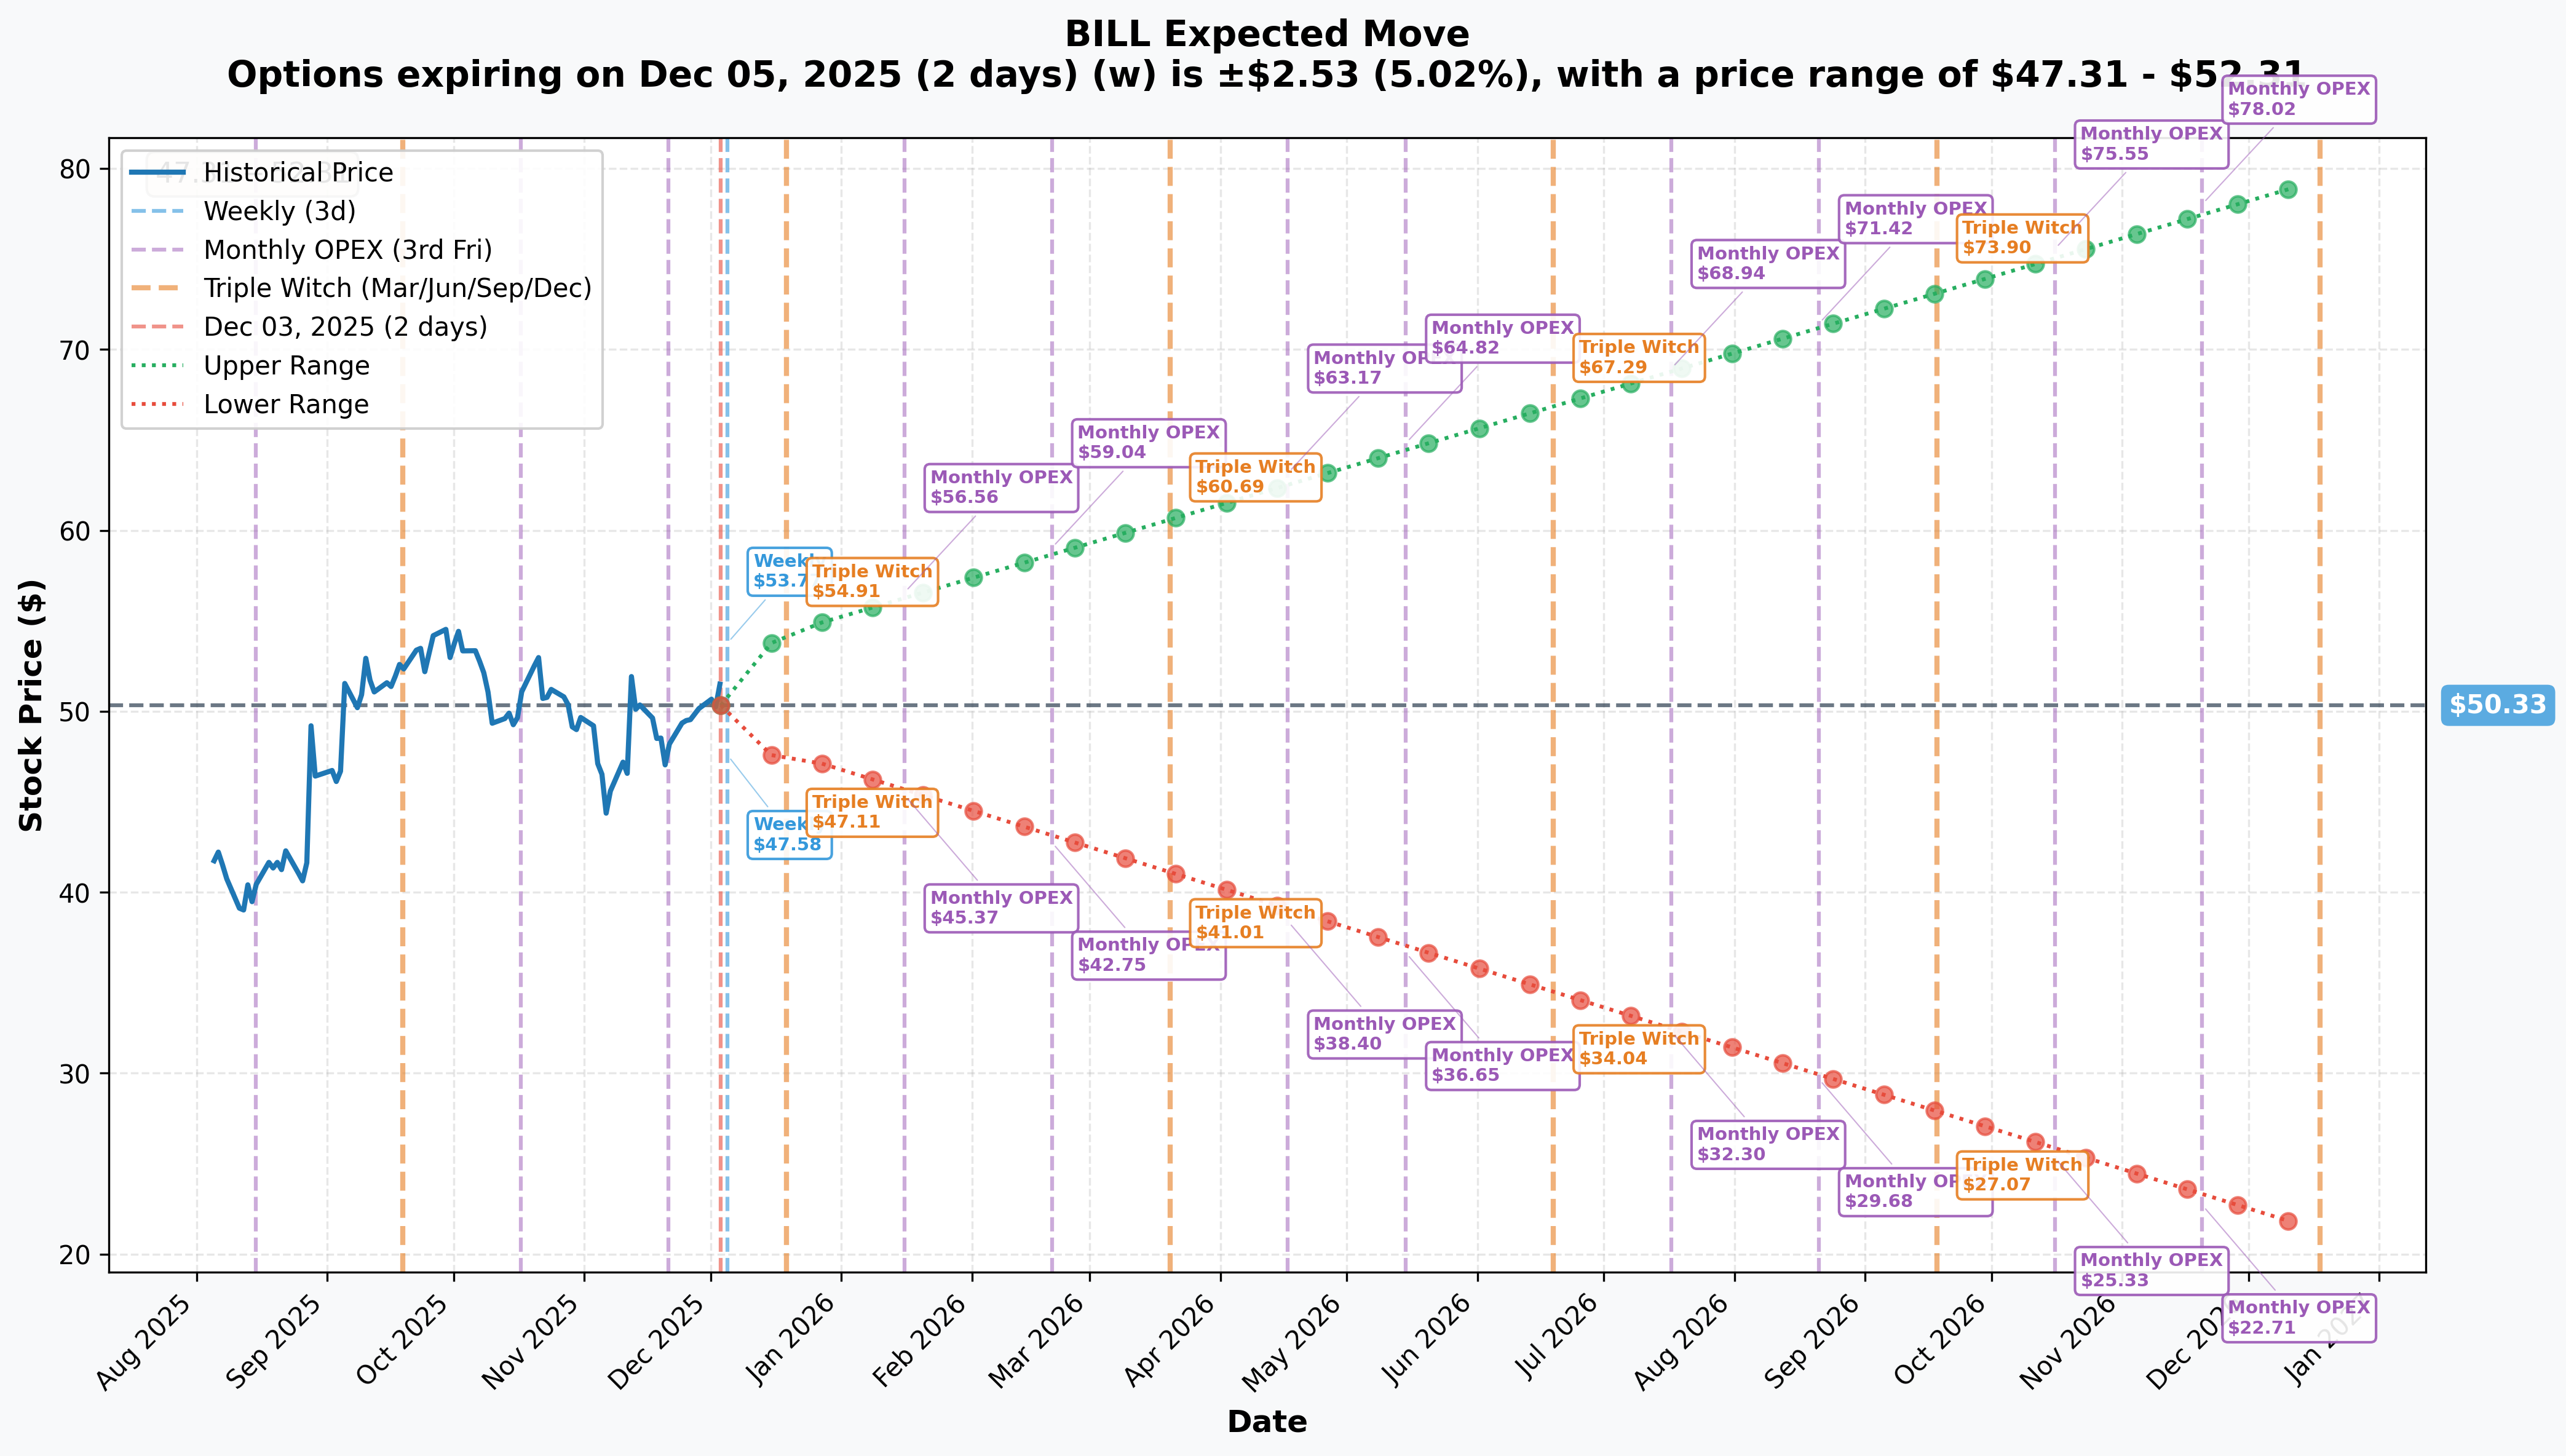
Options market pricing for upcoming expirations:
- 📅 Weekly (Dec 5 - 2 days): ±$2.53 (±5.02%) → Range: $47.31 - $52.31
- 📅 Monthly OPEX (Dec 19 - 16 days): ±$3.10 (±6.16%) → Range: $47.69 - $54.36
- 📅 January OPEX (Jan 16 - 44 days - THIS TRADE!): ±$6.17 (±12.25%) → Range: $45.37 - $56.56
- 📅 Yearly LEAPS (Dec 2026 - 380 days): ±$29.07 (±57.75%) → Range: $21.26 - $79.40
Translation for regular folks: Options traders are pricing in a 5% move ($2.53) by Friday's weekly expiration, but a much larger 12% move ($6) through January 16th when these $52.5 calls expire. The January upper range of $56.56 means the market gives meaningful probability to BILL trading $5-6 higher over the next 6 weeks.
Key insight: The January 16th implied move of $45.37-$56.56 perfectly brackets the $52.5 strike right in the middle of the expected range. The call buyer is betting BILL trades toward the UPPER end of that range ($54-56) rather than consolidating at midpoint or declining. With Q2 earnings January 29th, M&A speculation ongoing, and activist pressure mounting, there's legitimate catalyst support for upside movement.
The LEAPS showing 57% implied move reflects massive uncertainty about BILL's future - either acquired at $65-85 (35-65% upside) or remaining independent and struggling at current levels. This binary outcome drives the wide range.
🎪 Catalysts
🔥 Immediate Catalysts (Already Happened)
Activist Investor Campaign - November 2025 🎯
Two major activist investors disclosed significant stakes and are pushing for strategic alternatives:
-
Starboard Value (8.5% stake - November 14, 2025): Disclosed 7,024,848 shares (~$372M position) and nominated four directors including firm partner Peter Feld. Criticized BILL's 9% adjusted EBITDA margin vs. peers' 29% and "Rule of 40" score of 21% vs. competitors' 40-50%. Seeking operational improvements or potential sale.
-
Elliott Management (5% stake - September 2025): Billionaire Paul Singer's $76B hedge fund acquired ~5% position, becoming second activist investor. Combined 13%+ activist ownership dramatically increases pressure for shareholder value realization.
Bloomberg M&A Exploration Report - November 11, 2025 📰
Bloomberg Law reported BILL is working with financial advisor to explore potential sale, gauging interest from strategic buyers and private equity. Stock surged 11.5% on the news. Truist analyst values BILL at $65-$85/share in transaction (29-68% premium to current $51.47), citing potential buyers like Intuit, Oracle, Salesforce, or PE firms (Vista Equity, Thoma Bravo).
Q1 FY2026 Earnings Beat - November 6, 2025 💰
BILL reported strong Q1 results:
- 💵 Total Revenue: $395.7M (+10% YoY), beating guidance
- 📊 Core Revenue: $358.0M (+14% YoY)
- 💰 Non-GAAP EPS: $0.61, beating consensus $0.51 by 19.6%
- 💳 Total Payment Volume: $89B (+12% YoY)
- 🎯 FY2026 Guidance Raised: Core revenue $1.46B-$1.49B (12-15% growth), operating margins 16-17%
- 📈 Profitability Milestone: Achieved $23.8M GAAP net income for fiscal 2025 after three years of losses
BILL AI Launch - October 28, 2025 🤖
BILL launched BILL AI, a suite of autonomous AI agents to automate AP, spend, and expense workflows. Processed over 1.3 billion documents in FY2025, with AI increasing fully automated bills by 80% since start of 2025. Management expects majority of customers using at least one BILL agent by end of FY2026, with gradual ARPU improvement driving revenue growth.
Strategic ERP Partnerships - October 2025 🤝
-
NetSuite Partnership (October 7): NetSuite and BILL announced partnership to embed BILL-powered payment automation into NetSuite Intelligent Payment Automation for US customers. NetSuite has 38,000+ customers.
-
Acumatica Partnership (October 22): Acumatica integrated BILL's AP automation into Acumatica Cloud ERP 2025 R2. Acumatica has 9,000+ customers. Embedded partnerships expand distribution without direct sales costs.
🚀 Upcoming Catalysts (Next 6 Weeks)
UBS Global Technology and AI Conference - TODAY! December 3, 2025 🎙️
BILL participates in UBS conference in Scottsdale, Arizona at 9:55 a.m. PST today. Live webcast provides near-term opportunity for management to discuss AI monetization strategy and potential M&A process updates. Watch for any commentary on sale exploration or activist discussions.
Q2 Fiscal 2026 Earnings - January 29, 2026 📊
This is THE catalyst that will determine whether these $52.5 calls pay off (expiring 13 days later on January 16... wait, that's backwards!).
CORRECTION: These January 16th calls actually expire BEFORE January 29th earnings, meaning the call buyer is positioning for:
- Pre-earnings M&A announcement (sale agreed before earnings)
- Continued M&A speculation premium keeping stock elevated
- AI monetization progress discussed at conferences
- Year-end institutional repositioning into undervalued SaaS
Key metrics to watch (for context, even though calls expire before earnings):
- 📊 Consensus Revenue: $397.8M (implied ~13% YoY growth)
- 💰 Consensus EPS: $0.35 (updated guidance: $0.54-$0.57)
- 🤖 AI agent adoption rates and ARPU contribution
- 🤝 Embedded partnership revenue impact from NetSuite/Acumatica
- 📈 2H FY2026 acceleration commentary
📊 Medium-Term Catalysts (Next 6 Months)
Potential Sale or Strategic Transaction (Next 3-6 Months) 💰
Bloomberg reported talks are "early" but combined 13%+ activist ownership from Starboard/Elliott increases likelihood of transaction. Truist values BILL at $65-$85/share (29-68% upside from current $51.47). Potential buyers include Intuit, Oracle, Salesforce, Stripe, Block, or PE firms (Vista Equity, Thoma Bravo, Francisco Partners).
Probability: Moderate (40-50%) - Exploratory discussions but no guarantee of transaction Timeline: Could announce by Q1-Q2 2026 if process moves forward
Investor Day - First Half 2026 🎯
BILL plans investor day in H1 2026 to outline long-term targets and path to "Rule of 40" (combined revenue growth + profit margin). Critical for addressing Starboard's profitability critique and validating multi-year growth thesis.
AI Monetization Ramp - Q2-Q4 FY2026 🤖
Management expects gradual AI agent monetization throughout fiscal 2026, with majority of customers using at least one agent by year-end. Could contribute 2-3 percentage points to revenue growth acceleration in 2H FY2026.
🎲 Price Targets & Probabilities
Using gamma levels, implied move data, catalysts, and M&A speculation, here are scenarios through January 16th expiration:
📈 Bull Case (35% probability)
Target: $55-$60
How we get there:
- 💰 M&A speculation intensifies - potential buyer leaks or confirmed process advances
- 📊 Positive commentary at UBS conference today signals AI monetization progress
- 🚀 Activist campaign gains momentum - board seats secured, operational improvements announced
- 📈 Year-end positioning by institutions into undervalued SaaS names
- 🤝 Embedded partnership wins announced (major NetSuite/Acumatica customer deployments)
- ✅ Analyst upgrades citing M&A optionality and AI growth acceleration
- 📉 Broader tech recovery lifts all SaaS boats, BILL breaks $55 resistance
Call P&L in Bull Case:
- Stock at $55 on Jan 16: Calls worth $2.50, loss = -$0.40/share × 9,070 = -$363K (14% loss)
- Stock at $58 on Jan 16: Calls worth $5.50, gain = +$2.60/share × 9,070 = +$2.36M (90% gain!)
- Stock at $60 on Jan 16: Calls worth $7.50, gain = +$4.60/share × 9,070 = +$4.17M (158% gain!)
Why 35% probability: Requires M&A process to advance significantly OR multiple positive catalysts to align. With talks described as "early," transaction before January 16th is unlikely, but continued speculation could keep stock bid. Activist pressure is real and increasing.
🎯 Base Case (45% probability)
Target: $50-$54 range (MODEST GAINS)
Most likely scenario:
- ⚖️ M&A exploration continues but no definitive announcement before January expiration
- 📱 AI monetization progressing steadily but not spectacularly
- 🔄 Trading within $50-$54 consolidation range established over past 3 weeks
- 💤 Market waits for Q2 earnings (January 29) and Investor Day (H1 2026) for next catalysts
- 📊 Activist campaign applies steady pressure but no dramatic near-term developments
- ✅ Conference presentations (UBS today) provide encouraging but not explosive updates
- 🎯 Stock gravitates toward $52.50 strike by expiration - right where options market expects
Call P&L in Base Case:
- Stock at $52 on Jan 16: Calls worth $0 (out-of-money), loss = -$2.90/share × 9,070 = -$2.63M (100% loss)
- Stock at $53 on Jan 16: Calls worth $0.50, loss = -$2.40/share × 9,070 = -$2.18M (83% loss)
- Stock at $54 on Jan 16: Calls worth $1.50, loss = -$1.40/share × 9,070 = -$1.27M (48% loss)
Why 45% probability: Most realistic outcome given timing. January 16th expiration comes BEFORE Q2 earnings (January 29), and M&A processes typically take 3-6 months from exploration to announcement. The call buyer is paying for optionality that M&A news accelerates OR that year-end positioning drives stock into $53-55 range. Modest gains possible but difficult for calls to fully profit without breaking $55.
📉 Bear Case (20% probability)
Target: $45-$50 (CALLS EXPIRE WORTHLESS)
What could go wrong:
- 😰 M&A exploration falters - Bloomberg reports "no interested buyers" or process stalls
- 🚨 Conference presentations disappoint - management provides cautious commentary on AI adoption
- ⏰ Q2 guidance lowered (given BEFORE January 16 expiration if management pre-announces)
- 💸 Broader tech selloff drags SaaS stocks lower - sector rotation out of software
- 📊 Activist campaign stalls - Starboard/Elliott unable to force immediate changes
- 🇨🇳 Competitive pressure or macro weakness impacts SMB customer spending
- 💰 Valuation concerns resurface - 3.43x Price/Sales still premium for 12-15% growth
- 🔨 Break below $50 psychological support triggers stop losses and momentum selling
Critical support levels:
- 🛡️ $50.00: Psychological floor - held multiple times in November/December
- 🛡️ $47.50: Deeper support from October lows - break here very bearish
- 🛡️ $45.00: Major support zone - failure sends stock toward $40
Call P&L in Bear Case:
- Stock below $52.50 on Jan 16: Calls expire worthless, loss = -$2.90/share × 9,070 = -$2.63M (100% loss)
Probability assessment: Only 20% because it requires M&A speculation to completely evaporate AND fundamentals to deteriorate. BILL's Q1 results were solid (beat on revenue and EPS), activist pressure is real (13%+ ownership), and even without sale, the business is growing 12-15% with improving margins. Would need multiple negative catalysts to push below $50.
💡 Trading Ideas
🛡️ Conservative: Wait for Post-Expiration Entry
Play: Stay on sidelines until after January 16th options expiration volatility clears
Why this works:
- ⏰ These calls expire January 16th, BEFORE January 29th earnings - creates uncertain window
- 💸 Options expensive with 12% implied move through January - better to buy stock after expiration
- 📊 M&A process timing uncertain - could take months with no guaranteed outcome
- 🎯 Better entry likely post-earnings on February 1-3 after volatility settles
- 📉 If M&A rumors fade, stock could pull back to $45-47 (10% cheaper entry)
- 🤔 Even with activist pressure, forcing change takes time - no need to rush
Action plan:
- 👀 Monitor UBS conference commentary today for any M&A or AI monetization updates
- 🎯 Watch for Q2 earnings January 29th - looking for $397M+ revenue, AI adoption metrics
- ✅ Consider stock entry on pullback to $47-49 after earnings (15-20% margin of safety vs $52.50 target)
- 📊 Monitor activist developments - board changes, strategic review announcements
- ⏰ Revisit in March 2026 after Investor Day provides long-term roadmap clarity
Risk level: Minimal (cash position) | Skill level: Beginner-friendly
Expected outcome: Avoid potential 20-40% loss if calls expire worthless. Get cleaner entry with better visibility post-earnings. Maintain optionality.
⚖️ Balanced: Mimic the Trade with Smaller Size
Play: Buy January 16, 2026 $52.5 calls but with risk-appropriate sizing
Structure: Buy $52.5 calls at current market (~$2.80-3.00 depending on entry timing)
Why this works:
- 🤝 Copying institutional positioning that showed conviction by paying up from $2.21 to $2.90
- ⏰ 44 days to expiration provides time for M&A developments or year-end rally
- 📊 Defined risk - can only lose premium paid (unlike shorting puts)
- 🎯 Strike at $52.50 only 2% above current price - not overly aggressive
- 🚀 Activist pressure (13%+ ownership) provides fundamental support for upside
- 💰 If M&A announcement comes, calls could 3-5x (from $2.90 to $10-15)
Estimated P&L:
- 💰 Entry: ~$2.90 per contract ($290 per call)
- 📈 Target exit: $5-6 if stock reaches $55-57 (70-100% gain)
- 🚀 Home run: $10-15 if M&A announced at $60-65 (240-420% gain)
- 📉 Max loss: $2.90 per contract if expires below $52.50 (100% loss)
- 🎯 Breakeven: $55.40 (stock needs to rally 7.6% from current $51.47)
Entry timing:
- ⏰ Can enter now OR wait until after UBS conference today (2pm EST) for clarity
- 🎯 Best entry if stock pulls back to $50-51 (gives better risk/reward)
- ❌ Don't chase if stock already above $53 (reduces odds of profit)
Position sizing: Risk only 2-3% of portfolio (this is speculative, not core holding). For $50K portfolio, that's 3-5 contracts maximum ($870-1,450 risk).
Exit strategy:
- 🎯 Take 50% off at 50% gain (50% gain = $4.35 calls, lock in profits early)
- 🚀 Hold remaining 50% for potential M&A announcement (home run scenario)
- ⏰ Exit by January 12-13 (3-4 days before expiration) to avoid time decay unless deeply in-the-money
- 📉 Cut losses if stock breaks below $49 (thesis broken, saves 30-40% of premium)
Risk level: Moderate (defined risk, directional speculation) | Skill level: Intermediate
Probability of profit: ~35-40% (requires stock above $55.40, but M&A speculation provides real catalyst)
🚀 Aggressive: Call Calendar Spread - Play Both Sides
Play: Sell January 16th calls, Buy March 21st calls (same strike) - bet on post-earnings move
Structure:
- Sell Jan 16 $52.5 calls at $2.90
- Buy March 21 $52.5 calls at ~$4.50 (estimated)
- Net debit: ~$1.60 per spread
Why this could work:
- 📅 Capturing time decay: Short Jan calls expire worthless if stock stays below $52.50, collect $2.90 premium
- 🎢 Positioned for earnings: March calls cover Q2 earnings (January 29) and subsequent volatility
- 💰 Lower cost: Net debit $1.60 vs. $2.90 for straight calls (45% cheaper)
- 🎯 Multiple catalysts: March expiration captures earnings, Investor Day buildup, Q3 guidance preview
- ⚖️ Less aggressive than naked calls: Selling short-dated premium reduces cost basis
Why this could blow up (SERIOUS RISKS):
- 💥 M&A announced before Jan 16: Short calls get exercised, forced to cover at loss while long calls don't compensate fully (short gamma risk)
- 🚀 Stock gaps to $60+ before January: Losses on short calls exceed gains on long calls in near-term
- 📉 Stock stays flat through March: Both legs expire worthless, lose full $1.60 debit
- ⏰ Complex timing: Need to manage both legs separately - not beginner-friendly
- 😱 Assignment risk: Short calls can be assigned early if stock rallies hard
Estimated P&L:
- 💰 Best case: Stock at $52 on Jan 16 (short calls expire worthless, collect $2.90), then rallies to $60 by March 21 (long calls worth $7.50). Net gain: $2.90 + $7.50 - $4.50 cost = $5.90 (369% gain on $1.60 debit!)
- 🎯 Good case: Stock at $54 on Jan 16 (short calls worth $1.50, buy back for small loss), then $58 by March (long calls worth $5.50). Net gain: ~$3.00 (187% gain)
- 📉 Bad case: Stock stays $50-52 through March, both legs expire worthless, lose $1.60 (100% loss)
- 💀 Worst case: Stock gaps to $60 before Jan 16 on M&A news, short calls lose $7.10 while long calls gain only ~$5, net loss $2.10 (131% loss!)
CRITICAL WARNING - DO NOT attempt unless you:
- ✅ Understand calendar spread mechanics and theta decay dynamics
- ✅ Can monitor position daily and adjust if stock moves against you
- ✅ Have approval for multi-leg spread strategies in your brokerage account
- ✅ Know how to roll or close short calls if M&A announcement comes
- ✅ Accept that this can lose MORE than initial debit in worst case (if short calls blow up)
Position sizing: Risk only 1-2% of portfolio maximum. For $50K portfolio, that's 3-5 spreads maximum ($480-800 risk).
Risk level: HIGH (short gamma risk if M&A announced) | Skill level: Advanced only
Probability of profit: ~40-45% but with asymmetric payoff - small losses possible, large gains if timed right
⚠️ Risk Factors
Don't get caught by these potential landmines:
-
⏰ Expiration BEFORE earnings creates timing mismatch: These January 16th calls expire 13 days BEFORE Q2 earnings on January 29th. The call buyer is betting on M&A news or pre-earnings positioning, NOT the earnings catalyst itself. If nothing material happens before January 16th, calls expire worthless even if earnings later beat. This is a pure speculation on M&A timing, not fundamental earnings play.
-
💸 M&A process uncertainty and extended timelines: Bloomberg reported talks are "early" - typical M&A processes take 3-6 months from exploration to announcement, often longer with strategic reviews and board approvals. Truist values BILL at $65-$85, but private equity could low-ball at $55-60 (minimal upside). Stock trades at M&A premium now - if process fails or stalls, could drop 15-20% to $42-45 quickly as speculation premium evaporates.
-
⚖️ Activist campaign could take years to force change: While Starboard (8.5%) and Elliott (5%) have meaningful ownership, forcing sale or operational overhaul typically requires 12-18 month campaigns. Board seats, proxy fights, strategic reviews all take time. The January 16th options window may be too short for activists to accomplish meaningful change. Management could resist, implement modest improvements, and drag out timeline.
-
📊 Profitability gap vs. peers remains massive: Starboard explicitly criticized BILL's 9% adjusted EBITDA margin vs. peers' 29% and "Rule of 40" score of ~21% vs. competitors' 40-50%. Even with Q1 beat, current metrics don't justify premium valuation. Without M&A, stock could drift back to $40-45 (20% downside) as growth story matures and margins compress.
-
🚨 AI monetization remains speculative and unproven: BILL AI agents launched October 28, but customer willingness to pay for AI features is unproven. Competitors like Ramp offer free AI-powered AP tools, creating pricing pressure. Management expects "gradual ARPU improvement" but hasn't quantified dollar impact. If AI doesn't drive meaningful ARPU growth by Q2 earnings (post-expiration), growth thesis weakens significantly.
-
💰 Embedded partnership revenue timing uncertain: NetSuite and Acumatica partnerships announced October 2025, but revenue contribution could be minimal in Q2 (only 1 quarter of sales effort). ERP partner sales cycles often take 6-12+ months. If partnerships contribute less than $5-10M in fiscal 2026, impact won't justify current valuation.
-
🇨🇳 Macro headwinds for SMB spending: BILL serves 498,100 small/midsize businesses who are highly sensitive to economic conditions. Q2 guidance cited "seasonality and FX volatility" impacting December quarter. If recession emerges in 2026, SMB digitization spending gets cut first. TPV growth could decelerate below 10%, compressing transaction fee revenue (78.6% of core revenue).
-
📉 Valuation still premium despite 46% YTD decline: Trading at 3.43x Price/Sales for 12-15% growth is rich compared to SaaS peers averaging 5-7x for 20%+ growth. Forward P/E of 22.73x assumes margin expansion that may not materialize if competition intensifies. Stock already down 46% YTD from $96 to $51 - further downside to $40-42 (another 20%) possible if M&A speculation fades.
-
🎯 Call strike at $52.50 requires 2% rally in 44 days just to break even: With stock at $51.47, need to reach $55.40 (7.6% rally) for calls to be profitable after paying $2.90 premium. In sideways market, time decay erodes value quickly - losing ~$0.07/day ($65 per contract daily) in final 2 weeks. Without M&A catalyst, stock likely consolidates $50-53 range, causing calls to expire worthless.
-
🔥 Extremely unusual size suggests institutional desperation or inside knowledge: Vol/OI ratios of 1.875 and 2.5 mean someone traded 187-250% of existing open interest in single day. Z-scores of 16-21 are literally off-charts unusual (happens few times per year). This level of activity either signals strong conviction based on proprietary information OR desperate repositioning by fund that made error. If it's the latter, following the trade could be value trap.
-
💔 Failed sale process downside scenario: If M&A exploration announced but buyers balk at $60-65 valuation, stock could crash to $42-45 (15-20% decline) as market realizes activists can't force sale at premium. Private equity may only offer $55-58, disappointing vs. Truist's $65-85 range. Shareholders could reject low-ball bids, leaving stock to trade on fundamentals alone (which don't justify current $51).
🎯 The Bottom Line
Real talk: Someone just repositioned $3.6 MILLION in BILL calls, paying 31% MORE ($2.90 vs $2.21) to re-establish the EXACT same position after a 66-cent rally. This isn't random - this is institutional money with strong conviction that BILL will trade materially higher by January 16th. They're willing to eat $700K in additional cost to maintain exposure.
What this trade tells us:
- 🎯 Trader believes $52.50 will be in-the-money by January 16th - implying $54-60 target (5-17% upside)
- 💰 The urgency to re-enter at higher price suggests near-term catalyst visibility (M&A announcement? Conference presentation?)
- ⚖️ Expiration BEFORE earnings (Jan 16 vs Jan 29) means they're betting on M&A speculation or year-end positioning, NOT earnings beat
- 📊 Willing to risk $2.6M+ ($2.90 × 9,070 contracts) suggests high probability conviction - not a lottery ticket trade
- ⏰ 44-day window captures UBS conference (today!), potential M&A developments, holiday position squaring
This is NOT a "buy everything" signal - it's a "pay attention to M&A catalyst" signal.
The activist angle is REAL: Combined 13%+ ownership from Starboard Value and Elliott Management creates legitimate pressure for value realization. These aren't passive investors - they force change through board seats, strategic reviews, and proxy battles. With stock down 46% YTD and trading at $65-85 takeover value, the math makes sense for acquirers.
If you own BILL:
- ✅ Hold through January 16th - M&A speculation and activist pressure provide support
- 📊 Consider trimming 25-30% if stock rallies above $55 (lock in gains, reduce risk)
- ⏰ Earnings on January 29th (after these calls expire) will be critical validation point
- 🎯 If M&A falters, re-evaluate at $47-49 support (fundamental value zone)
- 🛡️ Set mental stop at $48 to protect capital if M&A rumors evaporate
If you're watching from sidelines:
- ⏰ UBS conference today (9:55am PST) could provide near-term catalyst - watch for M&A or AI commentary
- 🎯 Consider small speculative position in Jan $52.5 calls (2-3% portfolio max) if you believe M&A timing accelerates
- 📈 Better risk/reward buying stock on pullback to $48-50 after expiration volatility clears
- 🚀 Longer-term (6-12 months), activist campaign and operational improvements could drive stock to $60-70 even without sale
- ⚠️ Current valuation (22.7x forward P/E) requires either M&A premium OR significant margin expansion - pick your thesis
If you're bearish:
- 🎯 Don't fight the activist momentum - Starboard and Elliott have 85%+ success rate forcing change
- 📊 Better opportunity to short/buy puts AFTER January 16th expiration if M&A speculation fades
- ⚠️ Risk/reward poor for bearish bets now - downside limited to $48 support, upside to $65-85 on M&A
- 📉 Watch for break below $48 - that's the trigger for cascade to $42-45 if activists fail
- ⏰ Timing is EVERYTHING: Post-earnings (Feb 1-3) offers better entry if results disappoint
Mark your calendar - Key dates:
- 📅 December 3 (TODAY) 9:55am PST - UBS Global Technology and AI Conference presentation
- 📅 December 19 - Quarterly triple witch (monthly OPEX)
- 📅 January 16, 2026 - Monthly OPEX, expiration of these $3.6M call trades
- 📅 January 29, 2026 - Q2 Fiscal 2026 earnings report (13 days AFTER call expiration!)
- 📅 February-May 2026 - Expected Investor Day to outline "Rule of 40" roadmap
- 📅 Q1-Q2 2026 - Potential M&A announcement window if process advances
Final verdict: BILL's risk/reward is increasingly attractive with 13%+ activist ownership pushing for sale at $65-85/share (29-68% upside from $51.47). The $3.6M call repositioning suggests sophisticated money sees near-term catalyst before January 16th. However, timing is uncertain - M&A processes typically take months, and these calls expire BEFORE earnings provide fundamental validation.
For risk-tolerant traders: Small speculative position in January calls (2-3% portfolio) offers asymmetric payoff if M&A accelerates. For everyone else, patience pays - wait for post-earnings clarity in February when visibility improves and volatility subsides.
The activist pressure is real, the valuation gap is real ($51 vs $65-85 takeout), but the timing is uncertain. Trade accordingly.
Disclaimer: Options trading involves substantial risk of loss and is not suitable for all investors. This analysis is for educational purposes only and not financial advice. Past performance doesn't guarantee future results. The unusually large size (16x-21x average) reflects institutional activity but does not imply the trade will be profitable or that you should follow it. M&A speculation is highly uncertain - most "exploration" discussions don't result in transactions. These calls expire BEFORE Q2 earnings, creating additional timing risk. Always do your own research and consider consulting a licensed financial advisor before trading.
About BILL Holdings, Inc.: BILL provides cloud-based SaaS solutions for financial operations, specializing in accounts payable and accounts receivable automation for small and midsize businesses, with a market cap of $5.03 billion in the Prepackaged Software industry.