CLS Unusual Options Activity: $8.1M Strike Roll + Bear Call Spread Strategy Detected
January 13, 2026 | Unusual Activity Detected
The Quick Take
Someone just deployed $8.1M in institutional capital across a sophisticated two-part strategy on Celestica (CLS) today - rolling strike exposure higher while simultaneously establishing a bear call spread. This isn't a simple directional bet; it's a nuanced position adjustment suggesting the trader expects near-term upside but is hedging against a significant move above $340 by February expiration. With Q4 earnings just 15 days away on January 28-29, this institutional repositioning demands attention.
Company Overview
Celestica Inc. (CLS) is a Toronto-based electronics manufacturing services (EMS) company that has transformed into a premier AI infrastructure play. The company operates in two segments: Advanced Technology Solutions (aerospace, defense, industrial, health tech) and Connectivity & Cloud Solutions (data center networking, servers, storage).
| Metric | Value |
|---|---|
| Market Cap | $36.2B |
| Industry | Printed Circuit Boards / EMS |
| Employees | 26,865 |
| Exchange | NYSE |
| Website | celestica.com |
Celestica has emerged as a critical supplier to hyperscalers (Amazon, Microsoft, Google, Meta) with 41% market share in high-bandwidth Ethernet switches (200G/400G/800G). The stock has surged over 200% in the past year driven by insatiable AI infrastructure demand.
The Option Flow Breakdown
What Just Happened
| Time | Symbol | Buy/Sell | Call/Put | Expiration | Premium | Strike | Volume | OI | Size | Spot Price | Option Price | Option Symbol |
|---|---|---|---|---|---|---|---|---|---|---|---|---|
| 09:59:35 | CLS | SELL | CALL | 2026-02-20 | $1.7M | $320 | 802 | 860 | 480 | $320.97 | $34.80 | CLS20260220C320 |
| 09:59:35 | CLS | BUY | CALL | 2026-02-20 | $2.2M | $330 | 1,200 | 125 | 720 | $320.97 | $31.04 | CLS20260220C330 |
| 11:58:42 | CLS | SELL | CALL | 2026-02-20 | $2.4M | $330 | 2,400 | 125 | 720 | $328.60 | $32.75 | CLS20260220C330 |
| 11:58:42 | CLS | BUY | CALL | 2026-02-20 | $1.8M | $340 | 1,400 | 78 | 600 | $328.60 | $30.30 | CLS20260220C340 |
Total Premium: $8.1M across 4 legs
What This Actually Means
Let me break this down in plain English:
Part 1 - Strike Roll (09:59:35): The trader closed out their $320 strike calls and rolled them up to $330 calls. This cost them a net $500K but repositioned their exposure higher - essentially saying "I think we're going higher than $320, let me ride that wave up to $330."
Part 2 - Bear Call Spread (11:58:42): Two hours later, the SAME trader (or someone with similar conviction) sold the $330 calls they just bought and purchased $340 calls as protection. This is a classic bear call spread - they're collecting $600K in net premium while capping their risk if CLS explodes past $340.
The Combined Picture: This trader is:
- Taking profits on their original $320 position
- Expressing a view that CLS will stay below $340 by February 20
- Willing to cap upside in exchange for premium income
- Positioning ahead of Q4 earnings (January 28-29)
Z-Score Analysis: These trades registered z-scores of 69.16, 139.12, and 100.87 - all classified as "EXTREMELY UNUSUAL." The $330 call activity at 139x the normal z-score threshold represents activity seen only a handful of times per year. This is institutional-grade positioning, not retail speculation.
Technical Setup
YTD Chart
The year-to-date chart shows CLS in a powerful uptrend, having gained over 200% in the past 52 weeks. The stock recently pulled back from its all-time high of $363.40 and is currently consolidating around the $330 level.
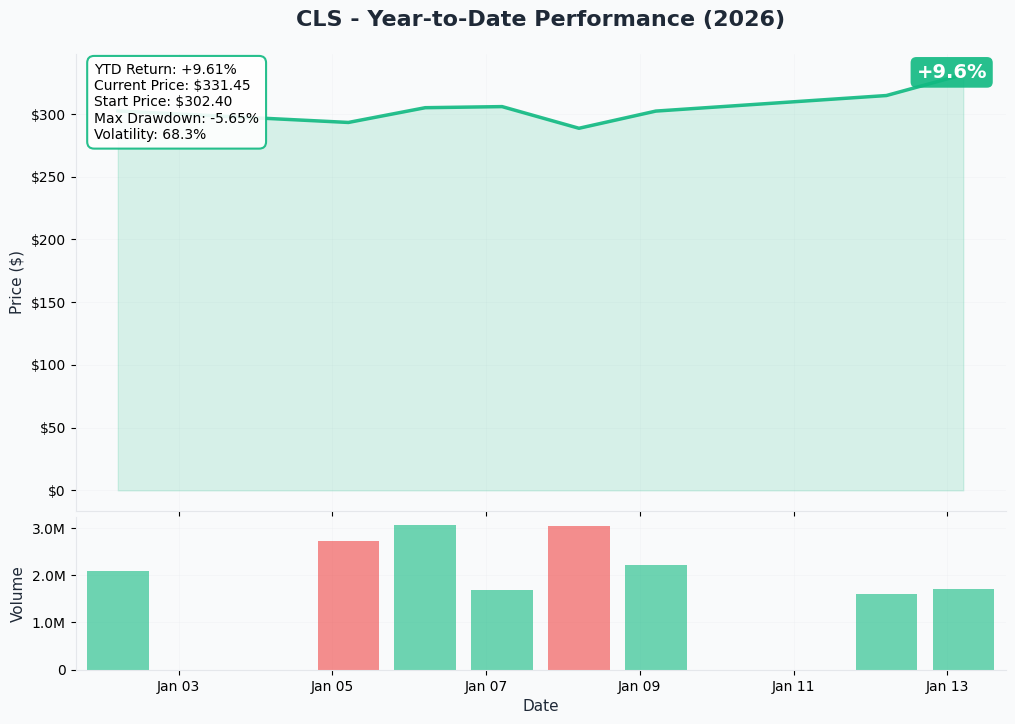
The stock gained 4.10% on January 12, rising from $302.30 to $314.70, with today's action pushing it above $330. This momentum aligns with the bullish strike roll observed in the morning session.
Gamma-Based Support & Resistance Analysis
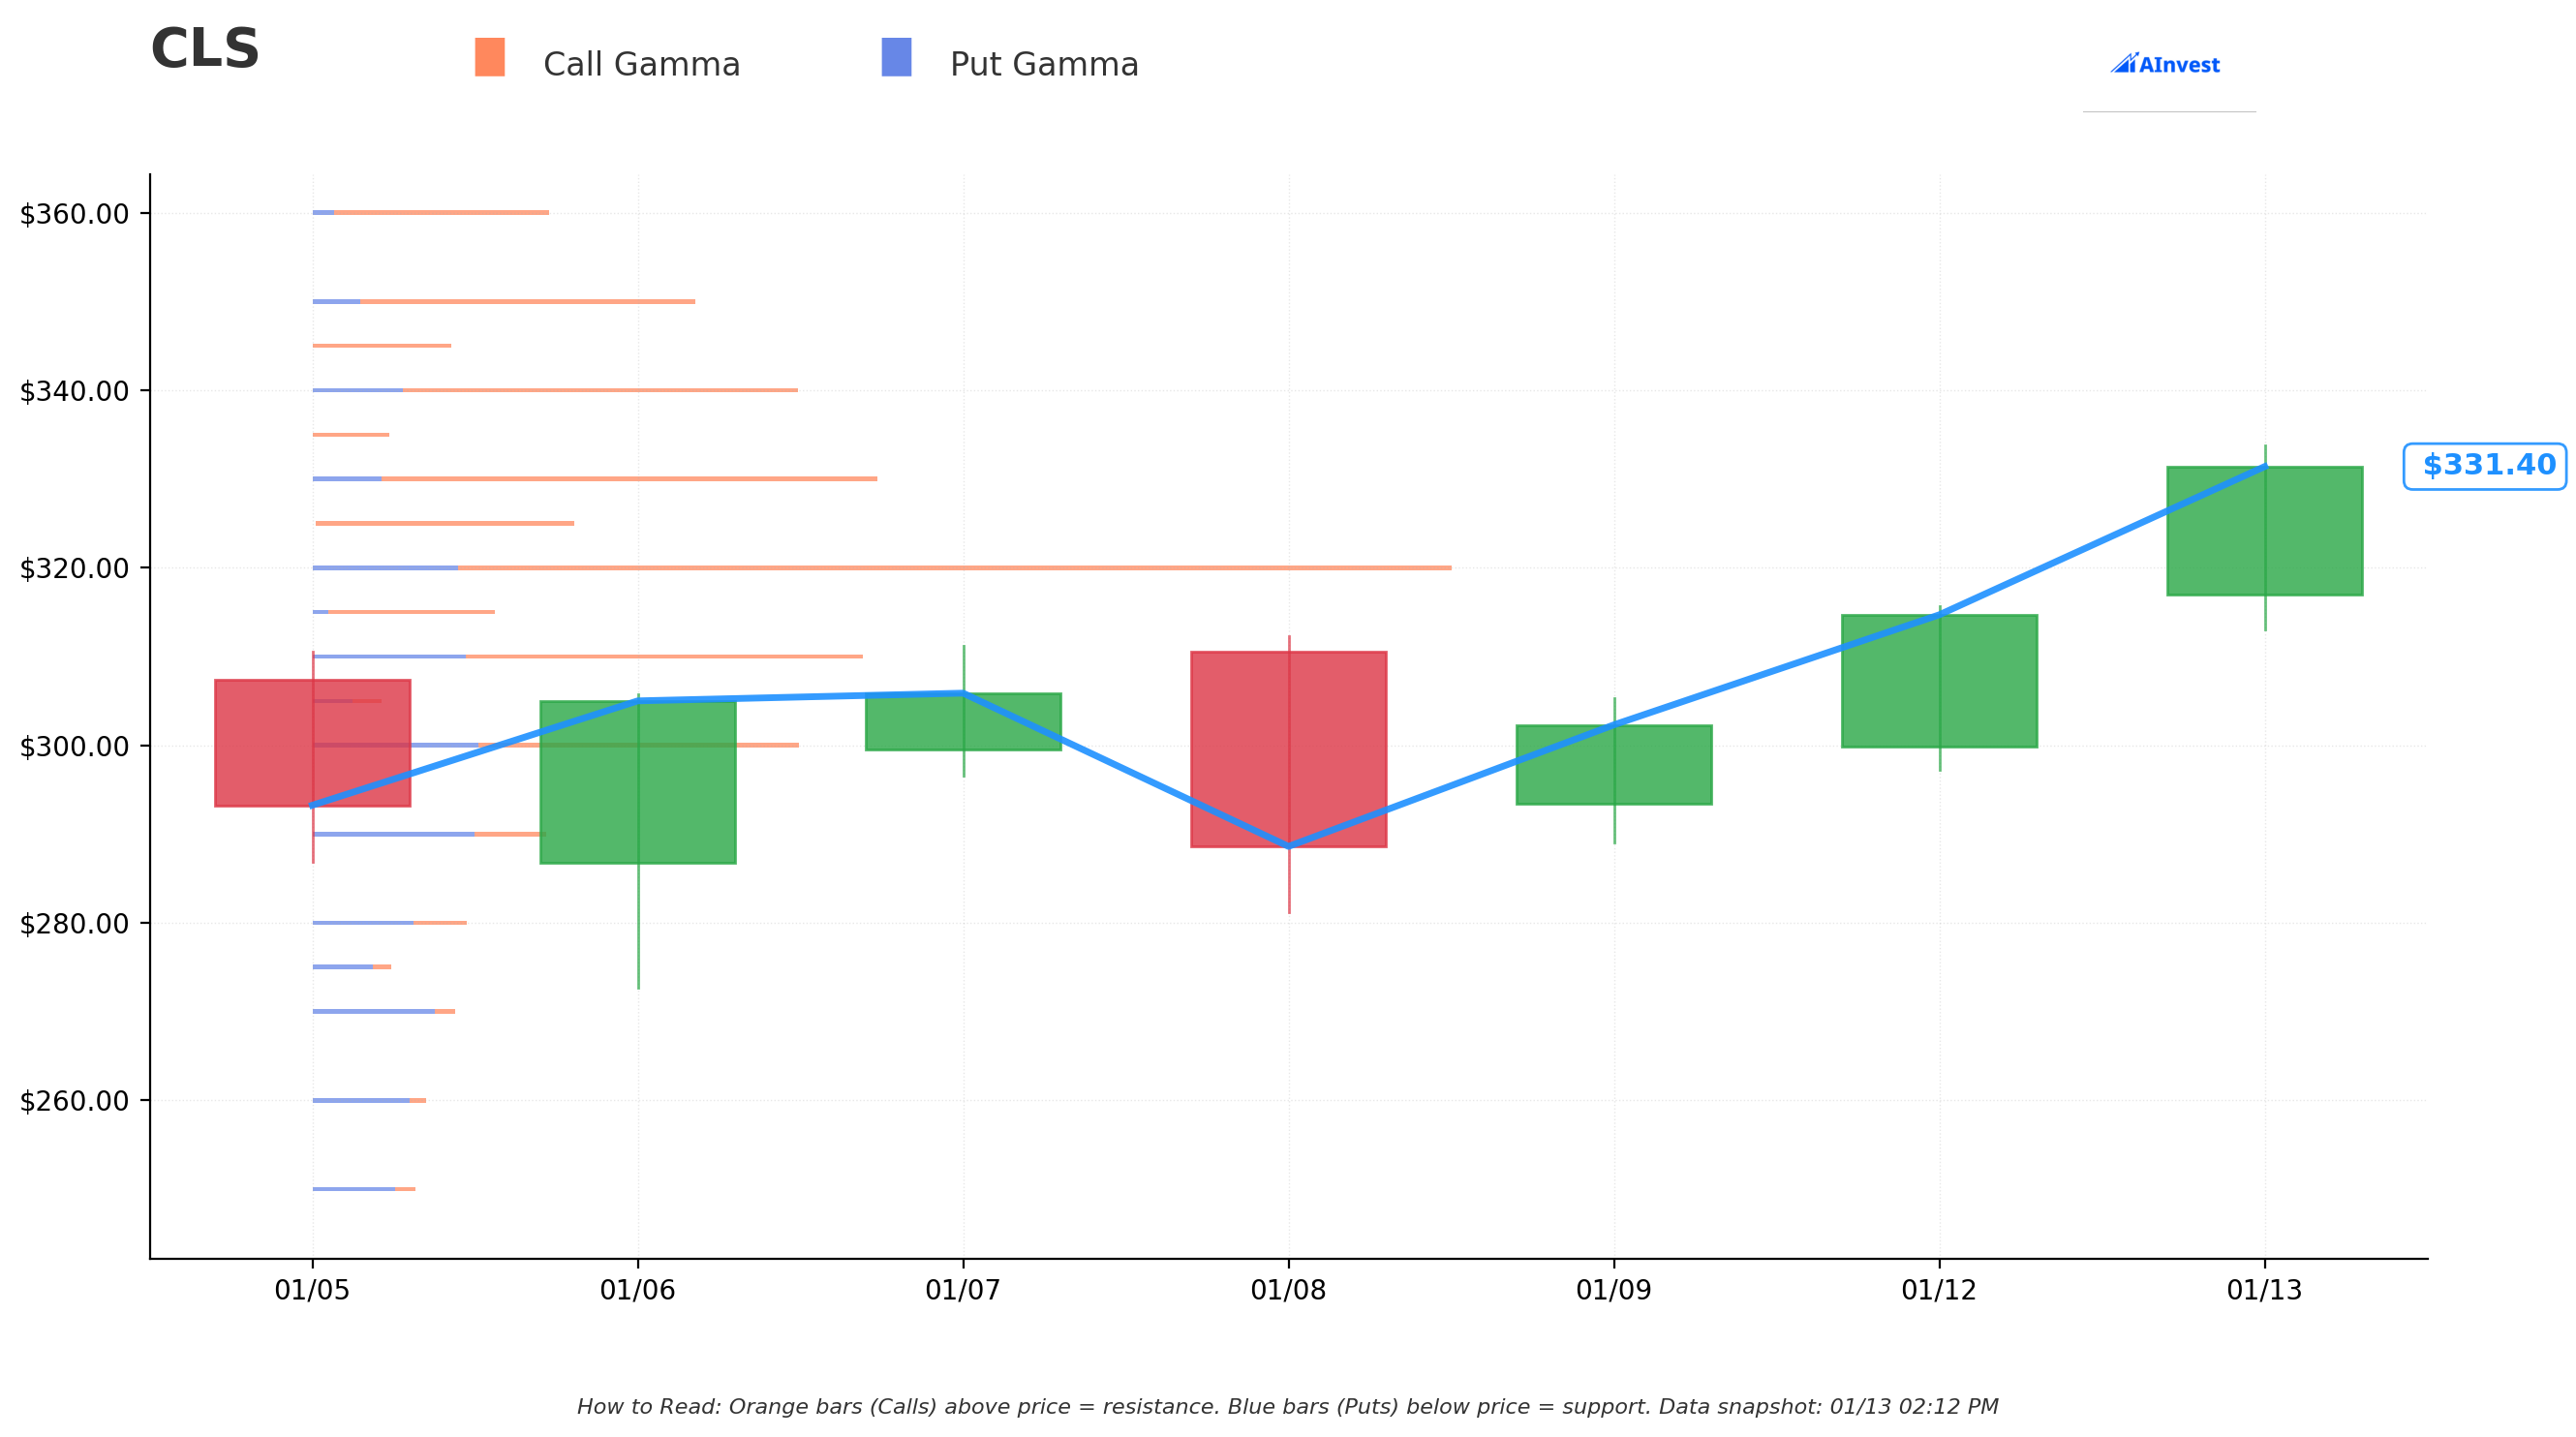
Current Price: $331.74
Key Gamma Levels:
| Level | Strike | Net GEX | Distance | Interpretation |
|---|---|---|---|---|
| Strongest Support | $320 | 1.30 | -3.5% | Major call gamma wall - heavy dealer hedging creates buying pressure on dips |
| Support | $330 | 0.67 | -0.5% | Secondary support from today's heavy call activity |
| Support | $325 | 0.39 | -2.0% | Minor gamma level |
| Strongest Resistance | $340 | 0.46 | +2.5% | First major ceiling - aligns with bear spread short strike |
| Resistance | $350 | 0.44 | +5.5% | Secondary resistance level |
Gamma Analysis: The overall GEX bias is bullish with total call gamma (8.08) significantly exceeding put gamma (3.17). This means market makers are likely to provide buying support on dips and may amplify upside moves. However, the $340 level represents meaningful resistance where dealer hedging could create selling pressure.
Implied Move Analysis
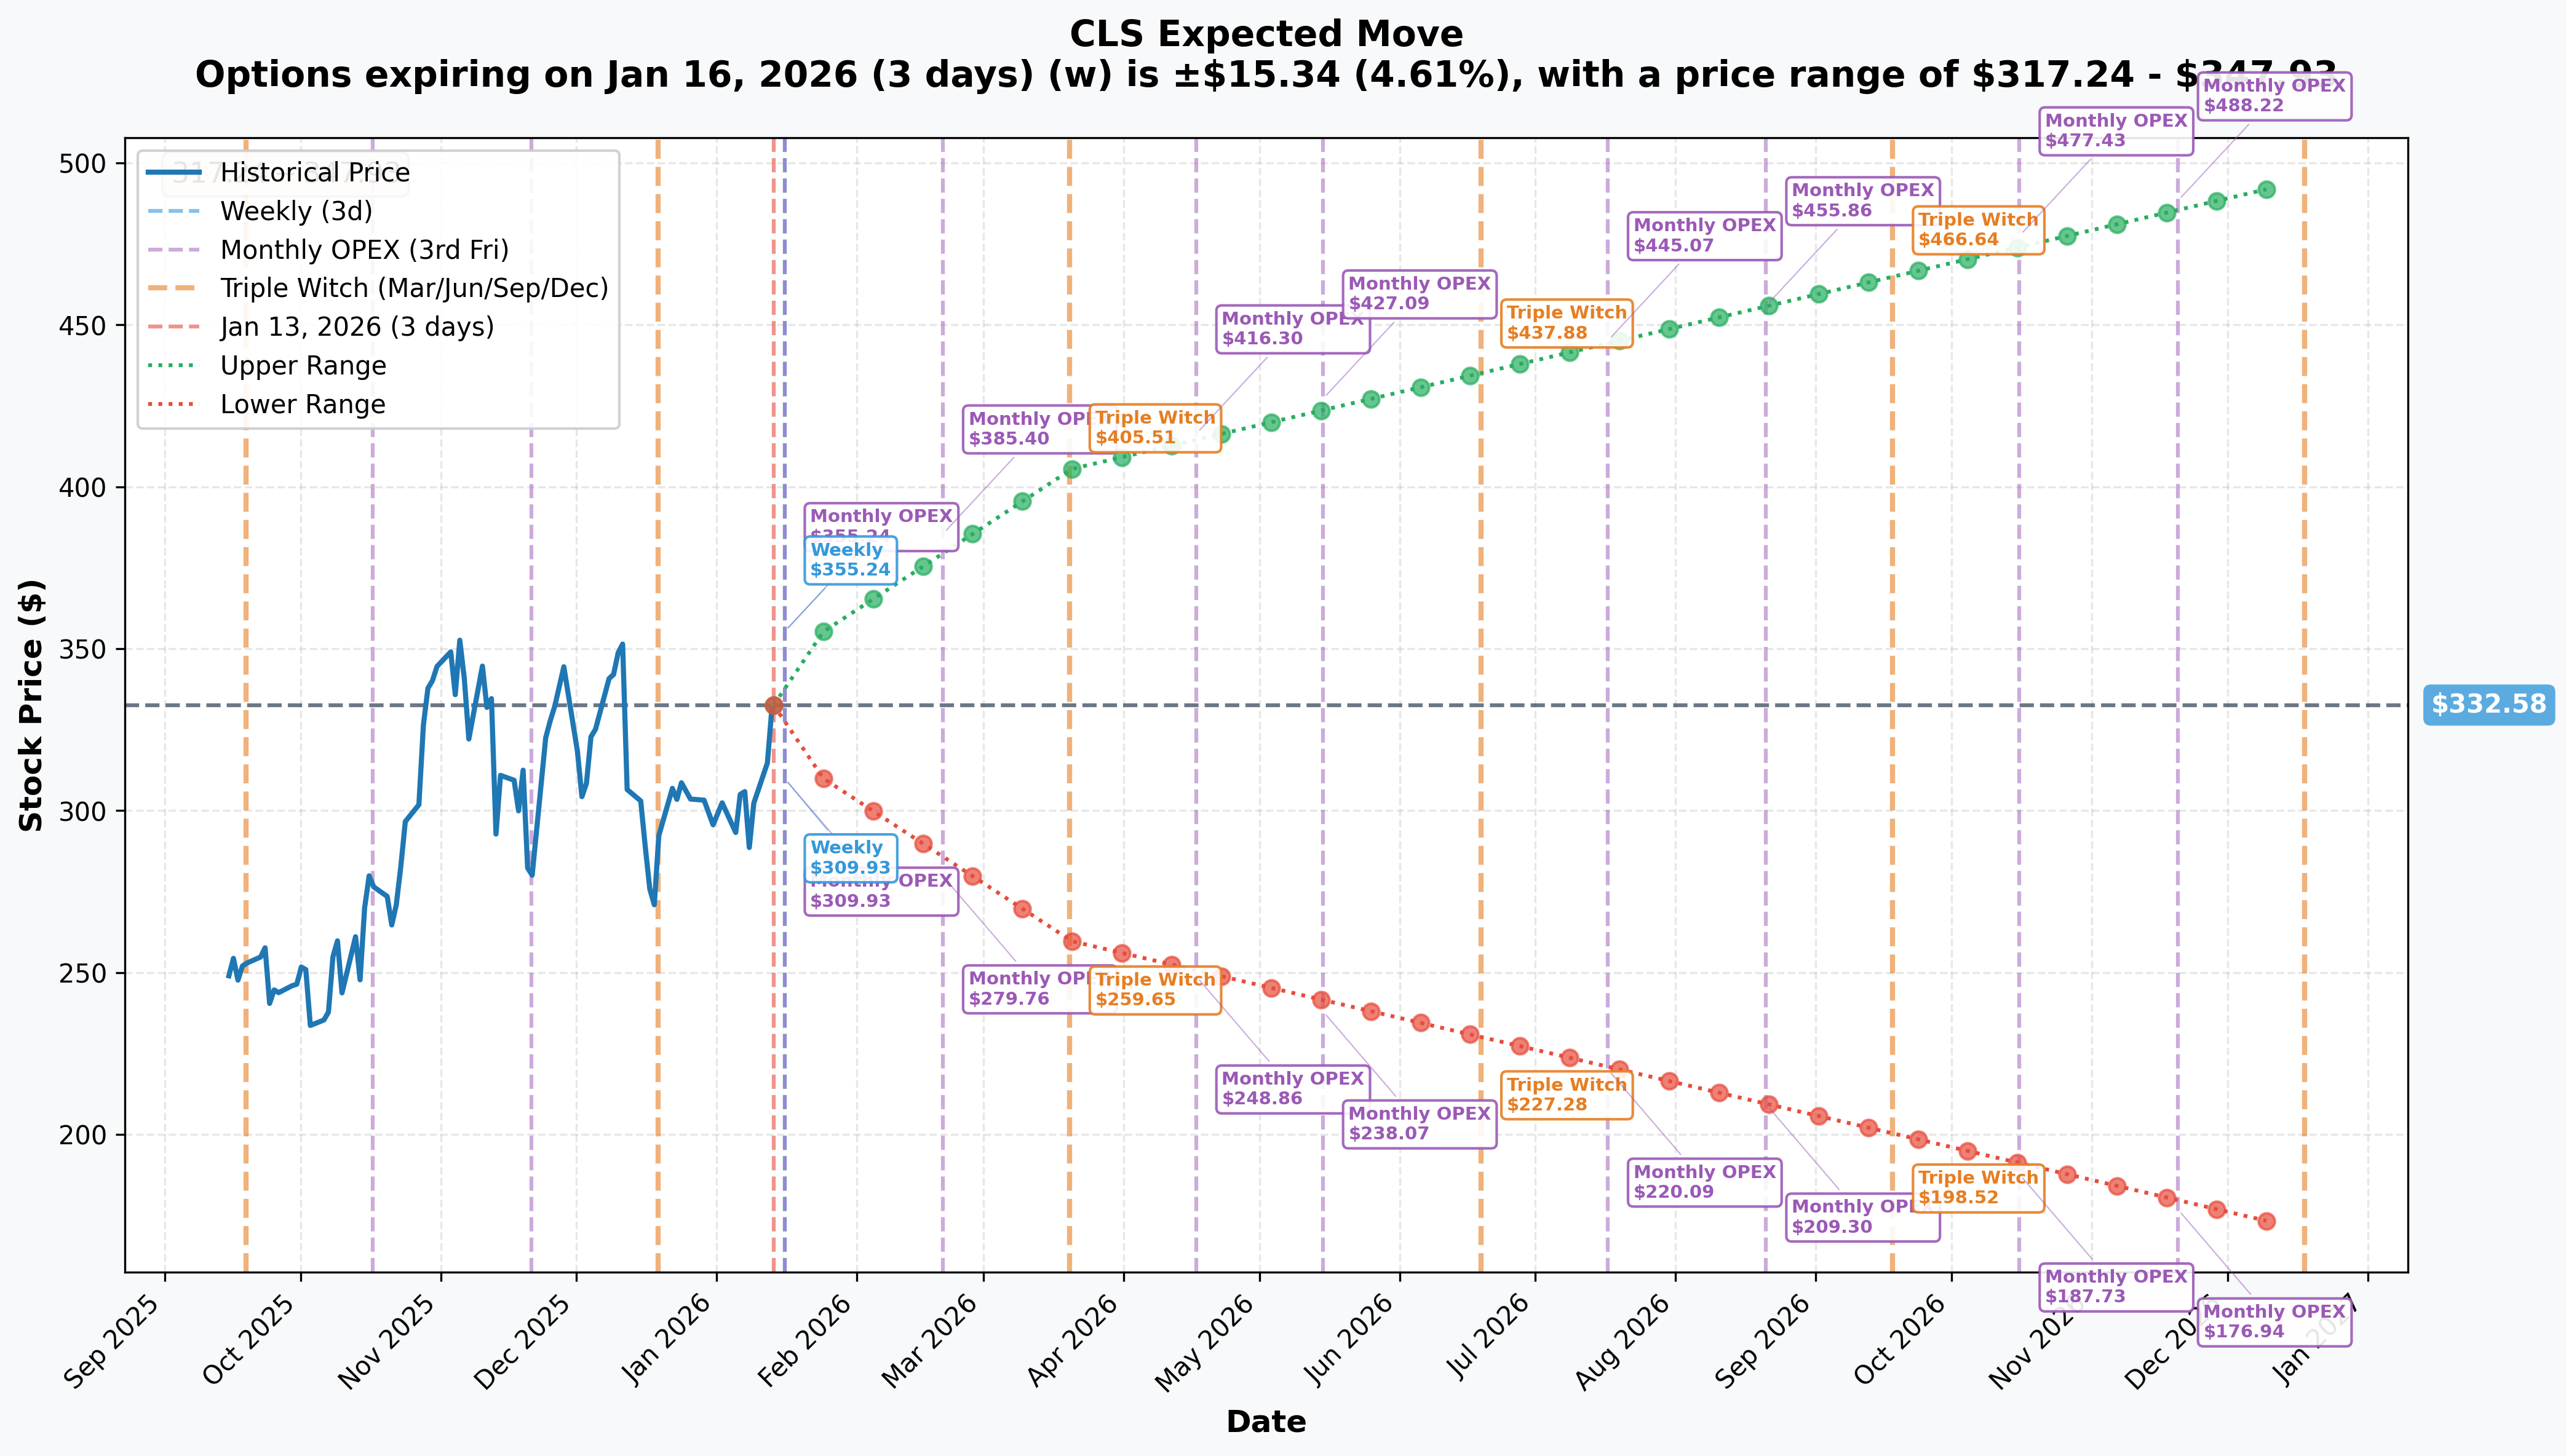
Current Price: $332.58
| Timeframe | Expiry | Days | Implied Move | Range |
|---|---|---|---|---|
| Weekly | Jan 16 | 3 | +/- 4.6% | $317.24 - $347.93 |
| Monthly (Feb OPEX) | Feb 20 | 38 | +/- 15.9% | $279.76 - $385.40 |
| Quarterly | Mar 20 | 66 | +/- 21.9% | $259.65 - $405.51 |
Key Observations:
- The February $340 resistance level sits well within the 1-sigma implied move range ($279.76 - $385.40)
- The bear call spread's $340 short strike aligns with the upper end of near-term expectations
- Quarterly implied move suggests potential to reach $405+ if Q4 earnings catalyze a breakout
Catalysts
Upcoming Catalysts
| Date | Event | Impact |
|---|---|---|
| January 28-29, 2026 | Q4 2025 Earnings | Major catalyst - consensus expects $1.76-$1.77 EPS vs $1.05 prior year (+60% YoY). TipRanks |
| Late 2026 | 1.6T Switching Program Ramp | Second 1.6T program with major hyperscaler begins production. The Motley Fool |
| Throughout 2026 | Google TPU Rack Solutions | Goldman Sachs expects CLS to be "leading provider of Google TPU rack level solutions." CNBC |
Recent Catalysts (Already Happened)
| Date | Event | Outcome |
|---|---|---|
| October 27, 2025 | Q3 2025 Earnings | Beat estimates - $3.19B revenue (+28% YoY), $1.58 adjusted EPS (+52% YoY). Stock surged 10%+ next day. Celestica Press Release |
| October 28, 2025 | Investor Day | Unveiled 2026 guidance: $16B revenue (+31%), $8.20 EPS (+39%). Investing.com |
| October 10, 2025 | 1.6TbE Switch Launch | Introduced DS6000 and DS6001 switches with 102.4Tbps capacity. Celestica Press Release |
| November 2025 | Analyst Upgrades | Goldman Sachs and Citigroup upgraded to Strong Buy. MarketBeat |
Price Targets & Probabilities
Based on gamma levels, implied move data, and catalyst analysis:
Bull Case: $360-$385 (25% probability)
- Trigger: Q4 earnings beat with raised 2026 guidance
- Support: Analyst median target of $372.50, high target $420
- Gamma: Would need to break through $340 and $350 resistance levels
- Implied Move: Upper bound of February range reaches $385.40
Base Case: $320-$340 (55% probability)
- Trigger: In-line Q4 results, guidance maintained
- Support: Strong gamma support at $320-$330, heavy call activity today
- Rationale: This aligns perfectly with the bear call spread's profit zone - trader expects CLS to stay in this range
- Implied Move: Within 1-sigma weekly move
Bear Case: $290-$310 (20% probability)
- Trigger: Earnings miss, guidance cut, or macro risk-off
- Support: Gamma support at $300-$310; put gamma increases below $290
- Risk: Customer concentration (59% from top 3 hyperscalers) creates binary earnings risk
- Implied Move: Lower bound of February range at $279.76
Trading Ideas
Conservative: "The Income Collector"
Strategy: Sell Feb 20 $350/$360 Bear Call Spread
- Sell $350 Call, Buy $360 Call
- Max Profit: ~$2.50/spread ($250 per contract)
- Max Loss: $7.50/spread ($750 per contract)
- Breakeven: $352.50
- Why This Works: Collect premium while the stock consolidates. $350 is well above gamma resistance at $340 and outside the likely trading range. Even if earnings pop the stock, you're protected above $360.
Balanced: "Following the Whale"
Strategy: Feb 20 $325/$335 Bull Call Spread
- Buy $325 Call, Sell $335 Call
- Cost: ~$5.00/spread ($500 per contract)
- Max Profit: ~$5.00/spread ($500 per contract)
- Breakeven: $330
- Why This Works: Mirrors the institutional strike roll logic - positioning for the stock to hold above $325 into earnings. You profit from the same gamma dynamics the whale is exploiting.
Aggressive: "Earnings Momentum Play"
Strategy: Buy Feb 20 $340 Calls
- Cost: ~$30/contract ($3,000 per contract)
- Profit Potential: Unlimited above $370
- Risk: Full premium loss if CLS stays below $340
- Why This Works: If Q4 earnings beat and 2026 guidance raises (like Q3 did), this stock could gap through $340 resistance. High risk, high reward - only for traders who can afford to lose the premium.
Risk Factors
Valuation Risk: Trading at ~50x trailing earnings and ~40x forward P/E. Any earnings miss could trigger meaningful multiple compression. The stock prices in near-perfect execution. Stock Analysis
Customer Concentration: Three hyperscaler customers represent 59% of Q3 2025 revenue. If any major customer reduces AI capex spending, CLS would be disproportionately impacted. BeyondSPX
Earnings Binary Event: Q4 results on January 28-29 create significant event risk. The option market implies a +/- 15.9% move by February OPEX - that's a potential $50 swing from current levels.
Competition: Foxconn holds ~72% EMS market share and aggressive pricing is common in the industry. Margin pressure remains a persistent risk. Nasdaq
Geopolitical/Trade Risk: Significant China manufacturing exposure creates tariff and supply chain risks. Finimize
The Bottom Line
Real talk: An institution just deployed $8.1M in a sophisticated strike roll + bear call spread combination on CLS. Here's what that tells us:
If You Own CLS:
- The whale's positioning suggests confidence in the $320-$340 range holding through February earnings
- Consider selling covered calls at $350+ to generate income while you wait
- Mark your calendar for January 28-29 (Q4 earnings) - this is the make-or-break event
If You're Watching:
- Wait for a pullback to the $320-$325 gamma support zone for entry
- The institutional activity suggests smart money expects consolidation, not explosion
- Consider bull put spreads below $320 to collect premium while defining risk
If You're Bearish:
- The bear call spread portion of today's flow supports your thesis somewhat
- However, gamma dynamics favor bulls with 2.5x more call gamma than put gamma
- Short positions face significant risk heading into what's expected to be another blowout quarter
Key Lesson: When you see institutional traders rolling strikes higher while simultaneously establishing bear spreads, they're telling you something - they expect upside, but with limits. The $340 level is their line in the sand. Trade accordingly.
Learn more about CLS: Ainvest Ticker Page
Disclaimer: This analysis is for informational purposes only and does not constitute investment advice. Options trading involves substantial risk and is not suitable for all investors. Past performance is not indicative of future results. Always conduct your own due diligence and consult with a financial advisor before making investment decisions.