📅 January 14, 2026 | 🔥 Unusual Activity Detected
🎯 The Quick Take
Someone just closed out a $1.9 MILLION call position in Compass Inc (COMP) - that's 137,000 contracts at the $12 strike expiring in just 2 days! This is a "Buy to Close" trade with extremely unusual volume - this kind of activity happens maybe a few times per year. Translation: A whale is locking in profits after COMP's 120% run and the just-completed Anywhere Real Estate mega-merger.
💰 The Option Flow Breakdown
📊 What Just Happened
| Time | Symbol | Buy/Sell | Call/Put | Expiration | Premium | Strike | Volume | OI | Size | Spot Price | Option Price | Option Symbol |
|---|---|---|---|---|---|---|---|---|---|---|---|---|
| 12:02:57 | COMP | BUY | CALL | 2026-01-16 | $1.9M | $12 | 137,000 | 6 | 64,677 | $12.09 | $0.30 | COMP20260116C12 |
Key Stats:
- 🔥 Volume/OI Ratio: 22,833x (HIGH ACTIVITY)
- 🏷️ Strategy: Close Long Call (exiting a bullish position)
- ⏰ Time to Expiry: 2 days
🤓 What This Actually Means
Real talk: This is a profit-taking trade, not a new bet. Someone rode COMP's incredible run from the $5-6 range to today's $12+ levels and is now cashing out before Friday's expiration.
The $12 strike is nearly at-the-money (COMP trading at $12.07), so this trader is closing a position that was likely opened months ago when COMP was much lower. With the Anywhere merger completed on January 9, 2026, the catalyst has played out.
Why close now?
- 🎯 The merger is done - the "buy the rumor" phase is over
- 📅 Only 2 days until expiration - time to take profits
- 💰 Stock up 120%+ over 12 months - plenty of gains to lock in
📈 Technical Setup / Chart Check-Up
🖼️ YTD Chart
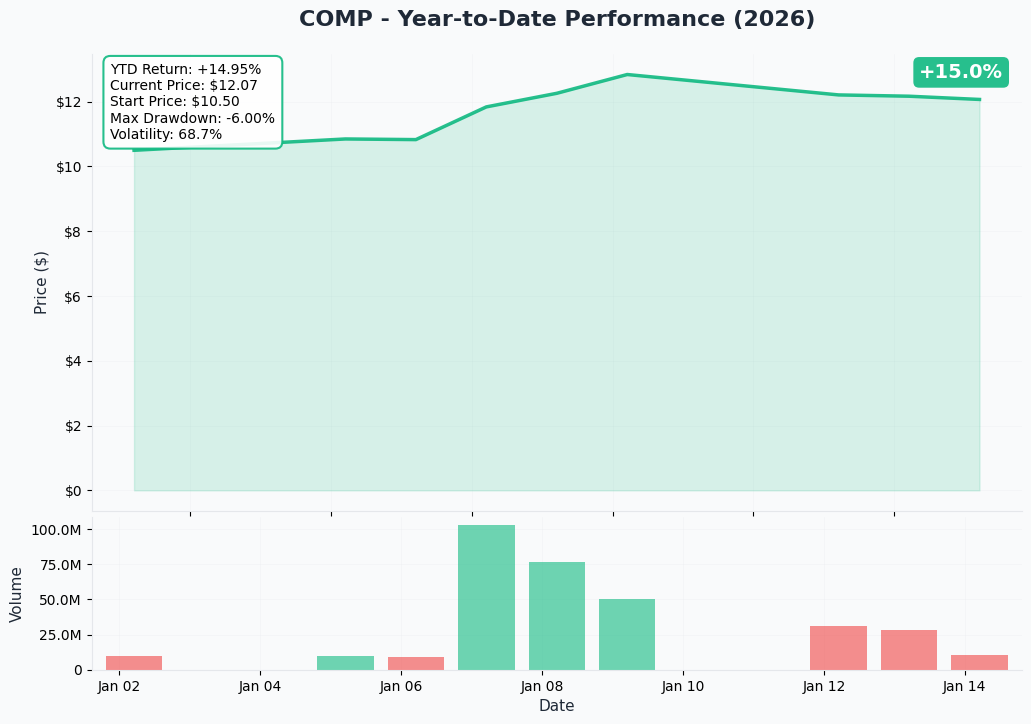
COMP has been on a tear! The stock surged from around $5.10 at its 52-week low to a high of $13.53, with the recent surge coming from the Anywhere Real Estate merger approval on January 7, 2026 when shares jumped 12.93% in a single day.
Current Trading Range:
- 📍 Current Price: $12.07
- 📈 52-Week High: $13.53
- 📉 52-Week Low: $5.10
- 🎯 1-Year Return: +120.46%
🧲 Gamma-Based Support & Resistance Analysis
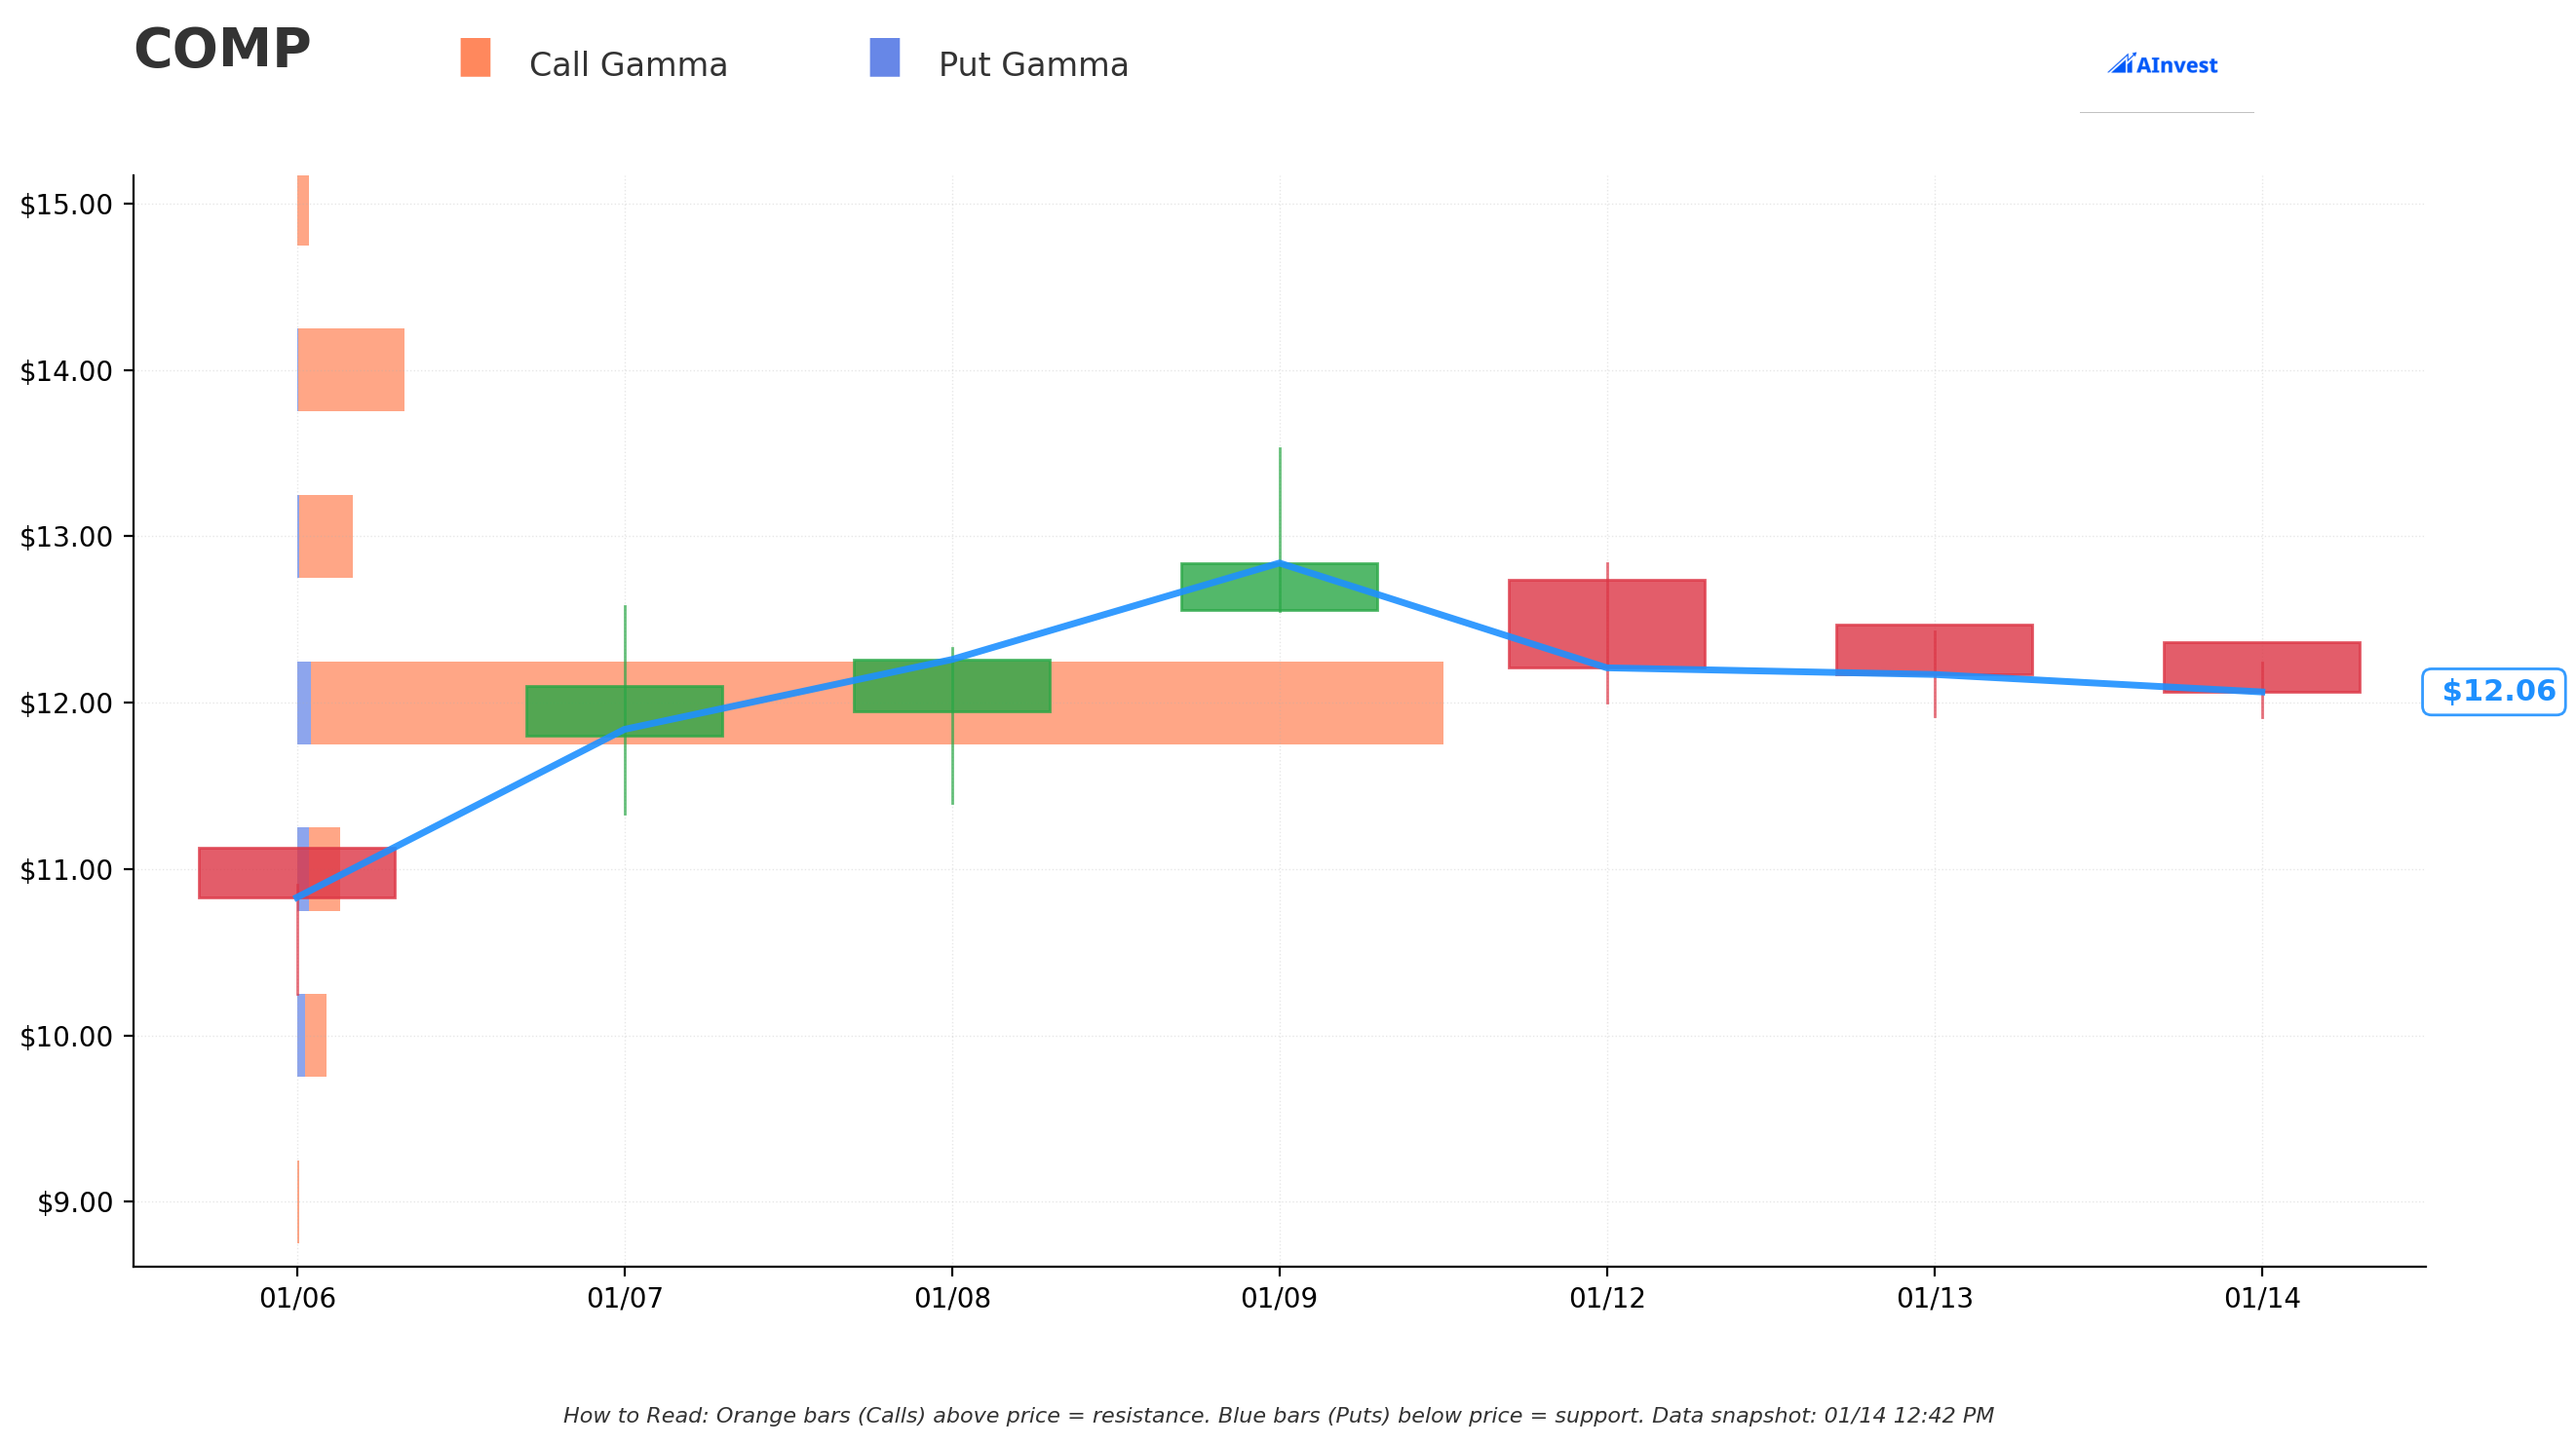
Based on the gamma exposure data, here's what market makers are telling us about key price levels:
Support Levels (Where Buying Pressure Lives):
- 🔵 $12.00 - MEGA SUPPORT - Net GEX of 92.3, by far the strongest level. This is where options activity says "floor." Only 0.6% below current price.
- 🔵 $11.00 - Secondary support with Net GEX of 1.7 (8.9% below)
- 🔵 $10.00 - Backstop support at Net GEX of 1.1 (17.1% below)
Resistance Levels (Where Selling Pressure Lives):
- 🟠 $13.00 - PRIMARY RESISTANCE - Net GEX of 4.3 (7.7% above current price)
- 🟠 $14.00 - SECONDARY RESISTANCE - Net GEX of 8.9 (16% above)
The Takeaway: The massive gamma at $12 acts like a magnet keeping the stock anchored here. To break higher, COMP needs to punch through $13, but the real resistance wall is at $14.
Net GEX Bias: BULLISH 📈 (Total Call GEX: 114.7 vs Put GEX: 3.3)
📐 Implied Move Analysis
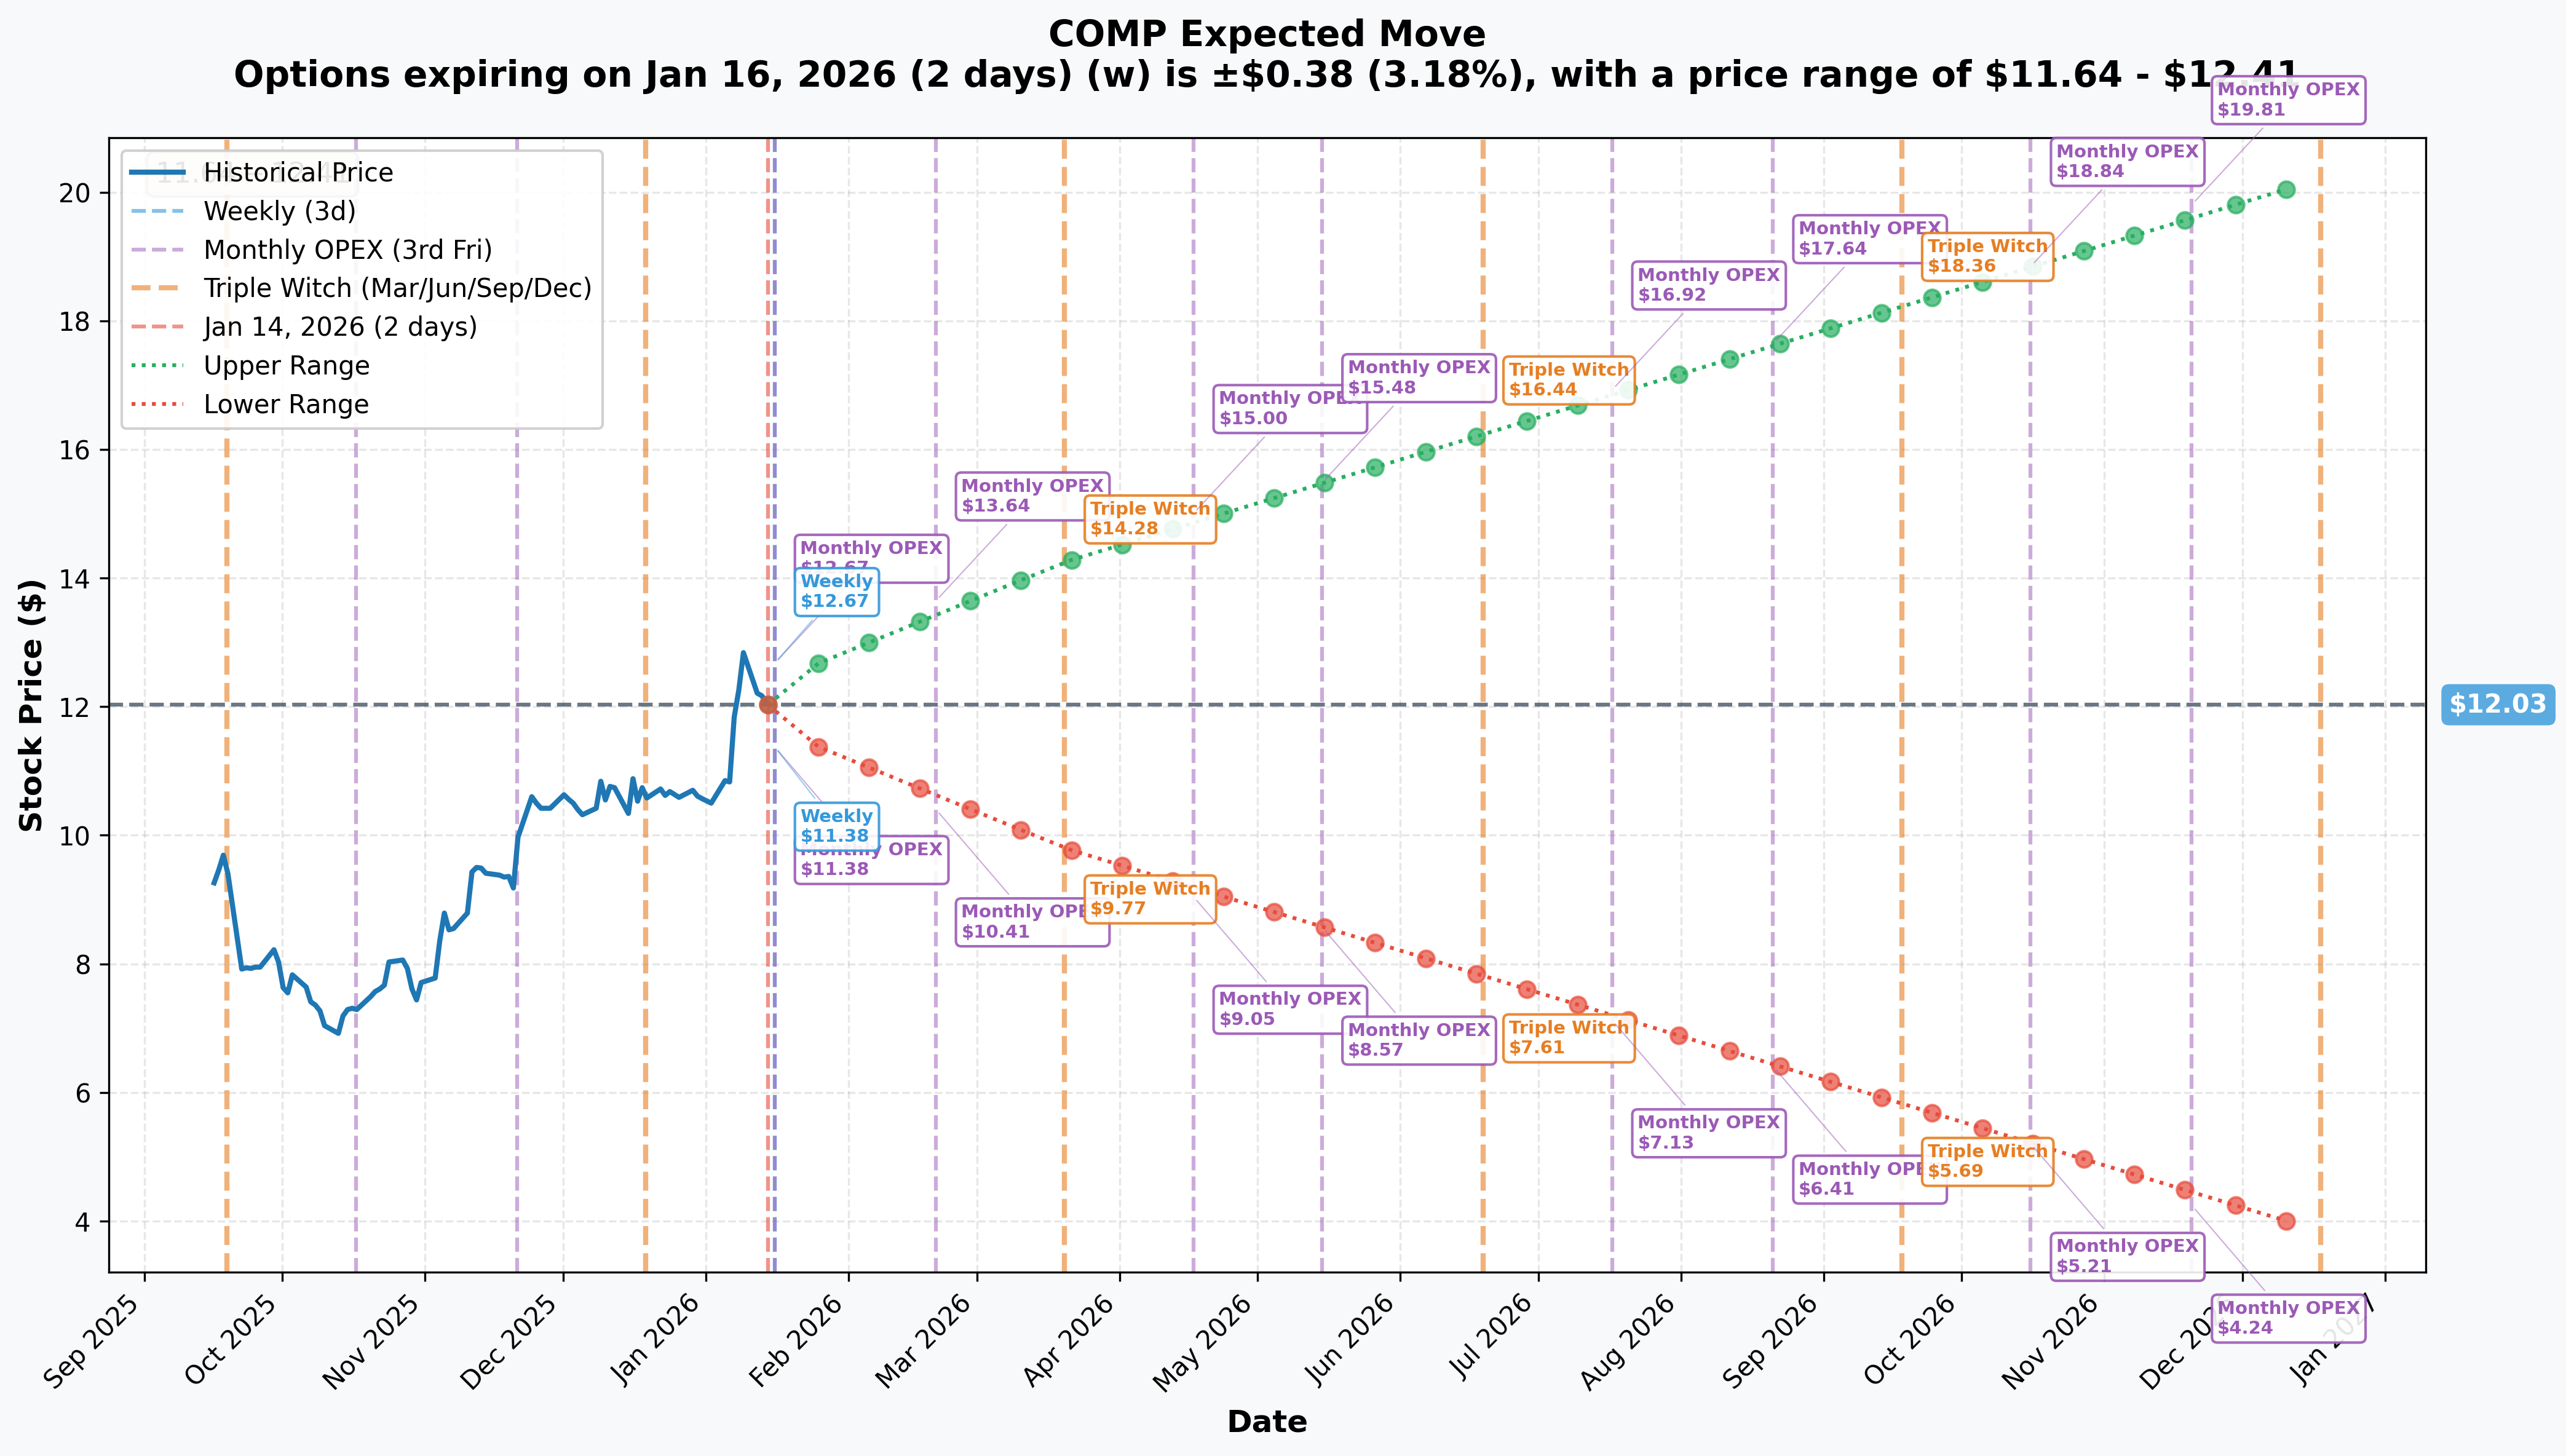
Here's what options pricing tells us about expected moves:
| Timeframe | Days | Implied Move | Expected Range |
|---|---|---|---|
| Weekly (Jan 16) | 2 | ±3.18% | $11.64 - $12.41 |
| Quarterly (Mar 20) | 65 | ±18.56% | $9.79 - $14.26 |
| Yearly LEAPS (Dec 18) | 338 | ±68.15% | $3.83 - $20.22 |
IV Skew Alert: Put IV (75.31%) is significantly higher than Call IV (46.87%) for the weekly expiration. This 28% skew tells us traders are paying up for downside protection - smart money is hedging after the big run.
Current IV: 61% for weeklies, 66% for March expiration - options are moderately expensive.
🎪 Catalysts
✅ Past Catalysts (Already Happened)
- 📊 Q3 2025 Earnings (October 2025): Crushed it! Revenue of $1.85B beat by 3.2%, Adjusted EBITDA up 80% YoY
- 🤝 Anywhere Real Estate Merger (January 9, 2026): Deal closed - COMP now has 340,000+ agents
- 📈 Shareholder Approval (January 7, 2026): 99% Compass votes, 72% Anywhere votes approved - stock jumped 12.93%
- 💰 $850M Convertible Notes (January 8, 2026): Upsized offering priced at conversion price of $15.98
- ⭐ Analyst Upgrades: BTIG raised to $15, Barclays upgraded to Overweight
📅 Upcoming Catalysts (Mark Your Calendar!)
- 📊 Q4 2025 Earnings: March 3, 2026 - First post-merger results! Guidance: Revenue $1.59B-$1.69B, EBITDA $35M-$49M
- 🏗️ Integration Synergies: Throughout 2026 - CEO targeting $300M+ in cost savings
- ⚖️ Zillow Antitrust Lawsuit: Ongoing - Compass suing Zillow over listing policies
🎲 Price Targets & Probabilities
Based on gamma levels, implied moves, and catalysts:
🐻 Bear Case: $10.00 (-17%)
- Probability: 15%
- Why: Integration fumbles, mortgage rates stay elevated, housing market weakens beyond expectations
- Support: Third gamma level at $10 (Net GEX: 1.1)
📊 Base Case: $11.50 - $12.50 (-4.7% to +3.6%)
- Probability: 55%
- Why: Stock consolidates after massive run, digests merger news, trades within weekly implied move range
- Key Level: $12 mega-support acts as gravitational center
🚀 Bull Case: $14.00 - $15.00 (+16% to +24%)
- Probability: 30%
- Why: Successful integration news, Q4 earnings beat, analyst target upgrades (BTIG at $15, average PT $11.50)
- Resistance: Must clear $13 gamma wall first, then $14
💡 Trading Ideas
🛡️ Conservative: "Sleep Well After the Party"
Trade: Sell Cash-Secured Put at $11 strike, February 21 expiration
Details:
- Sell COMP 2026-02-21 $11 Put
- Estimated Premium: ~$0.40-0.50/contract
- Breakeven: $10.50-10.60
- Max Return: ~4% on capital in 38 days
Why This Works: You get paid to potentially buy COMP at a 9% discount. The $11 level sits at second gamma support, and you're protected by the massive $12 floor. If assigned, you own a leading real estate tech company after a transformational merger.
Who It's For: Premium collectors who are bullish long-term but want a margin of safety after the big run.
⚖️ Balanced: "March Madness Bull Spread"
Trade: Call Debit Spread targeting Q4 earnings
Details:
- Buy COMP 2026-03-20 $12 Call
- Sell COMP 2026-03-20 $14 Call
- Estimated Cost: ~$0.80-1.00/spread
- Max Profit: ~$1.00-1.20 (100-120% return)
- Breakeven: ~$12.90
Why This Works: You capture Q4 earnings (March 3) and any integration synergy announcements. The $14 target matches the secondary gamma resistance and is below the convertible note conversion price of $15.98. Defined risk, capped reward.
Who It's For: Swing traders who see the post-merger story playing out over the next 2 months.
🚀 Aggressive: "BTIG's Best Friend"
Trade: Buy Calls Targeting Analyst Price Target
Details:
- Buy COMP 2026-06-19 $14 Call
- Estimated Cost: ~$1.00-1.20/contract
- Profit Target: $15 (BTIG price target)
- Risk: 100% of premium
Why This Works: If synergies exceed expectations and housing stabilizes as Compass predicts for 2026, COMP could retest highs. Gives you time for multiple catalysts (Q4 earnings, Q1 integration updates, spring selling season).
Who It's For: YOLO traders who believe in the mega-merger thesis and want asymmetric upside.
⚠️ Risk Factors
🔴 Integration Risk
Migrating 340,000 agents from ERA, Century 21, Coldwell Banker to Compass One platform is a multi-year undertaking. Technology hiccups could disrupt agent productivity.
🔴 Debt Load
COMP assumed ~$2.6B in Anywhere debt. Combined enterprise value is ~$10B including debt. The company remains GAAP unprofitable.
🔴 Mortgage Rate Environment
30-year rates expected to average 6.4% in 2026. Elevated rates continue constraining transaction volumes nationwide.
🔴 Legal Exposure
The Zillow antitrust lawsuit could reshape listing policies. Plus, senators urged DOJ/FTC scrutiny of the Anywhere deal for market share concerns.
🔴 Post-Catalyst Drift
The merger is complete. Shareholders voted. The big move happened. Stock could drift sideways as it digests the news - that's what the whale closing the $1.9M position seems to be betting on.
🎯 The Bottom Line
Real talk: This $1.9M position close isn't bearish - it's smart profit-taking after a 120%+ run. The trader rode the merger wave and is locking in gains with 2 days until expiration.
Here's Your Action Plan:
✅ If You Own It: Consider taking some profits or selling covered calls at $13-14 to generate income. The easy money from the merger announcement has been made.
👀 If You're Watching: Wait for consolidation around $12 support. A pullback toward $11 would be a better entry than chasing at 52-week highs.
🐻 If You're Bearish: The gamma structure suggests $12 is a strong floor. Betting on a collapse below $11 requires a thesis on integration failure or macro deterioration.
The Big Picture: Compass just became the largest residential real estate brokerage in America. The $300M+ synergy target and 340,000 agent network are real competitive advantages. But execution risk is substantial, and the stock has already priced in a lot of good news.
Mark Your Calendar: Q4 earnings on March 3, 2026 will be the first real test of the combined company. That's your next major catalyst.
📊 Company Snapshot
| Metric | Value |
|---|---|
| Company | Compass Inc |
| Industry | Services - Computer Programming Services |
| Market Cap | $8.81B |
| Business | End-to-end platform for residential real estate agents |
| Agents | 340,000+ (post-merger) |
| 52-Week Range | $5.10 - $13.53 |
Disclaimer: This analysis is for educational purposes only and should not be considered financial advice. Options trading involves substantial risk and is not appropriate for all investors. Past performance does not guarantee future results. Always do your own research and consider consulting a financial advisor before making investment decisions.