🎰 CRS Call Selling Blitz - $8.3M Bearish Bet Before Earnings! 💰
📅 October 22, 2025 | 🔥 Unusual Activity Detected
🎯 The Quick Take
Someone just dumped $8.3M in call premium on Carpenter Technology right before tomorrow's earnings! This massive seller is betting CRS won't blast past $290-$340 through March 2026. Translation: Smart money is capping their upside and taking profits ahead of the Q1 report!
📊 Company Overview
Carpenter Technology Corporation (CRS) is a leading specialty metals producer with:
- Market Cap: $12.05-12.41 Billion
- Industry: Steel Works, Blast Furnaces & Rolling Mills
- Primary Business: Supplies specialty alloys including titanium, nickel, cobalt, and stainless steels to aerospace, defense, medical, energy markets
- Recent Momentum: Up 56% year-over-year, reaching $290.84 all-time high in July 2025
📊 The Option Flow Breakdown
The Tape (October 22, 2025 @ 15:16:10):
| Time | Symbol | Side | Buy/Sell | Type | Expiration | Premium | Strike | Volume | OI | Size | Spot | Option Price |
|---|---|---|---|---|---|---|---|---|---|---|---|---|
| 15:16:10 | CRS | MID | SELL | CALL | 2026-03-20 | $6.1M | $290 | 4.5K | 157 | 4,500 | $244.33 | $13.50 |
| 15:16:10 | CRS | MID | SELL | CALL | 2026-03-20 | $2.2M | $340 | 4.5K | 8 | 4,500 | $244.33 | $4.85 |
Total Premium Collected: $18.35 per contract × 4,500 = $8.3M total
🤓 What This Actually Means
This is a dual strike call selling strategy - someone's betting against explosive upside! The trader:
- Collects $6.1M premium selling $290 calls (19% above current price)
- Pockets another $2.2M selling $340 calls (39% above current)
- Profits if CRS stays below these strikes through March 20, 2026
- Maximum loss is UNLIMITED if CRS explodes higher (likely covered position)
Unusual Score: VOLCANIC! (1,056x average size) - This is a few times a year event!
Timing: The March 20, 2026 expiration captures Q1 and Q2 earnings reports, suggesting this is long-term positioning by someone who owns the stock.
📈 Technical Setup / Chart Analysis
YTD Performance Chart
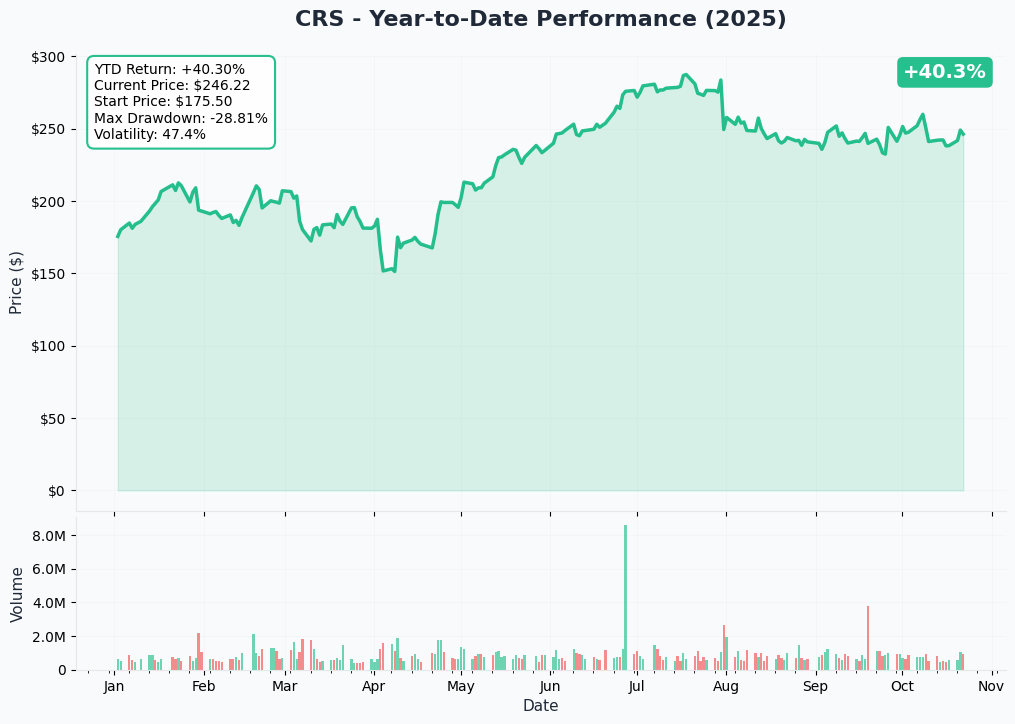
Carpenter Technology is absolutely crushing it this year with +56% YTD performance! Starting from $175.50 in January, CRS has been on a tear.
Key observations:
- Strong uptrend: Climbed from $175 to $290.84 all-time high in July 2025
- Pullback phase: Corrected from $290 peak to current $244 levels
- High volatility: 47.4% implied volatility signals big moves expected
- Max drawdown: -28.8% from July peak shows some consolidation
- Volume spikes: October seeing increased institutional activity ahead of earnings
The chart shows a stock that's had a monster run but is now consolidating before tomorrow's earnings catalyst!
Gamma-Based Support & Resistance Analysis
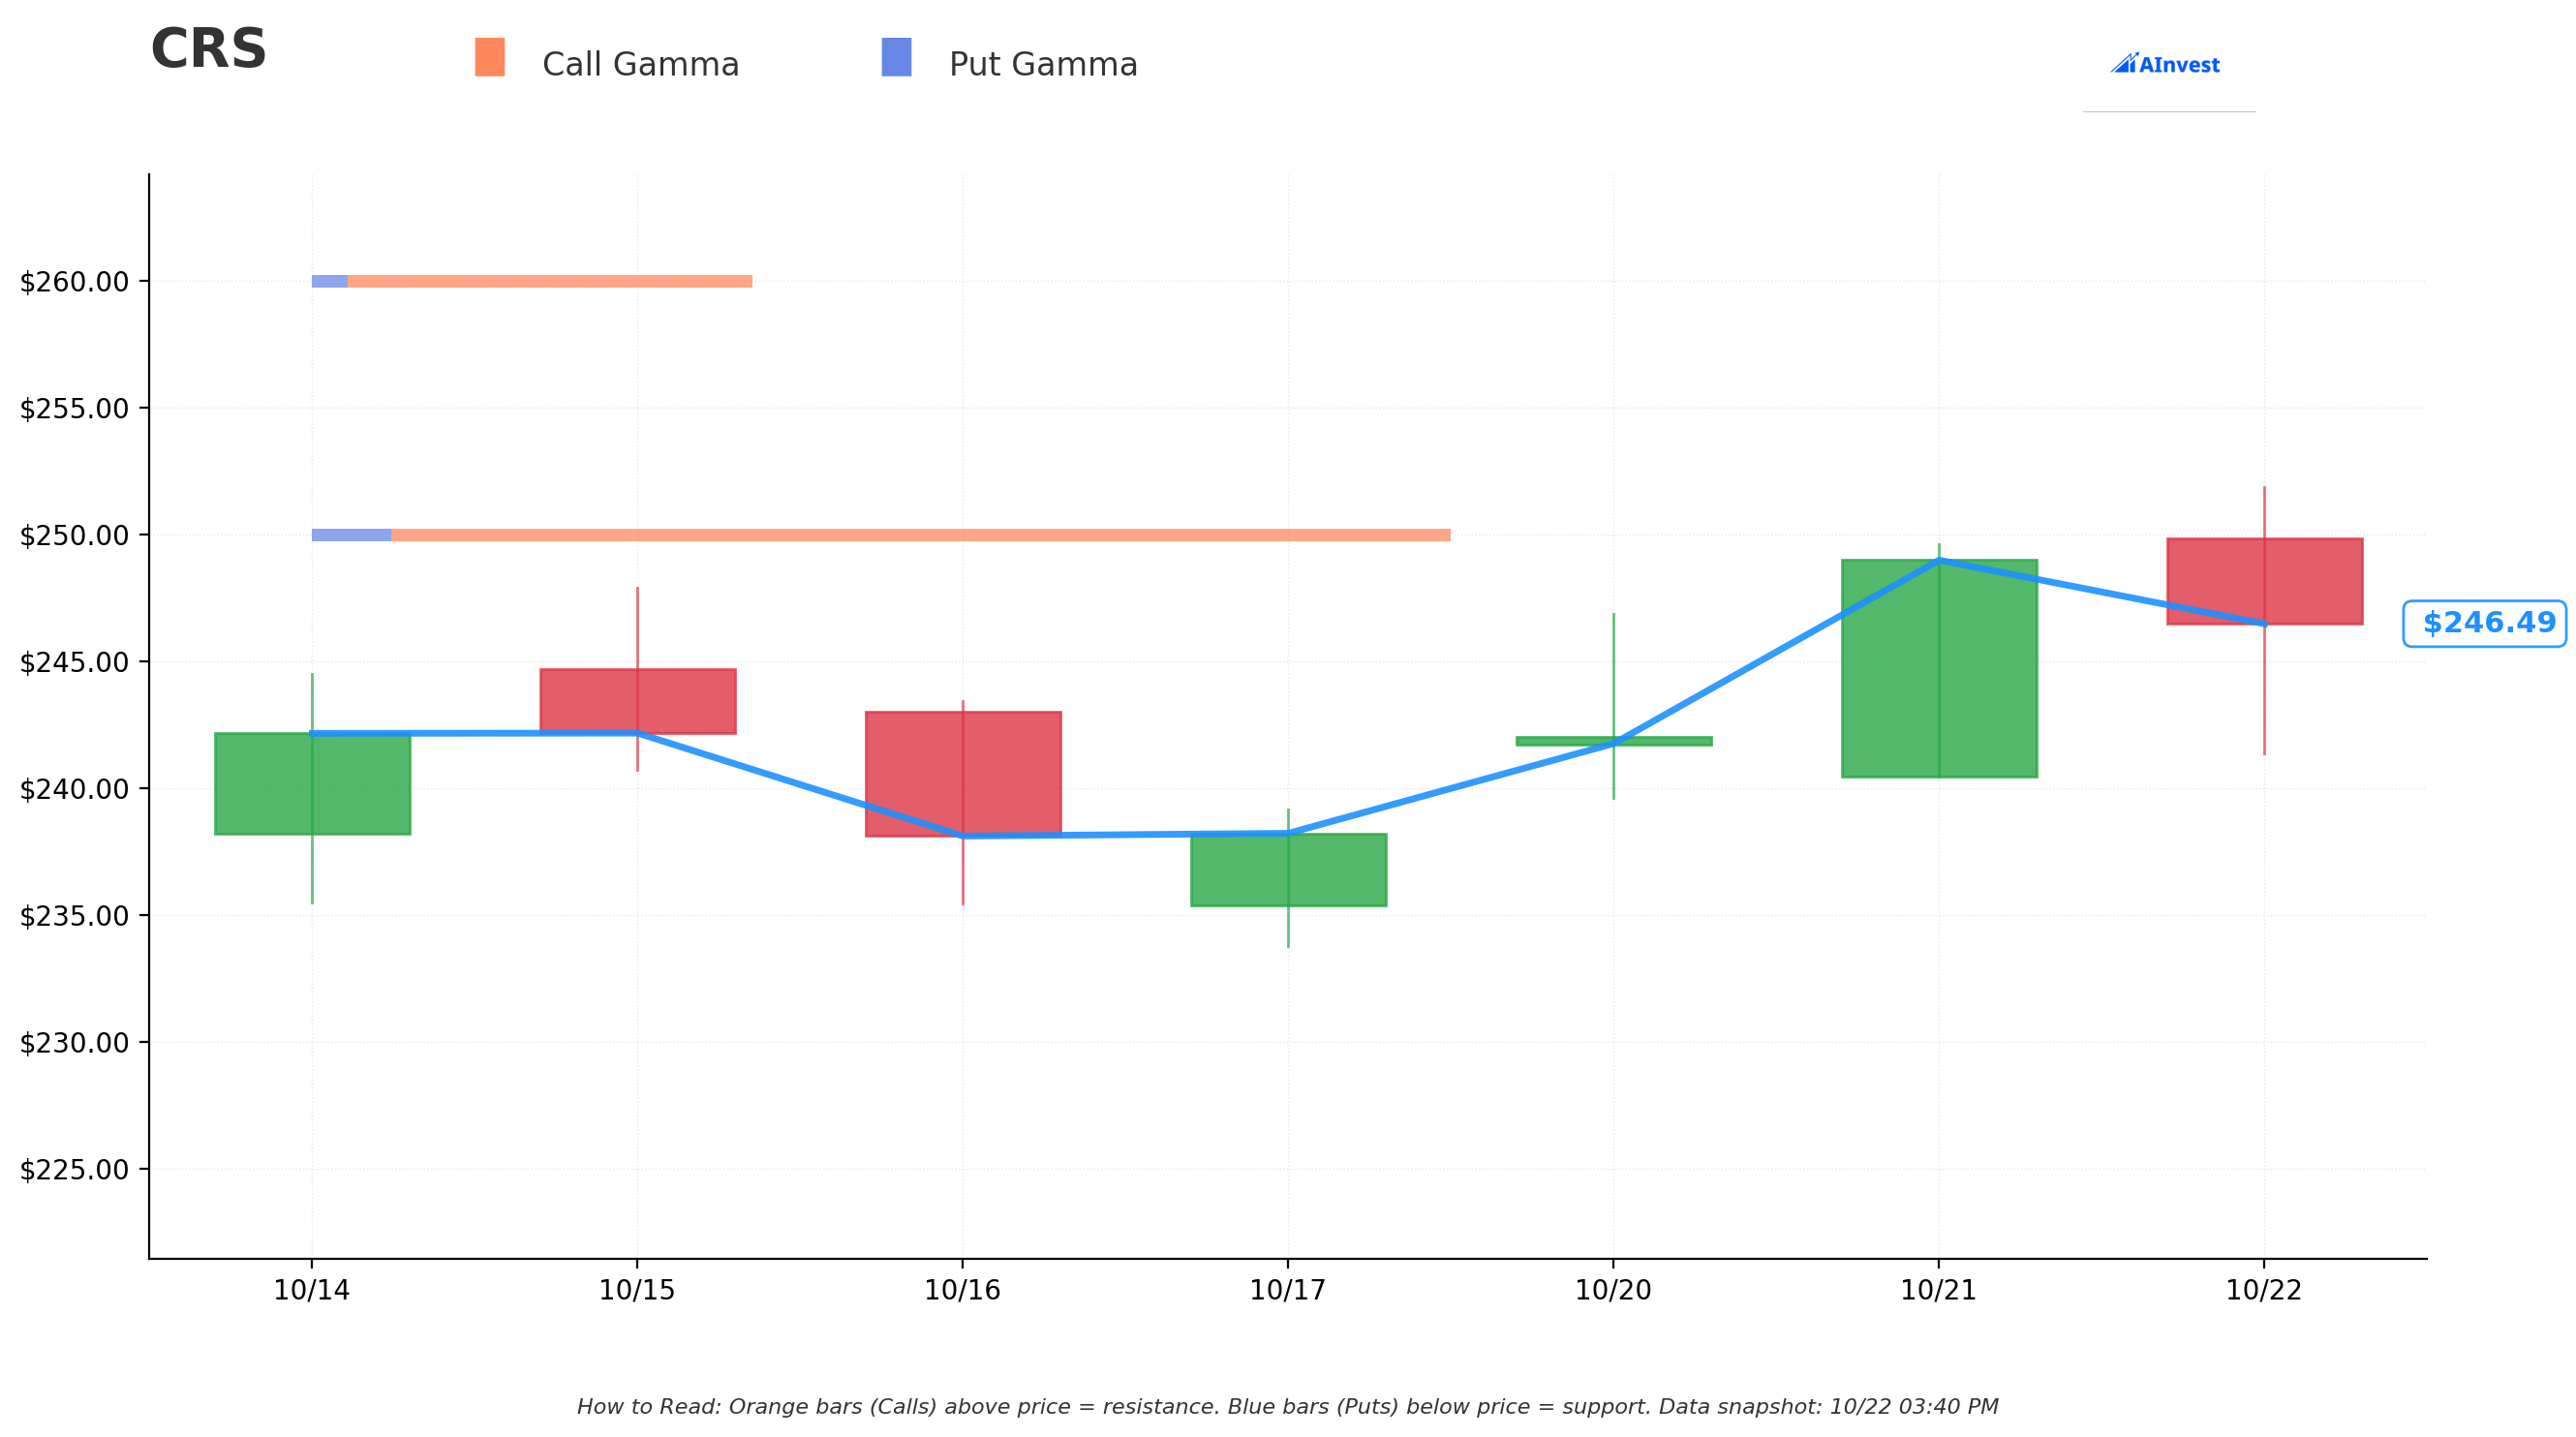
Current Price: $244.33
The gamma chart reveals critical levels that perfectly explain this options trade:
Resistance Levels (Call Gamma Walls):
- $250 (Strongest): Massive resistance just 1.4% above - this is THE level to watch
- $260: Secondary resistance at 5.5% up - moderate gamma concentration
- $270: Third barrier at 9.5% up - lighter gamma but still notable
- $280: Heavy gamma returns at 13.6% up - major institutional interest
- $290: The trade's lower strike at 17.7% up - aligns perfectly with gamma resistance
Support Levels (Put Gamma Floors):
- $240 (Strongest): Primary support just 2.6% below current price - major floor
- $230: Secondary support at 6.7% down - moderate protection
- $220: Tertiary support at 10.7% down - lighter gamma
- $210: Fourth level at 14.8% down
- $200: Fifth floor at 18.9% down - psychological level
Market Maker Impact: Total call gamma is 3.5x larger than put gamma (1.09 vs 0.31), creating a bullish bias. However, the massive resistance at $250 means MMs will be selling into any rallies above current levels - this explains why the call seller feels comfortable!
⚡ Catalysts
Upcoming Events
Q1 FY2026 Earnings - October 23, 2025 (TOMORROW!)
- Scheduled before market open - the biggest immediate catalyst
- Wall Street expects EPS of $2.13-2.16 (up 23% year-over-year)
- Revenue estimates: $729-740M (up 1.6-8.1% YoY)
- Track record: Beat EPS in last 4 consecutive quarters with 8.4% average surprise
- Risk factor: Last quarter beat EPS but missed revenue, causing -12% stock drop
FY2026 Operating Income Guidance
- Management targeting $660-700M (up 26-33% from FY2025)
- 13 consecutive quarters of margin improvement in Specialty Alloys segment
- Long-term target: $765-800M by FY2027 (25% CAGR)
$354M Alabama Expansion
- Massive $354.25M capital investment announced September 2025
- Expected online fiscal year 2028 (calendar 2027)
- Will boost primary and secondary melt capacity for aerospace materials
- Creating minimum 62 new jobs over three years
Recently Completed
Aerospace & Defense Demand Surge
- Boeing and Airbus hold 15,000+ commercial aircraft orders - roughly 9 years of production backlog
- Defense customers requesting emergency orders due to elevated military activity
- Aerospace and defense represents 60-70% of total revenues
- MRO demand remains elevated as airlines manage existing fleets
Medical Segment Record Growth
- Q4 FY2025 marked another record quarter with sales up 9% sequentially and 38% year-over-year
- Strong procedure backlogs supporting continued demand
- Global medical device MRO market projected to grow from $44.4B in 2024 to $95B by 2030
Sector Reclassification to Aerospace & Defense
- Effective September 30, 2025, CRS moved from Materials to Aerospace & Defense sector (GICS 20101010)
- Expected to enhance visibility with sector-focused investors
- Resulted in inclusion in multiple Russell and S&P sector indices
Emerging Technology Platforms
- State-of-the-art 500,000-square-foot Emerging Technology Center in Athens, Alabama
- End-to-end additive manufacturing capabilities with full traceability
- Proprietary Hiperco® and Hypocore® soft magnetic alloys for EV motors and eVTOL propulsion
- Complete solutions from material development to stator/rotor stack production
Strong Financial Performance
- Generated $286M in adjusted free cash flow in FY2025
- Specialty Alloys Operations achieved 29.1% adjusted operating margin in Q3 FY2025
- Analysts forecast 14.2% annual earnings growth and 6.3% annual revenue growth through 2028
Analyst Sentiment
- Strong Buy consensus with 8 Buy ratings and 2 Hold ratings
- Average price target: $297-308 (20-25% upside)
- Jones Trading initiated coverage with $400 price target (63% upside)
- SimplyWall.St calculates fair value of $325.72 (31% upside)
🎯 Price Targets & Probabilities
Using the gamma levels, earnings catalyst, and technical setup:
🚀 Bull Case (30% chance)
Target: $270-$290
- Beats on both EPS AND revenue (unlike last quarter)
- Aerospace order commentary exceeds expectations
- Alabama expansion details excite investors
- Breaks through $250 gamma resistance
- Reaches the $290 call strike zone
Why it works: Strong EPS beat track record + secular aerospace tailwinds + massive backlog
😐 Base Case (50% chance)
Target: $230-$260 range
- Beats EPS but revenue is mixed (repeat of last quarter)
- Stock trades in current gamma band between $240-$260
- Volatility compresses post-earnings
- Call sellers collect premium as stock stays range-bound
Why it works: This is the sweet spot for the trade - stock stays below $290
😰 Bear Case (20% chance)
Target: $200-$230
- Revenue miss triggers profit-taking after 56% YTD run
- Guidance disappoints on near-term demand
- Broader market correction hits growth stocks
- Falls to $240/$230 gamma support levels
Why it works: Already up 56% YTD - vulnerable to "sell the news" after strong run
💡 Trading Ideas
🛡️ Conservative: Cash-Secured Put Selling
Play: Sell March $230 puts (6.7% below current)
Collect $8-10 per share in premium for obligation to buy at $230
Risk: Must buy stock at $230 if it falls below Reward: Keep premium if stays above $230, or own stock 6% cheaper
Why this works: Strong gamma support at $230, and if assigned you own a growing aerospace play at a discount
⚖️ Balanced: Straddle the Earnings
Play: Long straddle at $240 strike (November expiration)
Buy both $240 calls and $240 puts
Risk: Premium paid (need 20%+ move to profit) Reward: Unlimited in either direction
Why this works: 47% IV and earnings tomorrow mean big move is coming - just don't know which way
🚀 Aggressive: Counter the Seller
Play: Long calls at $250 or $260 strikes (November expiration)
Buy November calls to bet on earnings upside
Risk: Lose entire premium if stock doesn't move up Reward: Leveraged upside if earnings blows out
Why this works: 4-quarter EPS beat streak + aerospace tailwinds could drive surprise rally
⚠️ Risk Factors
- Earnings timing: Tomorrow morning's report is THE catalyst - could gap 10%+ either direction
- Revenue track record: Last quarter's revenue miss caused -12% drop despite EPS beat
- Valuation: Already up 56% YTD - vulnerable to profit-taking on any disappointment
- IV crush: Options are expensive (47% IV) - will compress rapidly post-earnings
- Gamma resistance: Massive wall at $250 means MMs will sell into rallies
- Call seller knows something: This $8.3M trade suggests someone with information is capping upside
- Boeing exposure: Any production issues at major aerospace customers could hurt demand
- Execution risk: The $354M brownfield expansion is capital-intensive and depends on successful project delivery
- Cyclical exposure: CRS remains exposed to cyclical aerospace demand and potential production disruptions
- Labor and supply chain: Company faces ongoing challenges from labor shortages and supply chain constraints
🏁 The Bottom Line
Real talk: This $8.3M call selling tsunami tells us someone with serious conviction - and likely inside knowledge - is betting CRS won't explode past $290 through March 2026. The gamma data backs this up with massive resistance at $250.
If you own CRS: Consider selling some into tomorrow's earnings - it's had a 56% run and smart money is taking profits
If you're watching: Tomorrow morning's earnings will be EVERYTHING - this trade suggests range-bound action through March
If you're bullish: The call selling could be wrong if CRS delivers blowout numbers - but you're fighting against $8.3M in bearish conviction
Mark your calendar: October 23rd (TOMORROW) before market open - this is when we find out who's right! 📅
Disclaimer: Options trading involves substantial risk. This analysis is for educational purposes only and not financial advice. Past performance doesn't guarantee future results.
About Carpenter Technology: CRS is a leading specialty metals producer serving aerospace, defense, medical, and energy markets with a $12.05-12.41 billion market cap in the steel works and rolling mills sector.