🐻 DIA: $5.5 Million Put Bet Signals Institutional Fear of Midterm Year Meltdown
February 3, 2026 | Unusual Activity Detected
🎯 The Quick Take
Someone just dropped $5.5 MILLION on DIA puts betting the Dow tanks to $480 by September - that's a 2.1% drop from current levels with 7+ months to play out. This isn't your neighbor's hedge - it's a professional-grade protection trade (or outright bearish bet) timed perfectly for the historically brutal midterm election year seasonality. With DIA sitting RIGHT at the $490 gamma wall and the market pricing in wild volatility ahead, this whale is positioning for the average -18% intra-year drawdown that hits midterm years.
🏢 Company Overview
SPDR Dow Jones Industrial Average ETF Trust (DIA) is one of the most widely traded ETFs in the world, tracking the 30 blue-chip companies that make up the Dow Jones Industrial Average.
- Type: Exchange-Traded Fund (ETF)
- Index: Dow Jones Industrial Average (price-weighted)
- Holdings: 30 large-cap US stocks including Apple, Microsoft, Goldman Sachs, UnitedHealth
- AUM: ~$41.5B
- Expense Ratio: 0.16%
- Primary Exchange: NYSE Arca
- Inception: January 14, 1998
Think of DIA as owning a slice of America's most iconic companies - from tech giants to industrial powerhouses. Because it's price-weighted (not market-cap weighted), high-priced stocks like Goldman Sachs and UnitedHealth have outsized influence on the index.
💰 The Option Flow Breakdown
📊 What Just Happened
| Time | Ticker | Direction | Type | Expiration | Strike | Volume | Premium | Strategy |
|---|---|---|---|---|---|---|---|---|
| 14:37:37 | DIA | BUY | PUT | 2026-09-18 | $480 | 3,000 | $5.5M | STANDALONE |
Key Flow Metrics:
- 🎯 Order Type: BTO (Buy to Open) - new bearish position, not closing
- 📊 Vol/OI Ratio: 1500.0 (HIGH_ACTIVITY flag triggered)
- 🔬 Z-Classification: LOW confidence (no historical baseline)
- ⏰ Time to Expiration: ~7.5 months (September 18, 2026)
- 📉 Strike vs. Current Price: $480 strike is 2.1% below $490.35 spot
🤓 What This Actually Means
Let me break this down in plain English:
The Trade Setup:
- Someone paid roughly $18.33 per contract ($5.5M / 3,000 contracts / 100 shares)
- To break even at expiration, DIA needs to fall to $461.67 (strike minus premium)
- That's a 5.8% drop from current levels just to break even
Why This Trade Makes Sense:
- Midterm Election Timing: September 2026 is historically the WORST month in the WORST year of the presidential cycle. The trader is positioned to capture the average -18% intra-year drawdown
- Tariff Impact Peak: Fed expects tariff-driven inflation to peak mid-2026, which could crush consumer spending
- Valuation Reset Risk: The Buffett Indicator sits at a record 223% - well above the 200% danger zone
Most Likely Scenarios:
- Portfolio Hedge: Institutional investor protecting a large long equity portfolio
- Macro Bet: Systematic fund betting on midterm year correction pattern
- Tail Risk Insurance: Buying "insurance" against a tariff-driven recession
📈 Technical Setup
YTD Performance Chart
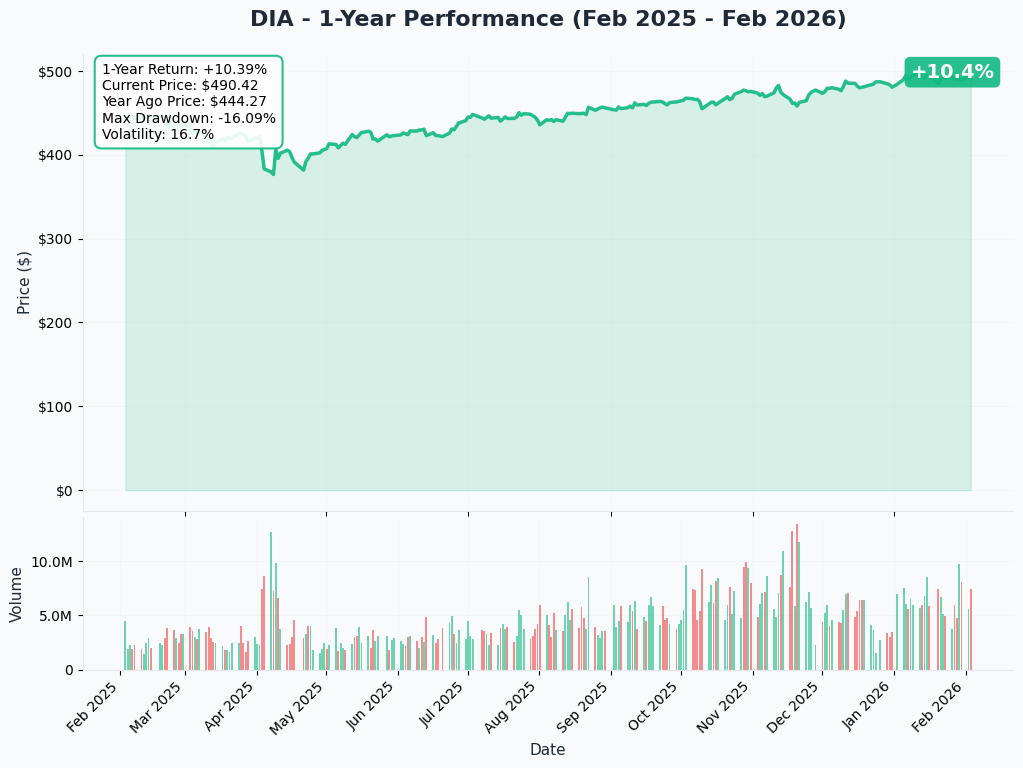
What the Chart Shows:
- 1-Year Return: +10.39% (from $444.27 to $490.42)
- Current Price: $490.35
- Max Drawdown: -16.09% (that April 2025 dip was nasty)
- Volatility: 16.7% annualized
The good news? DIA has been grinding higher since the December 2025 lows. The bad news? That -16% drawdown in April 2025 shows how quickly things can unravel - and midterm years typically see even deeper pullbacks.
🎯 Gamma-Based Support & Resistance Analysis
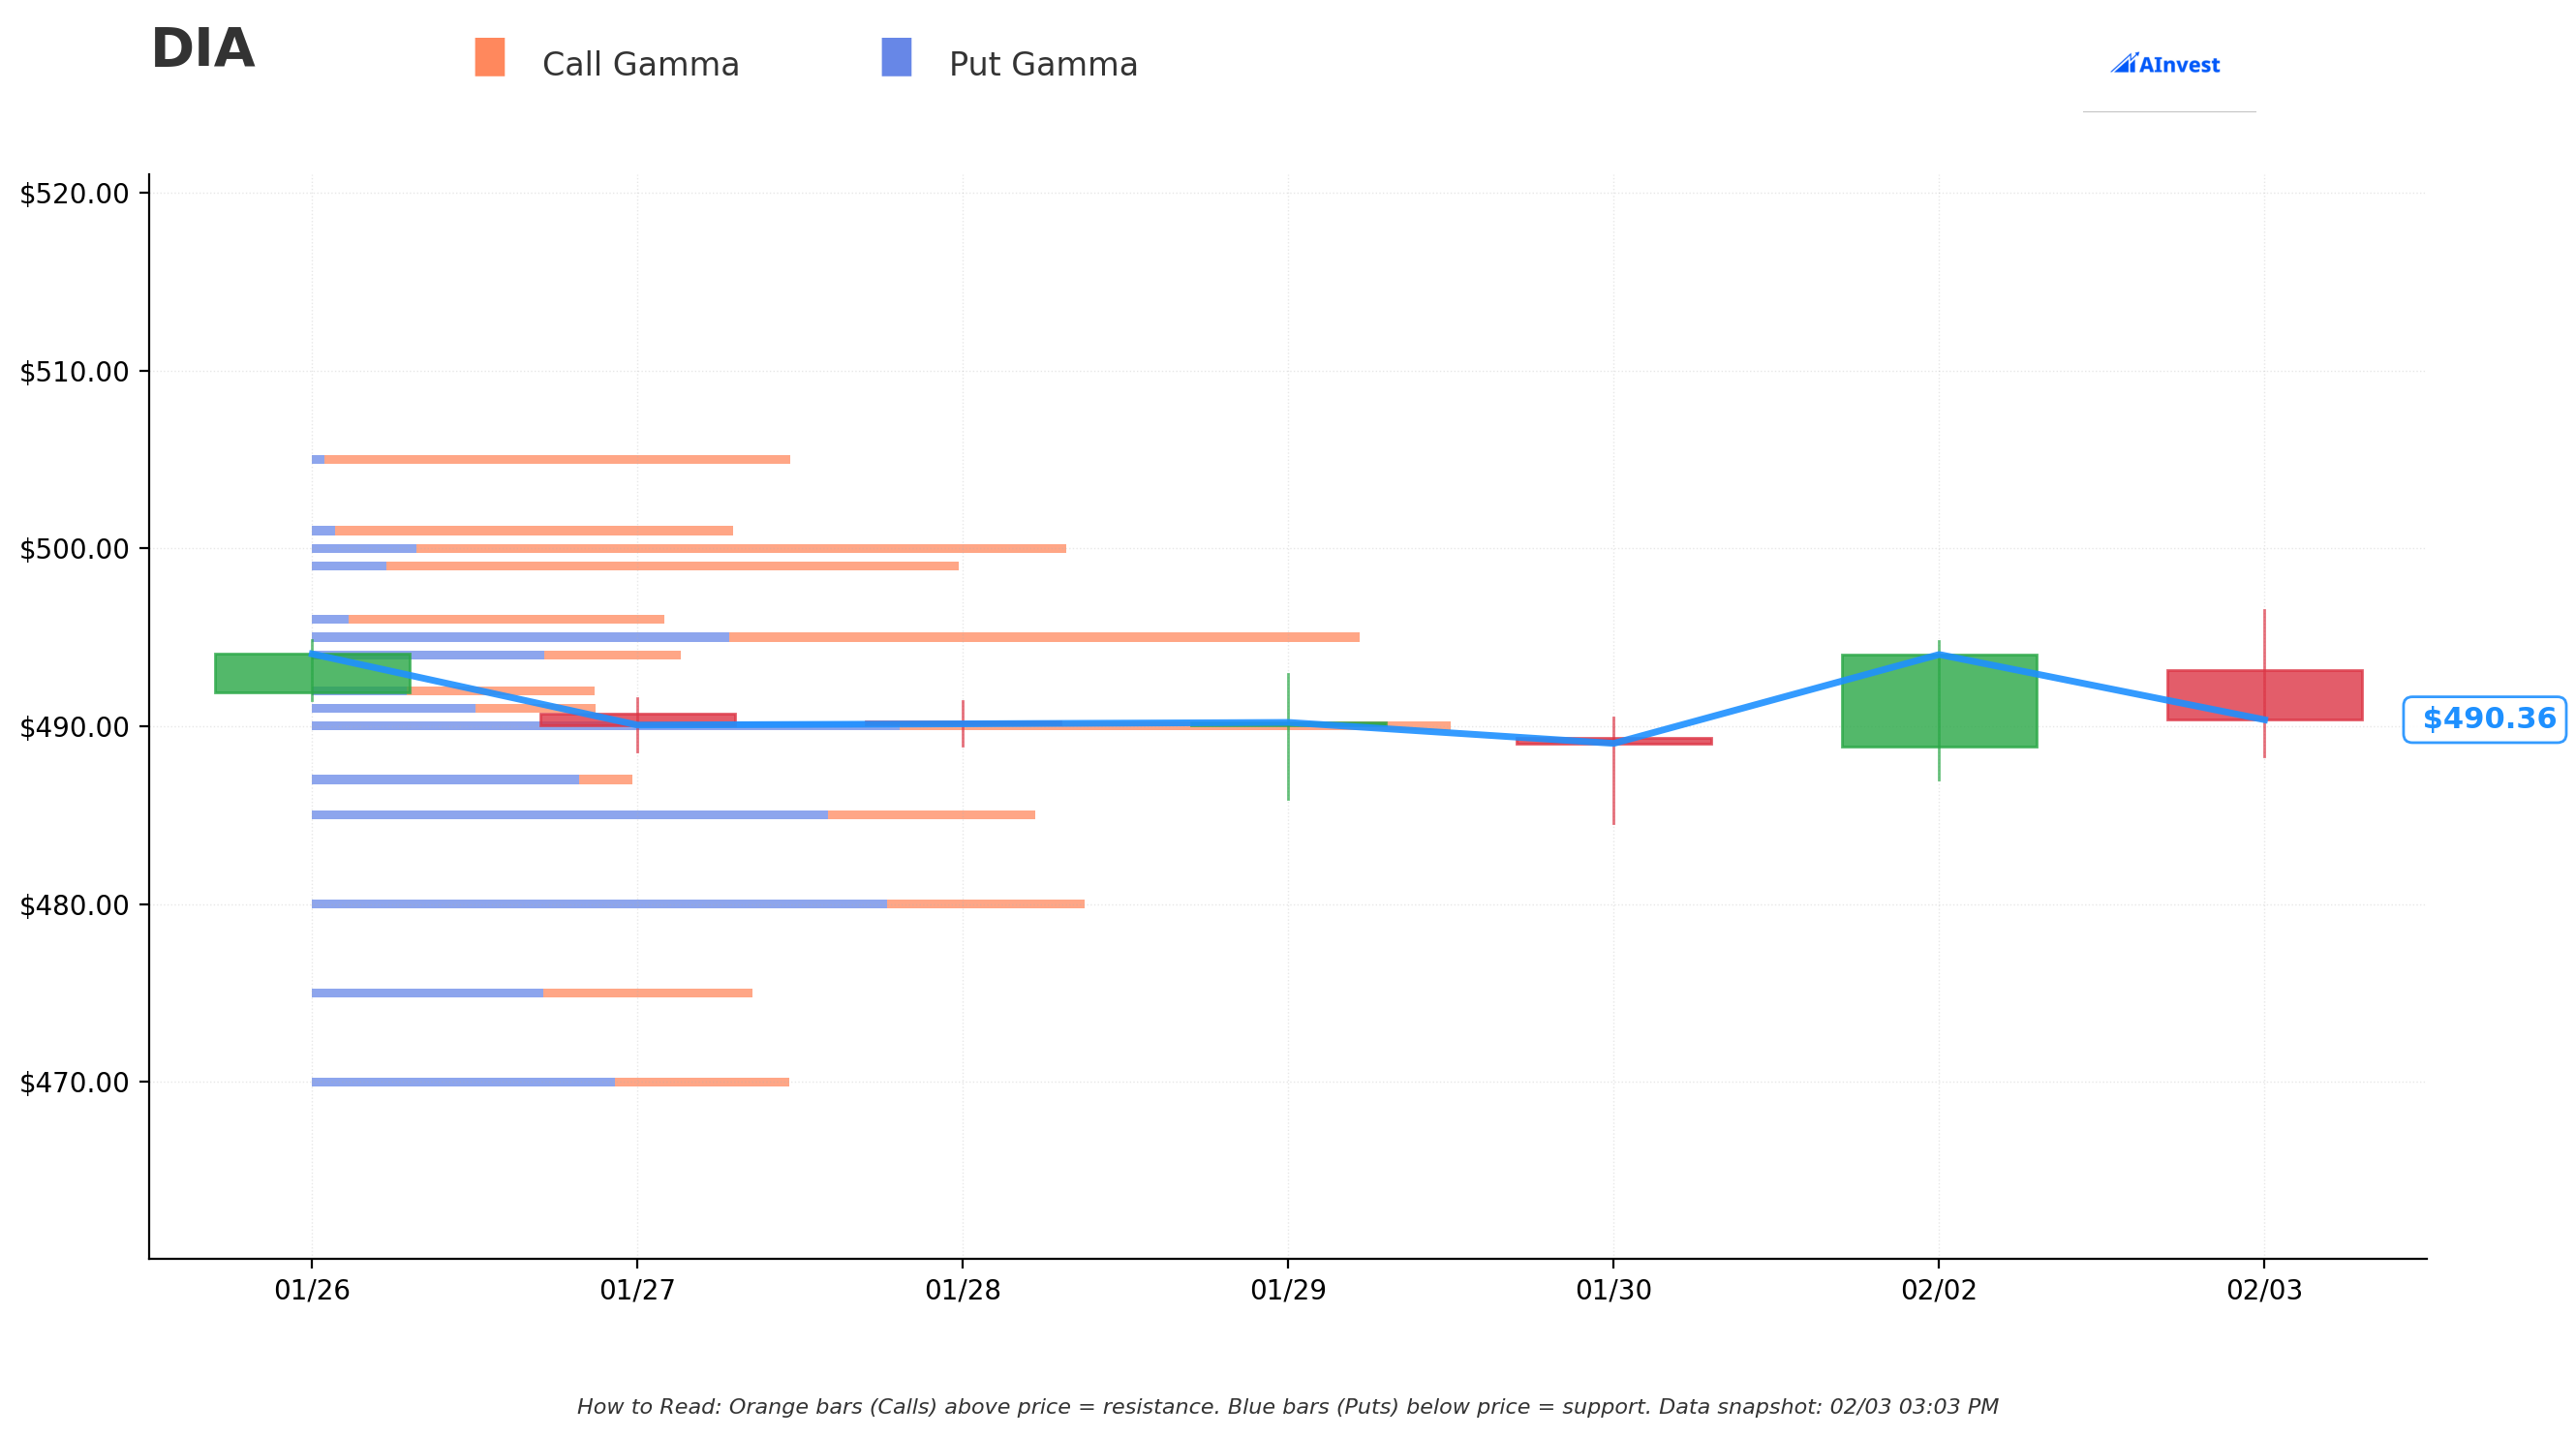
How to Read This Chart:
- 🔵 Blue bars (Put Gamma) = Support levels where buyers step in
- 🟠 Orange bars (Call Gamma) = Resistance levels where sellers appear
- Bigger bars = Stronger levels
Key Gamma Levels:
| Level | Type | Total GEX | Distance from Price | Strength |
|---|---|---|---|---|
| $490 | Support | $11.7B | 0.07% | Very Strong |
| $495 | Resistance | $10.7B | 0.95% | Very Strong |
| $500 | Resistance | $7.7B | 1.97% | Strong |
| $485 | Support | $7.5B | 1.09% | Strong |
| $480 | Support | $7.9B | 2.11% | Strong |
The Critical Insight: DIA is sitting RIGHT on top of the $490 gamma wall - the strongest level on the board with $11.7B in total gamma exposure. This is a major pivot point:
- Hold $490: Likely bounce toward $495-500 resistance
- Break $490: Next major support at $485, then the put strike at $480
The $5.5M put buyer is betting price breaks below ALL these support levels to $480 or lower. That's a tall order in the short term, but with 7+ months of runway and midterm year seasonality working in their favor, it's not unreasonable.
📊 Implied Move Analysis
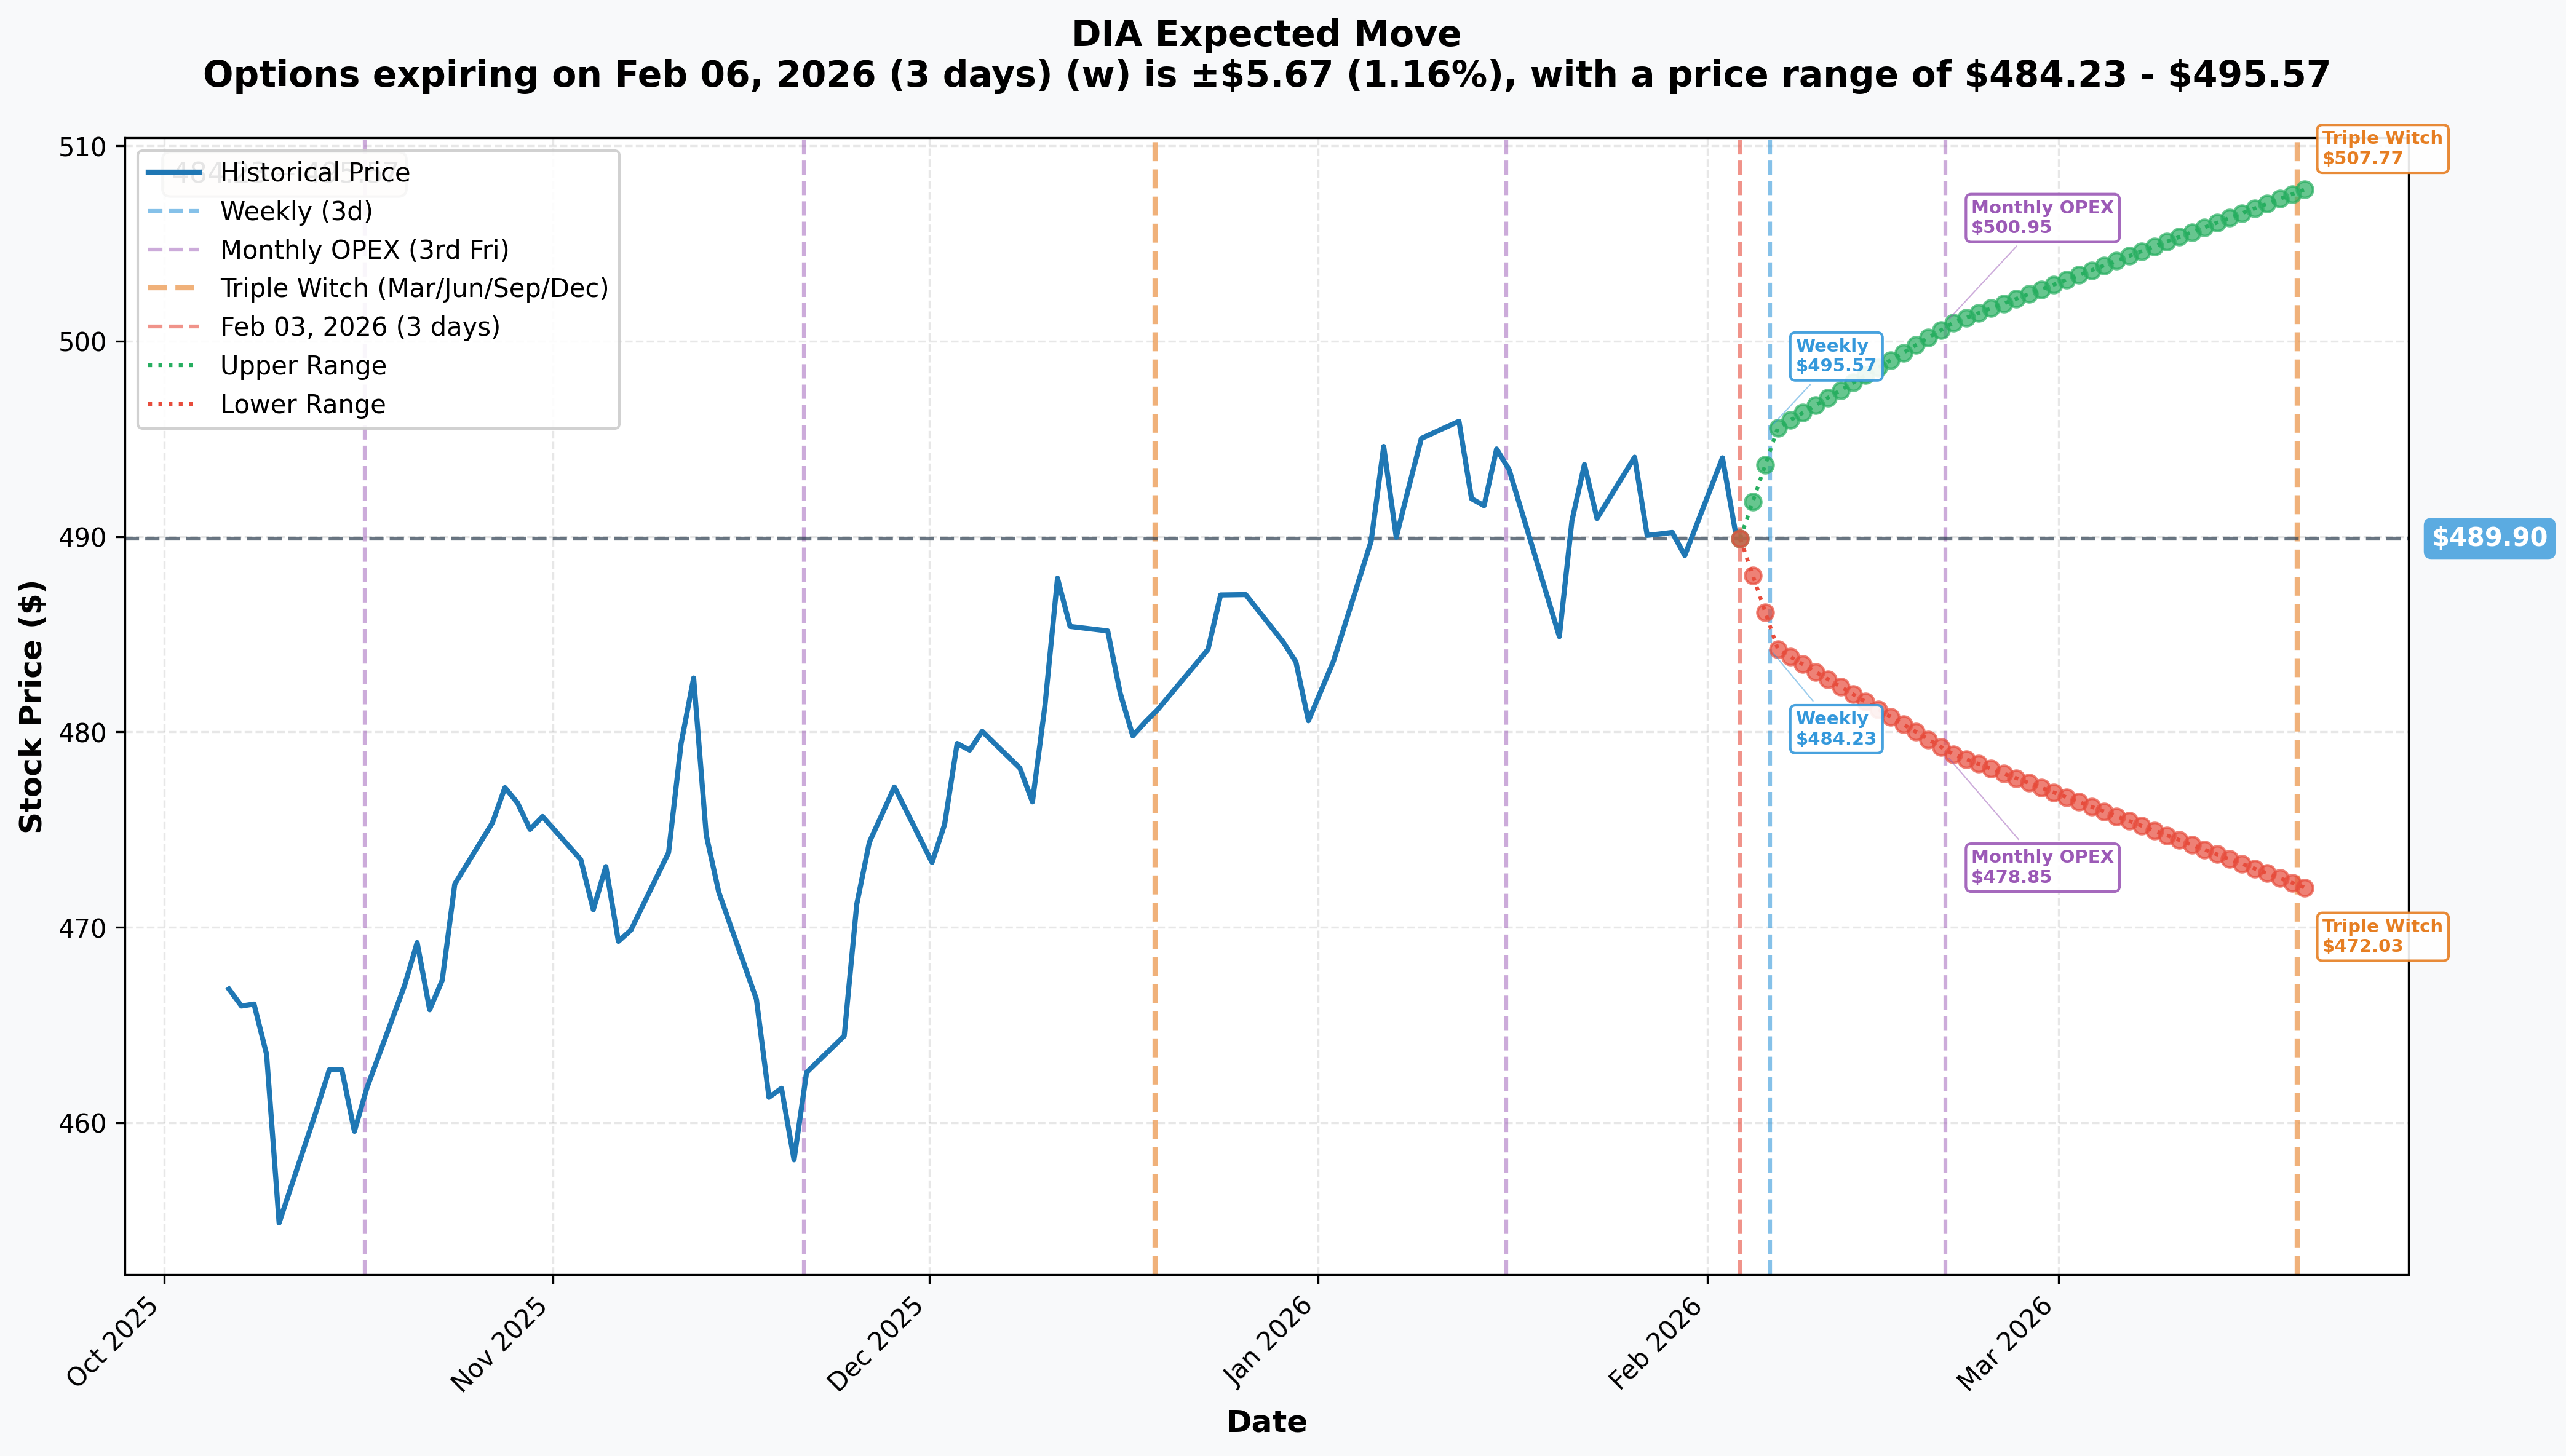
What the Options Market Expects:
| Timeframe | Expiry | Expected Move | Price Range |
|---|---|---|---|
| Weekly | Feb 6, 2026 | +/- 1.16% ($5.67) | $484.23 - $495.57 |
| Monthly OPEX | Feb 20, 2026 | +/- 2.26% ($11.05) | $478.85 - $500.95 |
| Triple Witch | Mar 20, 2026 | +/- 3.65% ($17.87) | $472.03 - $507.77 |
Translation:
- By weekly expiration (Feb 6), the market expects DIA to stay between $484-496
- By monthly OPEX (Feb 20), range widens to $479-501
- By Triple Witch (Mar 20), we could see anywhere from $472 to $508
Notice that the put strike of $480 is right around the monthly OPEX lower bound ($478.85). The trader may see value in that level as a realistic downside target during periods of stress.
🎪 Catalysts
Upcoming Catalysts (Next 6 Months)
February 2026:
- Feb 6: January 2026 Employment Report - labor market weakness could accelerate
- Feb 11: January 2026 CPI with new publication methodology
- Feb 20: Q4 2025 GDP Advance Estimate (consensus: +2.2%)
March-July 2026:
- Mar 17-18: FOMC Meeting with SEP - rate path guidance
- April 28-29: FOMC Meeting
- May 2026: Powell's term ends - Fed leadership transition
- June 16-17: FOMC Meeting with SEP
- July 28-29: FOMC Meeting
September 2026 (PUT EXPIRATION MONTH):
- Historical midterm year weakness peaks September-October
- Average -18% intra-year drawdown typically bottoms around this time
- Tariff cost impact on consumers expected to peak mid-2026
Recent Catalysts (Already Happened)
January 2026:
- Jan 28-29: Fed held rates at 3.50%-3.75% - three consecutive cuts in H2 2025, now on pause
- Jan 30: Trump nominates Kevin Warsh to replace Powell as Fed Chair
- Jan 9: December jobs report showed only +50K payrolls (weakest in years), unemployment at 4.4%
- Jan 13: December CPI at +2.7% YoY, still above Fed's 2% target
Key Macro Context:
- Effective tariff rate at 18% - highest since 1934
- Goldman estimates consumers will bear 67% of tariff costs by July 2026
- UnitedHealth (largest Dow component by weight) under DOJ antitrust investigation
🎲 Price Targets & Probabilities
Using gamma levels, implied moves, and catalyst analysis, here are the scenarios:
🐂 Bull Case: $500-505 by September 2026 (30% probability)
What Needs to Happen:
- DIA breaks above $495 resistance and holds
- Labor market stabilizes, avoiding recession
- Fed delivers additional rate cuts
- Q4 midterm year rally starts early
Gamma Path: Price needs to push through $495 (very strong resistance) and $500 (strong resistance) to reach $505
Put Trade Outcome: Total loss of $5.5M premium
⚖️ Base Case: $480-490 by September 2026 (45% probability)
What Needs to Happen:
- Normal midterm year correction pattern plays out
- DIA tests $485 support, possibly $480
- Economic slowdown but no recession
- Volatility spike in August-September per historical pattern
Gamma Path: Price oscillates between $485 support and $495 resistance, with potential test of $480 during September weakness
Put Trade Outcome: Near breakeven to modest profit if DIA trades at or below $480 at expiration
🐻 Bear Case: $460-470 by September 2026 (25% probability)
What Needs to Happen:
- 18% midterm year average drawdown materializes
- Tariff inflation crushes consumer spending
- UnitedHealth faces forced Optum divestiture (structural Dow damage)
- Buffett Indicator reversion triggers valuation reset
Gamma Path: Price breaks $480 support, accelerates lower as dealer hedging kicks in, tests implied move lower bound near $472
Put Trade Outcome: Massive profit - at $460, puts worth ~$20 each = $6M total value = $500K+ profit on $5.5M investment
💡 Trading Ideas
🛡️ Conservative: "Sleep Well" Protection
Strategy: Buy DIA March 2026 $480 Puts
The Setup:
- Expiration: March 20, 2026 (Triple Witch)
- Strike: $480 (2.1% OTM)
- Estimated Cost: ~$4-5 per contract
- Contracts: 5-10 (adjust for portfolio size)
- Max Risk: Premium paid
Why This Works: This gives you protection through the next Fed meeting and Triple Witch expiration. If DIA sells off toward the $472 implied move lower bound, these puts gain significant value. If markets rally, you lose the premium but your long portfolio benefits.
Best For: Investors with existing DIA or Dow exposure who want downside protection
⚖️ Balanced: "Smart Money Tracker" Put Spread
Strategy: Buy DIA September 2026 $480/$460 Put Spread
The Setup:
- Buy: Sep 2026 $480 Put
- Sell: Sep 2026 $460 Put
- Estimated Net Debit: ~$5-6 per spread
- Max Profit: $20 minus premium (if DIA at or below $460)
- Max Risk: Premium paid
Why This Works: You're following the whale's trade but defining your risk with a spread. The $460 strike caps your profit but significantly reduces your cost. If the -18% midterm drawdown materializes, DIA at $460 would represent a ~6% drop from current levels - well within historical norms.
Best For: Traders who want bearish exposure with defined risk
🚀 Aggressive: "Midterm Meltdown" Calendar Spread
Strategy: DIA Put Calendar Spread
The Setup:
- Sell: June 2026 $480 Put (collect premium)
- Buy: September 2026 $480 Put (follow the whale)
- Estimated Net Debit: ~$3-4 per spread
- Goal: June put expires worthless, September put gains from late-summer selloff
Why This Works: Midterm year weakness historically concentrates in August-October. By selling the June put and buying September, you're betting the first half of 2026 stays relatively calm while the second half delivers the pain. If DIA is above $480 at June expiration, you keep that premium and own the September puts at reduced cost.
Best For: Experienced traders who understand calendar spread dynamics
🔗 Track This Trade
- DIA Stock: View on Ainvest
- DIA Sep 2026 $480 Put: Option Chart
😰 Risk Factors
For the Bearish Thesis:
- 🚀 Q4 Rally Starts Early: Midterm years typically end strong (+14% average 6-month return post-October). If the rally begins in August, September puts could expire worthless
- 📈 Fed Cuts Rates: If economic weakness forces Fed to cut, markets may rally despite poor fundamentals
- 🎯 $490 Gamma Wall Holds: Very strong support at current levels could prevent meaningful downside
- 💰 Analyst Targets: TipRanks consensus sees DIA at $533 (+15% upside)
For the Bullish Thesis:
- 📉 Labor Market Collapse: Job gains averaging only 49,000/month vs. 168,000 in 2024
- 💸 Tariff Pain: $2,100 average household burden in 2026
- ⚠️ UnitedHealth Risk: DOJ probes could force Optum divestiture, crushing Dow's largest component
- 🏛️ Fed Transition: Powell departure in May 2026 creates policy uncertainty
General Risks:
- ⏰ Time Decay: 7+ months is a long time to be wrong on direction
- 💵 Premium Cost: $5.5M is locked up until September
- 🎢 Volatility Crush: If implied volatility drops, put values decline even if DIA falls
🎯 The Bottom Line
Here's the deal:
A sophisticated trader just bet $5.5 million that DIA drops to $480 or lower by September 2026. Given the historical midterm year seasonality (average -18% intra-year drawdown), tariff-driven inflation peaking mid-2026, and the Buffett Indicator screaming overvaluation at 223%, this isn't a crazy bet.
If you're long DIA or Dow components: Consider buying some downside protection (March or June puts at $480-485 strikes). The premium is your insurance cost against a potential 10-15% drawdown.
If you're bearish: The September $480/$460 put spread offers defined risk exposure to the midterm correction thesis. You're not betting the farm, but you're positioned if the historical pattern repeats.
If you're neutral: Watch the $490 gamma level closely. A decisive break below triggers a cascade toward $485, then $480. That's your signal the bears are taking control.
Mark Your Calendar:
- Feb 6: January jobs report
- Mar 17-18: FOMC with projections
- May 2026: Powell's term ends
- Sep 2026: Historical midterm weakness peaks
The smart money is positioning for turbulence. Whether this is a hedge or an outright bet, $5.5M says someone expects rough waters ahead. Plan accordingly.
Disclaimer: Options trading involves significant risk of loss and is not appropriate for all investors. The unusual activity highlighted in this analysis does not constitute a recommendation to buy or sell any security. Always conduct your own research and consider your financial situation before making investment decisions.