🚀 EEM Mega Bulls Load $16.8M in Long-Dated Calls - Emerging Markets Ready to Explode! 💰
📅 October 3, 2025 | 🔥 Unusual Activity Detected
🎯 The Quick Take
Someone just dropped $16.8 MILLION across four massive call option trades on the iShares Emerging Markets ETF (EEM) today! The biggest single trade was a jaw-dropping $8.6M bet on March 2026 $46 calls - that's 1,205x larger than average EEM trades. With emerging markets already up 29.5% YTD and crushing the S&P 500, these institutional players are betting on continued dominance. Translation: Smart money is loading the boat for a massive emerging markets rally!
📊 ETF Overview
iShares MSCI Emerging Markets ETF (EEM) is the go-to vehicle for emerging markets exposure with:
- Assets Under Management: Over $20 billion
- Exchange: NYSE Arca (ARCX)
- Type: Exchange-Traded Fund
- Shares Outstanding: 380.25 million
- Primary Holdings: Taiwan Semi (11%), Tencent (5.5%), Alibaba (3.9%), Samsung (3%)
💰 The Option Flow Breakdown
📊 What Just Happened
The Tape (October 3, 2025):
| Time | Symbol | Buy/Sell | Call/Put | Expiration | Premium | Strike | Volume | OI | Size | Spot | Option Price | Option Symbol |
|---|---|---|---|---|---|---|---|---|---|---|---|---|
| 10:12:26 | EEM | BUY | CALL | 2026-03-20 | $8.6M | $46 | 9.5K | 86K | 9,500 | $54.29 | $9.08 | EEM20260320C46 |
| 10:16:05 | EEM | BUY | CALL | 2026-01-16 | $4.1M | $55 | 25K | 98K | 24,614 | $54.27 | $1.65 | EEM20260116C55 |
| 09:53:50 | EEM | BUY | CALL | 2026-01-16 | $2.7M | $60 | 88K | 33K | 79,720 | $54.37 | $0.34 | EEM20260116C60 |
| 10:20:00 | EEM | BUY | CALL | 2026-03-20 | $1.4M | $46 | 11K | 86K | 1,500 | $54.29 | $9.08 | EEM20260320C46 |
🤓 What This Actually Means
Real talk: This isn't your neighbor Bob on Robinhood - this is institutional desk trading at its finest! Let me break it down:
- $8.6M monster trade: Someone's so bullish they're buying deep ITM $46 calls expiring March 2026. That's like buying the whole house, not just betting on appreciation!
- Above ask urgency: The $55 strike buyer paid ABOVE asking price for 24,614 contracts - they wanted IN and weren't negotiating
- OTM lottery tickets: The $60 strike (79,720 contracts!) is pure upside speculation at just $0.34 per contract
- All bullish, all long-dated: Every single trade is a CALL with 3-6 months to expiration
Unusual Score for $8.6M trade: 🌋 1,205x average size - This literally NEVER happens in EEM! The system scored it 10/10 on the unusual meter.
📈 Technical Setup / Chart Check-Up
YTD Performance Chart
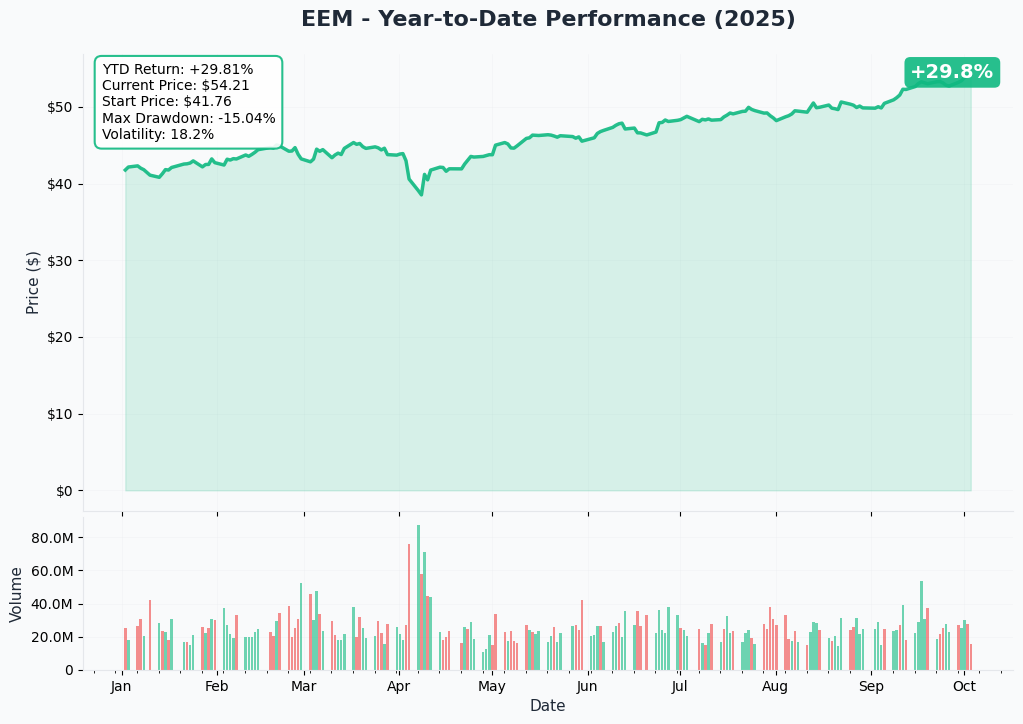
EEM is absolutely crushing it with +29.5% year-to-date gains, leaving the S&P 500's 14.5% return in the dust! We're seeing the ninth consecutive month of gains - the longest winning streak since 2004. That's not normal, folks!
Key levels from the chart:
- Current trading: $53.7-$54.0 resistance zone
- Support levels: $53.0, $52.0, and $51.5
- RSI near 70 - momentum is hot but getting stretched
Gamma-Based Support & Resistance Analysis
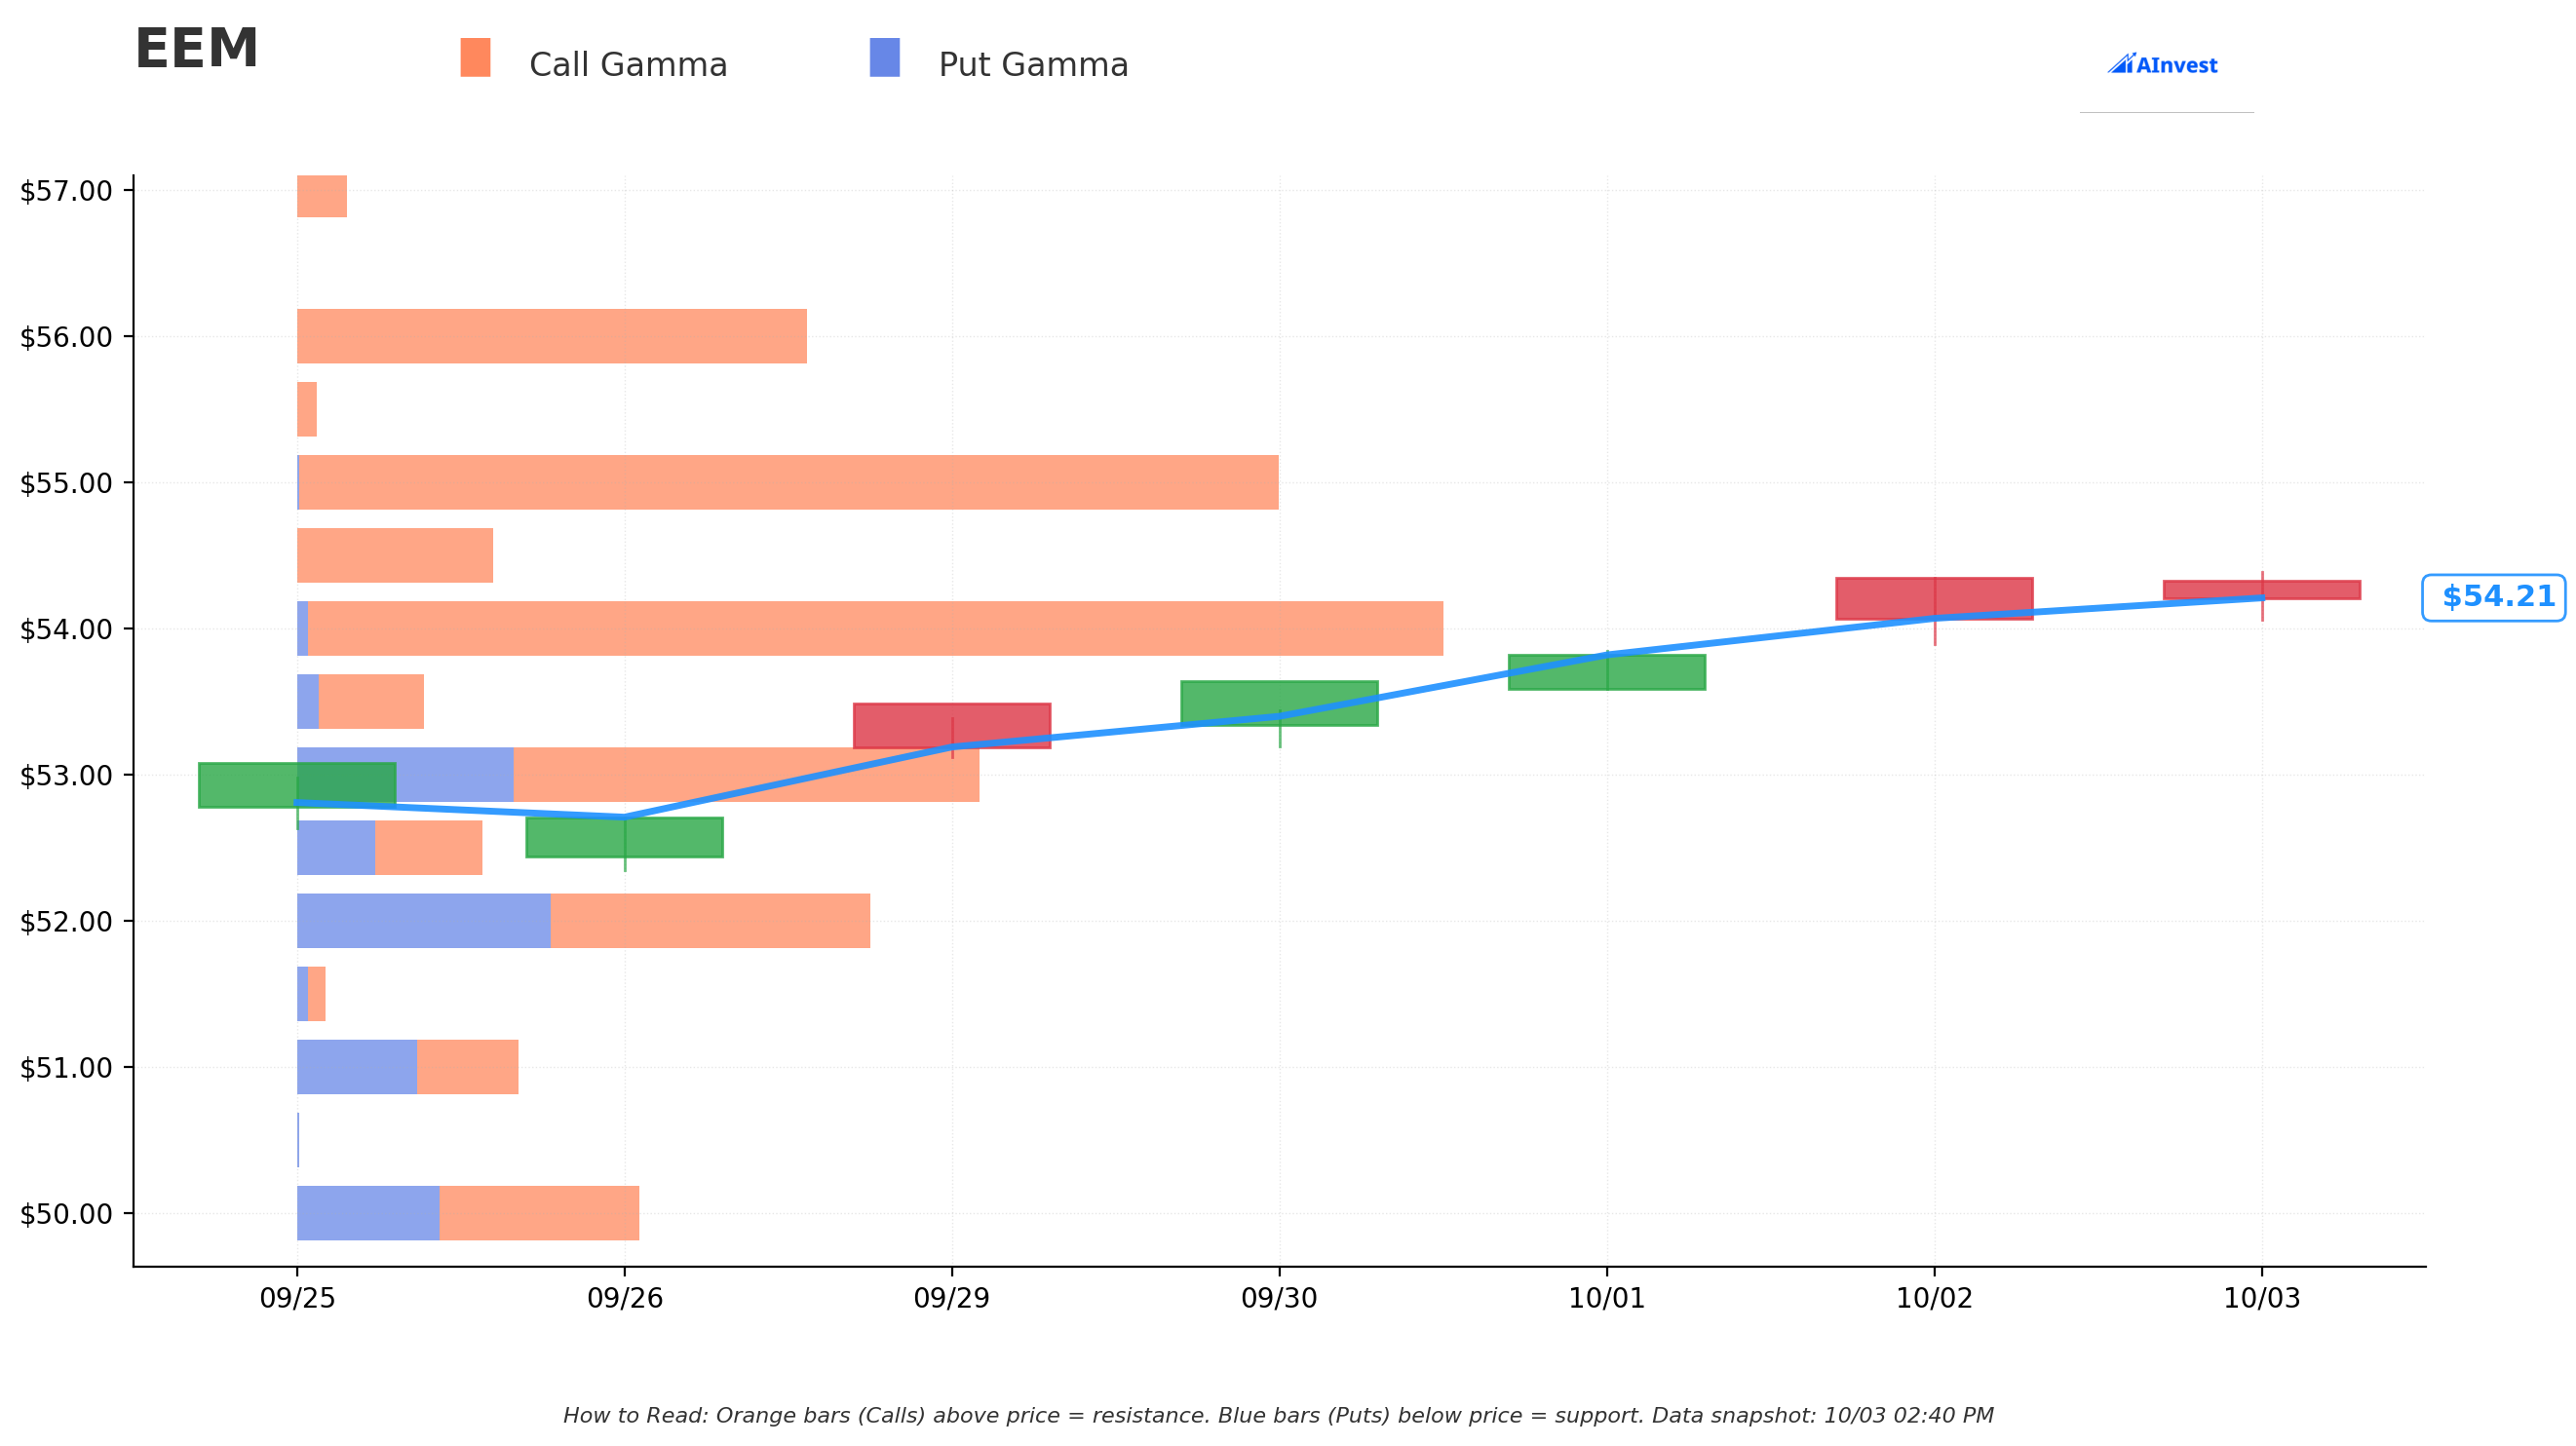
Current Price: $54.20
The gamma chart reveals where the big money has parked their bets:
🟠 Resistance Levels (Call Gamma):
- $54.50: Immediate resistance with 49.2M gamma exposure (0.56% away)
- $55.00: MASSIVE wall with 246M gamma - this is THE level to break! (1.49% away)
- $56.00: Secondary resistance at 128M gamma (3.33% away)
- $58.00: Light resistance, clear skies if we get here (7.02% away)
🔵 Support Levels (Put Gamma):
- $54.00: Strongest support with 287M total gamma (0.36% below)
- $53.00: Major floor at 171M gamma (2.21% below)
- $52.00: Deep support at 144M gamma (4.05% below)
- $50.00: Disaster support at 86M gamma (7.74% below)
Translation: The market makers are defending $54 like Fort Knox, but if we break above $55, it could trigger a gamma squeeze to $56+!
🎪 Catalysts
Upcoming Events
Macroeconomic Tailwinds:
- IMF upgraded emerging economies' 2025 GDP forecast to 4.1% from 3.7%, driven by China recovery
- EM-DM growth gap to remain robust at 2.5% in 2025
- MSCI EM earnings growth accelerating to 17% in 2025 from 10% in 2024
China Stabilization:
- China's 2025 GDP growth forecast increased to 4.8% with policy stimulus taking effect
- Trade tensions easing with U.S.-China tariff pause
- Policy support measures finally gaining traction
Tech Sector Leadership:
- Taiwan's IC industry projected to reach $197.2 billion in 2025 - nearly 20% growth!
- TSMC's foundry dominance expanding to 63.4% of Taiwan's semiconductor industry
- AI boom driving "soft tech" outperformance
Recently Completed
Fed Policy Shift:
- Fed rate cuts supporting EM flows with most EM central banks also easing
- Dollar weakness (DXY down 9% YTD) providing major tailwind
- Emerging markets typically outperform during dollar weakness cycles
🎲 Price Targets & Probabilities
Based on gamma levels and catalyst analysis:
🚀 Bull Case (35% chance)
Target: $56-$58
- Break above $55 gamma wall triggers squeeze
- China stimulus exceeds expectations
- Dollar continues weakening
- Tech holdings (TSMC, Samsung) ride AI wave higher
😐 Base Case (50% chance)
Target: $53-$55 range
- Consolidation around current gamma-heavy zone
- Steady EM growth continues
- Range-bound between support at $53 and resistance at $55
😰 Bear Case (15% chance)
Target: $52 support
- Profit-taking after 9-month winning streak
- Geopolitical tensions escalate
- Strong gamma support at $52-$53 should hold
💡 Trading Ideas
🛡️ Conservative: "The Sleep Well Strategy"
Buy EEM shares at current levels ($54.20) with stop at $52
- Risk: 3.7% downside to stop
- Reward: 3.7% to first resistance at $56
- Hold for emerging markets secular growth story
⚖️ Balanced: "Follow the Whales"
Buy Jan 2026 $55 calls around $1.65
- Maximum risk: $165 per contract
- Breakeven: $56.65 at expiration
- Profit if EEM pushes through resistance by January
🚀 Aggressive: "YOLO with Training Wheels"
Buy Jan 2026 $60 calls for $0.34
- Lottery ticket pricing with 3+ months to work
- Need 11% move to breakeven
- Massive upside if EM rally continues
⚠️ Risk Factors
Let's keep it real - here's what could go wrong:
- Overbought RSI: Near 70, we're due for a breather
- Concentration risk: Top 10 holdings = 33% of portfolio
- Geopolitical wildcards around Taiwan and U.S.-China relations
- Nine-month win streak: Nothing goes up forever
- Global growth slowing to 2.3% in 2025
🎯 The Bottom Line
Here's the deal: When someone drops $16.8M on bullish EEM calls with the unusual score showing 1,205x normal size, you pay attention! This isn't casual positioning - it's institutional money making a massive directional bet.
The setup is compelling:
- ✅ EEM trading at 12.4x earnings vs S&P at 24x
- ✅ Massive gamma support at $54 providing floor
- ✅ Multiple catalysts (China recovery, Fed cuts, tech boom)
- ✅ Under-owned with room for allocation increases
Mark your calendar for:
- Watch for break above $55 (gamma wall)
- Monitor China policy announcements
- Track dollar weakness continuation
Action plan:
- Own it: Strong risk/reward with defined support
- Watching: Set alerts for $55 breakout
- Bearish: Wait for RSI cool-off below 60
Remember: These whales aren't betting $16.8M for a 2% move. They're positioned for something BIG! 🎢
⚠️ Options involve risk and are not suitable for all investors. Past performance doesn't guarantee future results. This analysis is for educational purposes only and not personalized investment advice.