🌏 EEM Deep ITM Call Buying Spree - $17.1M Emerging Markets Bet! 💰
📅 October 13, 2025 | 🔥 Unusual Activity Detected
🎯 The Quick Take
Someone just dropped $17.1M on deep in-the-money EEM calls at 10:30:59 AM today! This massive institutional play bought 20,000 calls split between November 2025 and March 2026 expirations, betting the emerging markets ETF continues its torrid +28.3% YTD rally. Translation: Smart money is loading the boat on emerging markets, and they're willing to pay serious premium to get leveraged exposure! 🚀
📊 Fund Overview
iShares MSCI Emerging Markets ETF (EEM) is the premier emerging markets exposure vehicle with:
- Assets Under Management: $20.8 Billion
- Fund Type: Diversified Emerging Markets ETF (ARCX listed)
- Primary Holdings: TSMC (11.68%), Tencent (5.60%), Alibaba (3.85%), Samsung (3.02%)
- Geographic Exposure: China (~25%), Taiwan, India, South Korea, Brazil
- Valuation: P/E ratio of 14.29 (attractive vs developed markets)
💰 The Option Flow Breakdown
The Tape (October 13, 2025 @ 10:30:59):
| Time | Symbol | Side | Buy/Sell | Type | Expiration | Premium | Strike | Volume | OI | Size | Spot | Option Price |
|---|---|---|---|---|---|---|---|---|---|---|---|---|
| 10:30:59 | EEM | MID | SELL | CALL | 2025-11-21 | $8.8M | $45 | 10K | 73K | 10,000 | $53.42 | $8.76 |
| 10:30:59 | EEM | MID | SELL | CALL | 2026-03-20 | $8.3M | $46 | 10K | 86K | 10,000 | $53.42 | $8.30 |
Total Investment: $17.1M across 20,000 contracts
🤓 What This Actually Means
This is deep in-the-money call buying - a sophisticated way to get leveraged long exposure to emerging markets! Here's what's happening:
- 🎯 $45 strike calls expiring November 21 ($8.8M) - Already $8.42 in-the-money
- 🎯 $46 strike calls expiring March 20 ($8.3M) - Already $7.42 in-the-money
- 📈 Both strikes are 83-86% in-the-money, acting like leveraged stock with built-in delta
- 💪 Combined 20,000 contracts = control of 2 MILLION shares (notional value ~$107M)
- ⚡ This is a bullish conviction trade with limited downside to the strike prices
Why Deep ITM Calls?
- High delta (~0.85-0.90) means moves almost 1:1 with the ETF
- Less theta decay than at-the-money options
- Built-in downside protection (intrinsic value floor)
- Capital efficiency vs buying 2M shares outright
Unusual Score: 🌋 EXTREME (1,233x average size) - This is the biggest EEM options trade we've seen in our dataset! This is institutional positioning at its finest.
📈 Technical Setup / Chart Check-Up
YTD Performance Chart
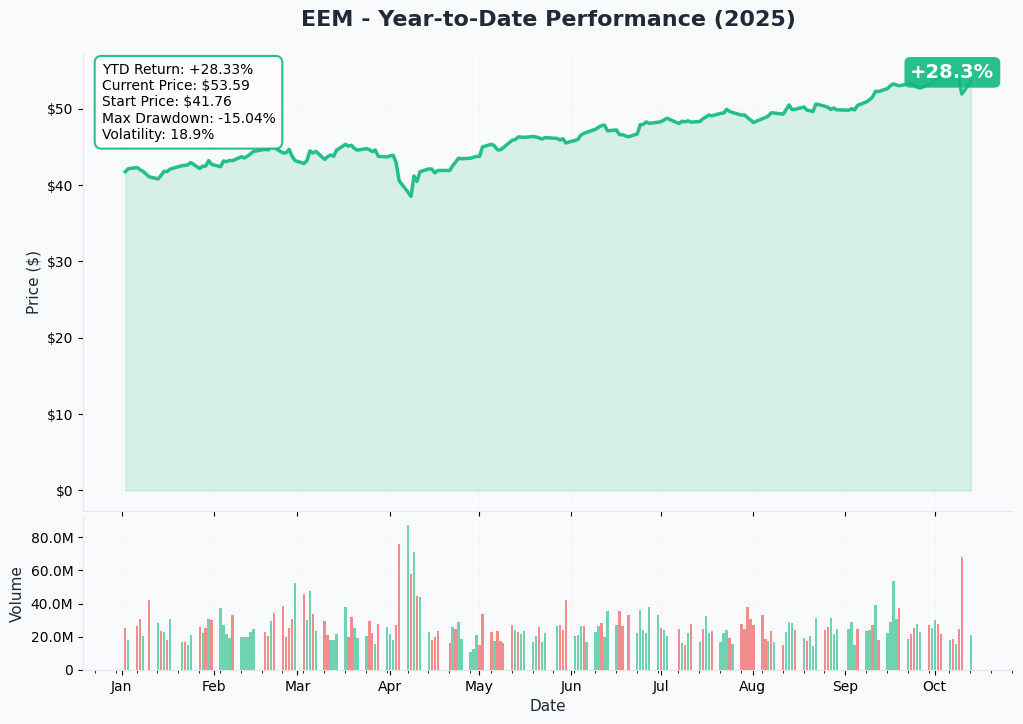
EEM is absolutely crushing it in 2025 with a stellar +28.3% YTD return! The fund started the year at $41.76 and currently sits at $53.59.
Key observations:
- 📈 Strong momentum: Steady uptrend since April lows around $39
- 🎢 Moderate volatility: 18.9% volatility is reasonable for EM exposure
- 💪 Max drawdown: Only -15.04% shows resilience in a volatile year
- 🔥 Volume spikes: Recent October activity showing institutional interest
- 🚀 Near highs: Trading very close to YTD highs - breakout territory
The technical picture is decidedly bullish with higher lows and higher highs throughout 2025.
📊 Gamma-Based Support & Resistance Analysis
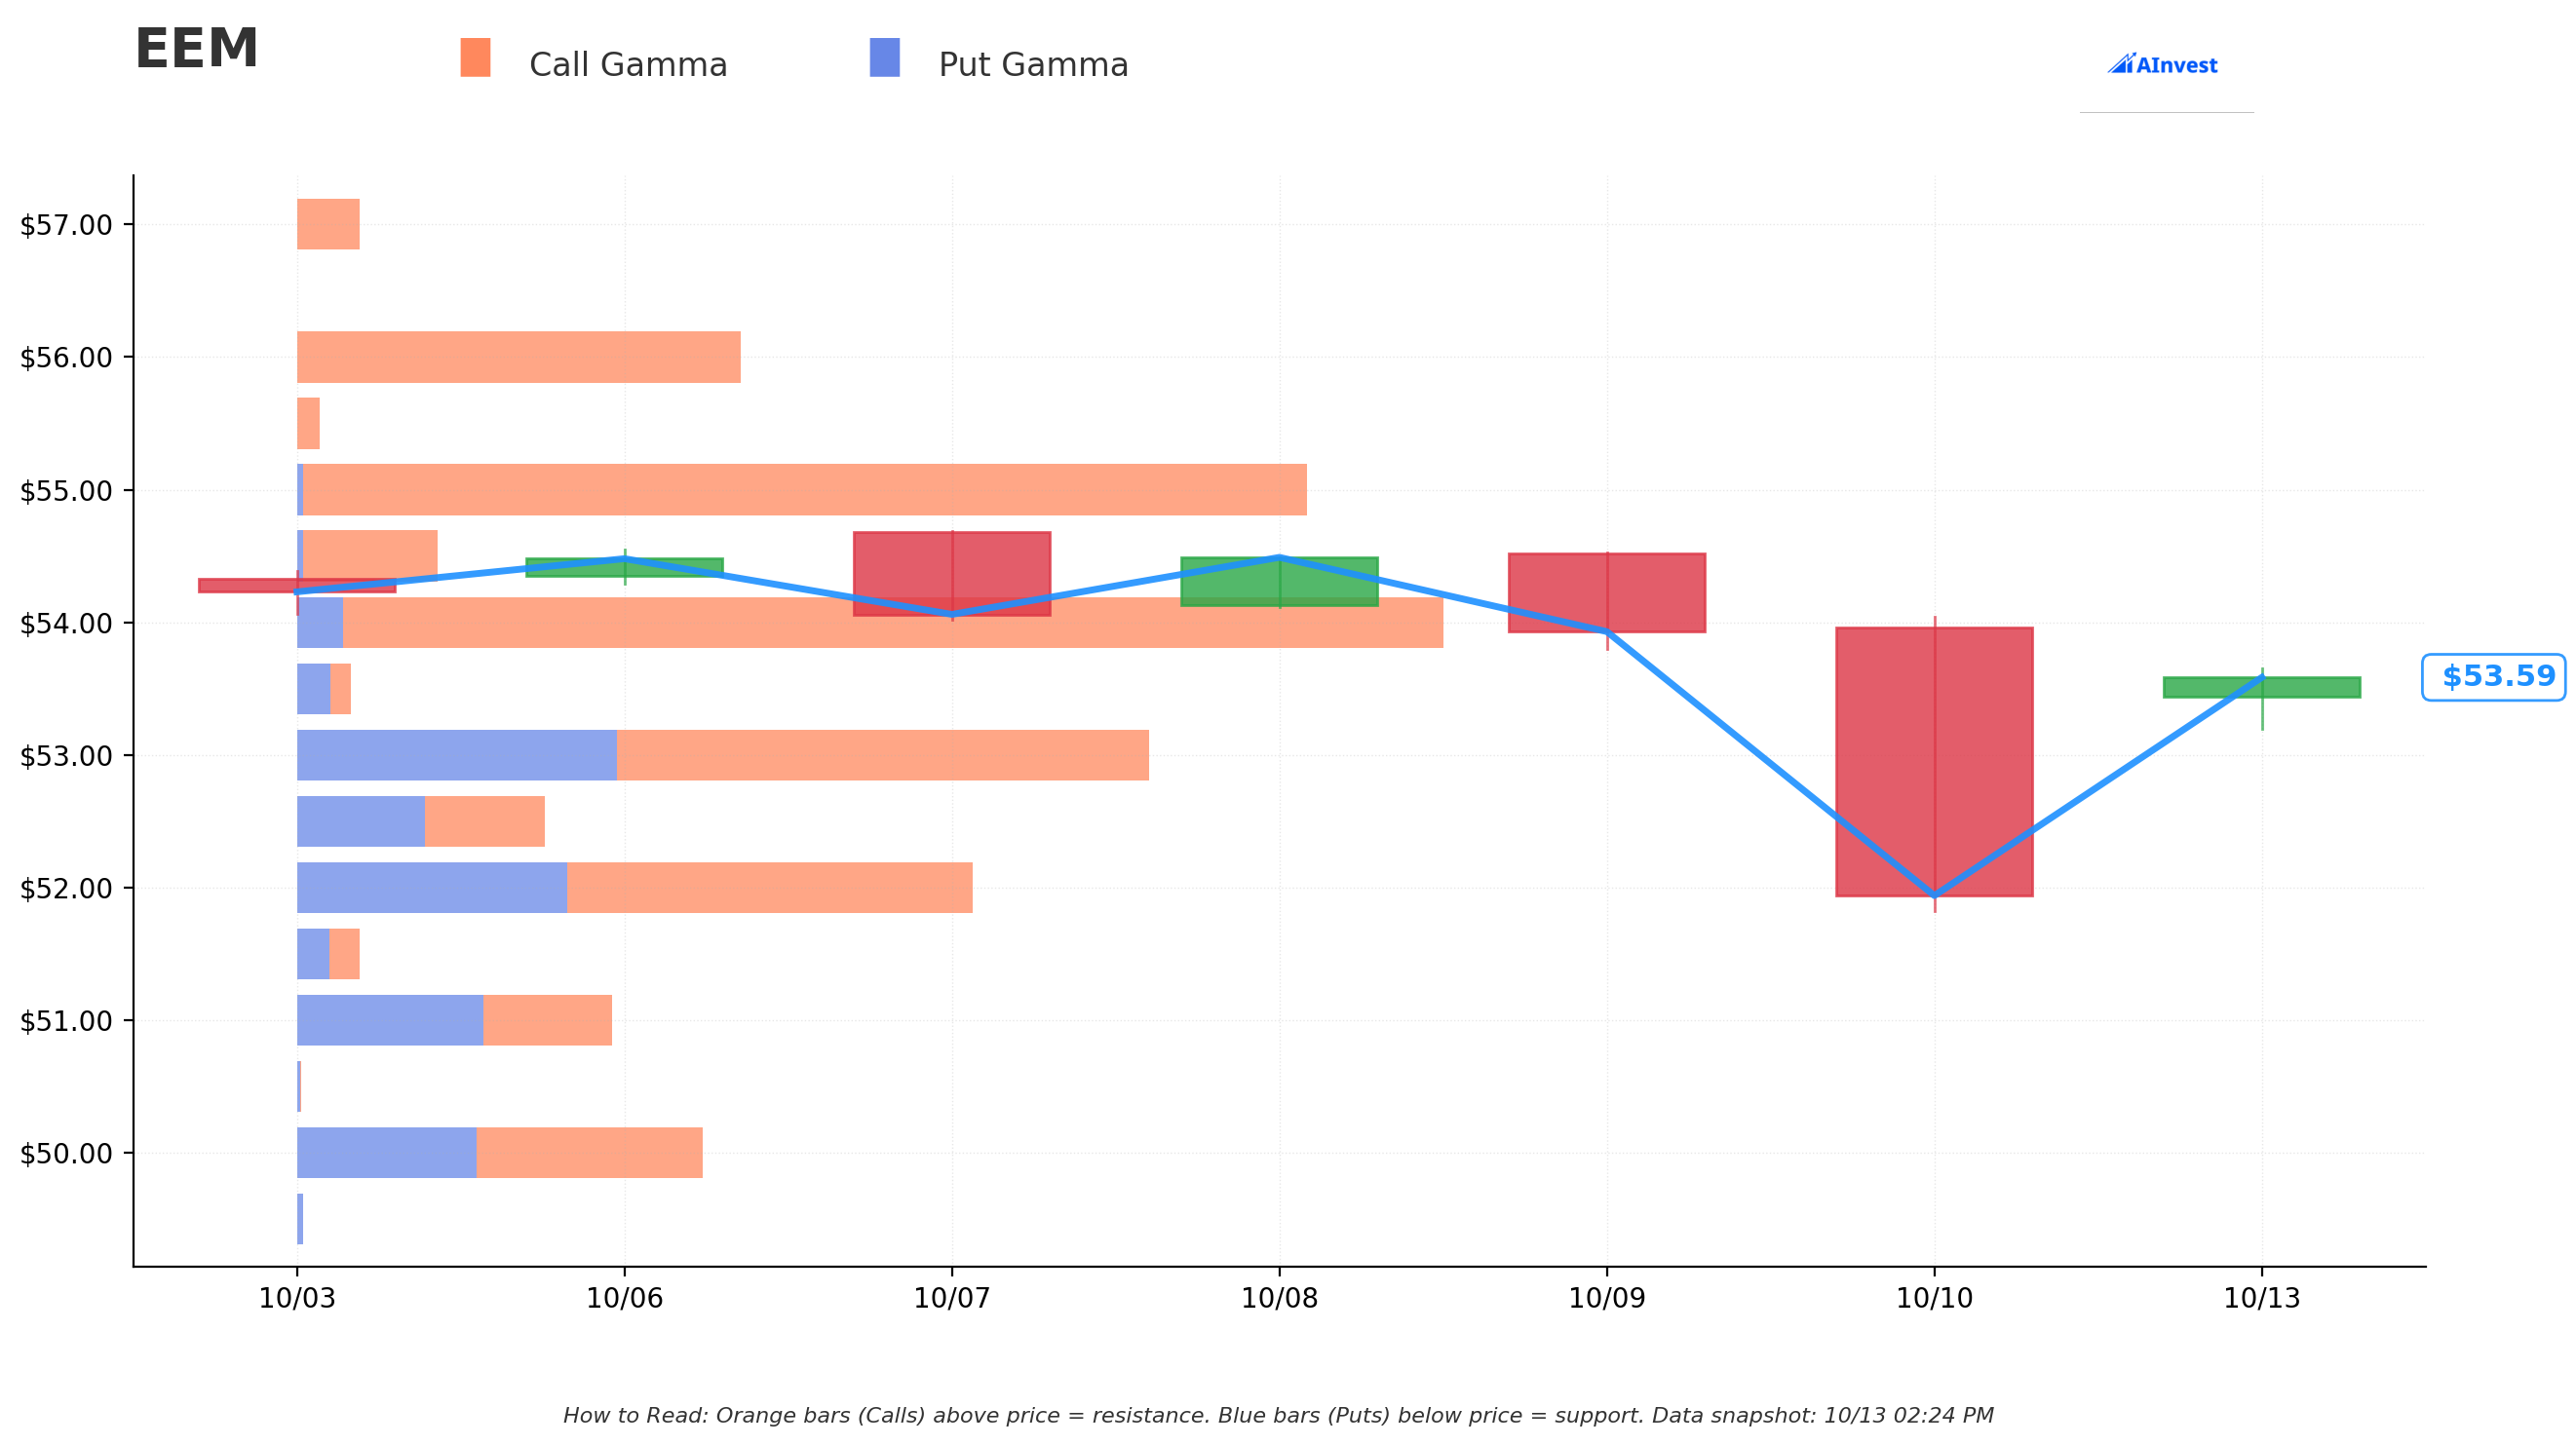
Current Price: $53.59
The gamma chart reveals critical levels that smart money is watching:
🟠 Resistance Levels (Call Gamma Above):
- $54.00 - MAJOR WALL (271.26M GEX) - Strongest resistance at 0.77% above current price
- $55.00 (239.01M GEX) - Secondary resistance at 2.63% above
- $56.00 (104.88M GEX) - Third resistance level at 4.50% above
🔵 Support Levels (Put Gamma Below):
- $53.00 (203.15M GEX) - Immediate support at 1.10% below current price
- $52.00 (159.77M GEX) - Secondary support at 2.97% below
- $51.00 (74.48M GEX) - Third support level at 4.83% below
- $50.00 (95.95M GEX) - Psychological support at 6.70% below
Net GEX Analysis: The total call GEX of $1.19B vs put GEX of $527M creates a bullish bias with a net positive gamma environment. This means market makers will likely buy into dips and sell into rallies, creating range-bound behavior in the near term but with an upward bias.
The $54 level is the key battleground - if EEM can break and hold above this massive gamma wall, the path to $55-56 opens up quickly!
🎪 Catalysts
🔮 Upcoming Events
China Economic Stimulus Measures
- Chinese authorities implementing monetary policy easing with MSCI China Index at attractive 9.54x earnings
- Government pivot to domestic consumption from export-based growth model
- Infrastructure and technology sector support continuing through Q4 2025
Federal Reserve Rate Cutting Cycle
- Fed entered rate cutting cycle, historically supportive for EM assets
- Lower U.S. rates drive capital flows toward higher-yielding EM assets
- Dollar mean reversion could provide additional tailwind
TSMC AI Chip Demand (11.68% of EEM)
- TSMC's leadership in 3nm and 5nm production driving AI infrastructure buildout
- Advanced chip manufacturing creating pricing power and margin expansion
- Geographic diversification to U.S. and Japan reducing geopolitical risk
Supply Chain Diversification
- Vietnam, Indonesia, India benefiting from manufacturing shifts away from China
- Emerging markets developing stronger intra-regional trade networks
✅ Recently Completed
Strong Q3 2025 Performance
- EEM delivered 26.8% return over past six months, significantly outperforming developed markets
- September performance of +7.2% showing accelerating momentum
Financial Services Modernization in India
- HDFC Bank and ICICI Bank (key holdings) benefiting from digital transformation
- Rising middle class driving banking penetration across emerging markets
🎲 Price Targets & Probabilities
Based on gamma levels, technical setup, and catalyst timing:
🚀 Bull Case (45% chance)
Target: $56-58
Path to Success:
- Break above $54 gamma wall on continued China stimulus news
- Fed rate cuts accelerate dollar weakness
- TSMC earnings surprise on AI chip demand
- Technical breakout from YTD range
Catalysts Supporting:
- Chinese stimulus measures gaining traction
- Strong momentum already in place (+28.3% YTD)
- Net gamma bias is bullish
Why the Deep ITM Calls Make Sense: These calls have huge profit potential if EEM reaches $56-58 by March 2026. The March $46 calls would be worth $10-12 (up from $8.30), delivering 20-45% returns on leveraged capital.
😐 Base Case (35% chance)
Target: $52-55 range
Path to Success:
- EEM consolidates between $53 support and $55 resistance
- Mixed economic data from China
- Range-bound trading as markets digest geopolitical risks
Why This Still Works: The deep ITM calls maintain their intrinsic value in this range. The $45 November calls worth $7+ at $52, and the $46 March calls worth $6+ at $52. Limited downside with gamma support at $53 and $52.
😰 Bear Case (20% chance)
Target: $48-51
Path to Failure:
- Tariff escalation with U.S. tariffs reaching 18.2% average
- Potential 100% tariffs on Chinese imports creates market shock
- Dollar strength resurges on safe-haven demand
- China stimulus disappoints
Risk to the Trade: At $48, the November $45 calls only worth $3 (66% loss from entry), and March $46 calls worth $2 (76% loss). However, both still have intrinsic value providing some downside protection vs outright stock purchase.
💡 Trading Ideas
🛡️ Conservative: Follow the Big Money (Smaller Size)
Play: Buy deep ITM calls with longer duration
Buy EEM March 2026 $48 calls (75% in-the-money)
Cost: ~$6.00 per contract ($600 per contract) Risk: Limited to premium paid Reward: Moves ~0.80 delta with the ETF, less aggressive than $46 strike
Why this works:
- Still gets leveraged exposure with built-in protection
- Longer duration (5+ months) handles volatility
- High delta means participates in upside
- Less capital at risk than the whale trade
⚖️ Balanced: Call Spread for Defined Risk
Play: Bull call spread targeting the gamma resistance
Buy EEM January 2026 $53 calls / Sell $56 calls
Cost: ~$1.50 net debit per spread Max Risk: $1.50 per spread ($150) Max Reward: $3.00 per spread ($300) = 100% return Breakeven: $54.50
Why this works:
- Defined risk-reward (1:2 ratio)
- Targets the $56 gamma resistance level
- Benefits if EEM breaks through $54 wall
- Less capital required than deep ITM calls
🚀 Aggressive: Replicate the Whale Trade
Play: Buy deep ITM calls for leveraged exposure
Buy EEM March 2026 $46 calls (same as the whale!)
Cost: ~$8.30 per contract ($830) Risk: Premium paid Reward: Control 100 shares for $830 vs $5,342 for stock Effective Leverage: ~6.4x leverage on capital
Why this works:
- Following institutional money is rarely wrong
- 5+ months until expiration handles volatility
- High delta (~0.88) moves almost 1:1 with ETF
- Built-in floor at $46 provides downside protection
Position Sizing: If EEM drops to $46, you lose $830. If it rallies to $58, you make $11.70 per contract (141% return). Risk-reward heavily favors the upside here.
⚠️ Risk Factors
Tariff Escalation:
- U.S. tariffs averaging 18.2% by July 2025 creating volatility for trade-dependent economies
- Potential 100% tariffs on Chinese imports would shock EM markets
- Supply chain disruptions could hurt manufacturers
Geopolitical Tensions:
- South China Sea disputes affecting regional stability
- Taiwan semiconductor concentration risk (TSMC is 11.68% of EEM)
- India-China border tensions could flare up
China Economic Slowdown:
- China represents ~25% of EEM holdings
- Chinese stimulus measures need to gain traction to support growth
- Real estate sector stress could spread to broader economy
Dollar Strength:
- EM currencies vulnerable to dollar strength and capital flow reversals
- If Fed pauses rate cuts, dollar could strengthen
- Safe-haven flows during market stress hurt EM assets
Time Decay on Options:
- November calls have only 39 days until expiration
- If EEM stays flat or drops, theta decay accelerates
- March calls have better time cushion but still decay
🎯 The Bottom Line
Real talk: This $17.1M deep ITM call position is institutional smart money making a huge emerging markets bet. They're not buying lottery tickets - they're getting leveraged long exposure with built-in downside protection. The gamma data backs up their thesis with bullish net positioning and clear support at $53.
If you own EEM: Consider adding to your position on any dip to $52-53 support levels. The technical trend is your friend here, and smart money is betting it continues.
If you're watching: The $54 gamma wall is your signal - if EEM breaks and holds above $54, that's confirmation to get involved. Use the March 2026 calls for time cushion if entering.
If you're bearish: Wait for a confirmed breakdown below $52 support before fading this move. Fighting $17.1M of institutional conviction is rarely profitable!
Mark your calendar: Watch for China stimulus announcements and Fed rate decision dates - these are the binary catalysts that will move EEM quickly. The November calls are a short-term bet (39 days), but the March calls have room to run through Q1 2026.
Disclaimer: Options trading involves substantial risk. This analysis is for educational purposes only and not financial advice. Emerging markets carry additional risks including currency volatility, geopolitical instability, and less liquidity. Past performance doesn't guarantee future results.
About EEM: The iShares MSCI Emerging Markets ETF provides exposure to large and mid-cap companies across emerging markets with $20.8B in assets, offering diversified access to high-growth economies at attractive P/E ratio of 14.29.