EEM $22M Short Call - Institutions Betting Emerging Markets Peak Here!
January 15, 2026 | Unusual Activity Detected
The Quick Take
Someone just sold $22 MILLION worth of EEM call options this morning at 10:02:41! This monster trade wrote 116,500 contracts of $58 strike calls expiring March 20th - collecting massive premium while betting EEM stays below $58 through Q1 2026. With EEM up +39% in 2025 and hitting fresh 52-week highs near $58.30, smart money is saying "this is as good as it gets for emerging markets." Translation: Institutions are capping their upside here because they think the rally is done!
ETF Overview
iShares MSCI Emerging Markets ETF (EEM) is one of the most widely traded emerging markets ETFs, providing exposure to large and mid-cap companies across 24 developing countries:
- AUM: $23.4 Billion
- ETF Type: Broad Emerging Markets Equity
- Expense Ratio: 0.72%
- Current Price: $58.29 (near 52-week high of $58.63)
- Number of Holdings: 1,495 stocks across China (31%), Taiwan (19%), India (15%), South Korea (11%), Brazil (4%)
- Top Holdings: TSMC (12.3%), Tencent (4.8%), Samsung (4.2%), Alibaba (3.2%), SK Hynix (2.6%)
- Dividend Yield: 2.10% - 2.67%
The Option Flow Breakdown
The Tape (January 15, 2026 @ 10:02:41):
| Time | Symbol | Side | Buy/Sell | Type | Expiration | Premium | Strike | Volume | OI | Size | Spot | Option Price |
|---|---|---|---|---|---|---|---|---|---|---|---|---|
| 10:02:41 | EEM | MID | SELL | CALL $58 | 2026-03-20 | $22M | $58 | 117K | 32K | 116,500 | $58.10 | $1.85 |
What This Actually Means
This is an institutional income play betting on a range-bound or declining EEM! Here's what went down:
- Massive premium collected: $22M ($1.85 per contract x 116,500 contracts)
- Strike at the money: $58 strike is essentially where EEM is trading NOW - this trader is saying "this is the top"
- Strategic timing: March 20th is Triple Witch expiration - 64 days out captures potential Fed rate decisions, China earnings season, and geopolitical developments
- Size matters: 116,500 contracts represents 11.65 million shares worth ~$680M notional exposure
- Vol/OI Ratio of 3.66x: Volume blew past open interest - this is NEW positioning, not a roll
What's really happening here:
This institution either (1) already holds millions of EEM shares and is writing covered calls to generate income while capping upside, or (2) is making a naked short call bet that EEM has peaked after the +39% 2025 rally. Either way, they're willing to sell shares at $58 if called away - meaning they think $58 is fair value or slightly overvalued at this point.
Unusual Score: EXTREMELY UNUSUAL (Z-Score: 22.37) - This is a massive trade representing 3.66x the existing open interest. We're talking about one of the largest single EEM options trades you'll see in months. The confidence level is MEDIUM because it's a standalone short call (not part of a complex spread), suggesting this is either covered call writing on a huge position or a high-conviction bearish bet.
Technical Setup / Chart Check-Up
YTD Performance Chart
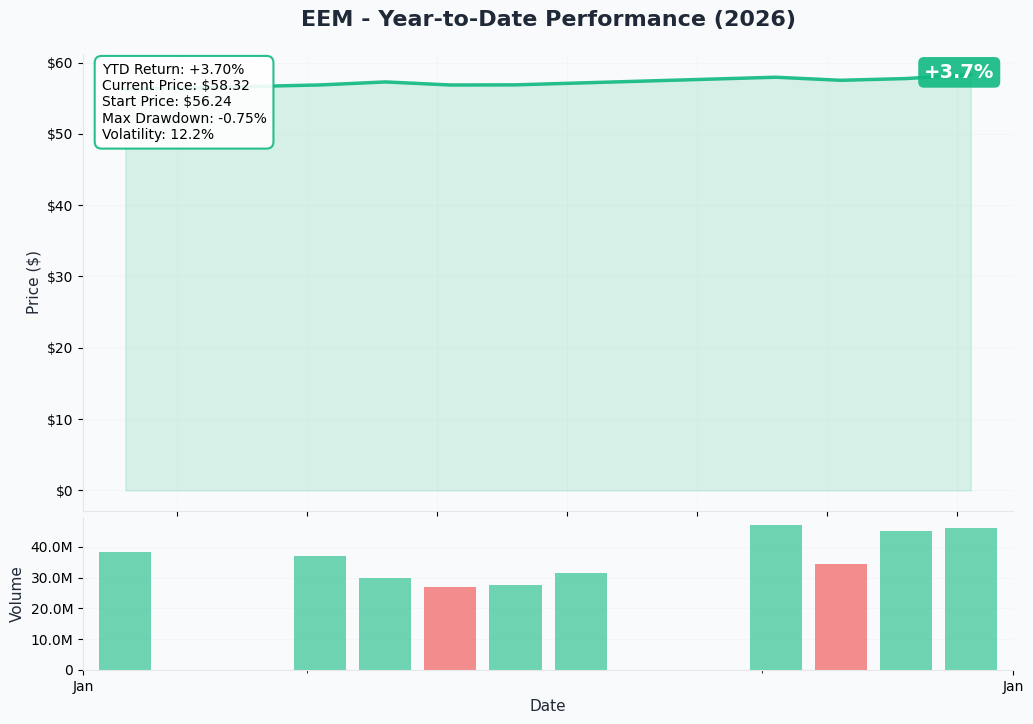
EEM is having a standout year - up +4.44% YTD in 2026 after crushing it with +39% returns in 2025. The fund hit a new 52-week high of $58.63 on January 12th according to Daily Political. The structural headwinds that kept emerging markets out of favor are finally reversing per 24/7 Wall St.
Key observations:
- Rally from the depths: EEM traded as low as $38.19 in 2025 before rocketing to current levels
- Momentum strong: Three consecutive months of gains heading into 2026
- Near resistance: Trading just below 52-week high suggests potential exhaustion
- Volume patterns: Institutional flows have turned positive with +$849M over past month per ETF Database
Gamma-Based Support & Resistance Analysis
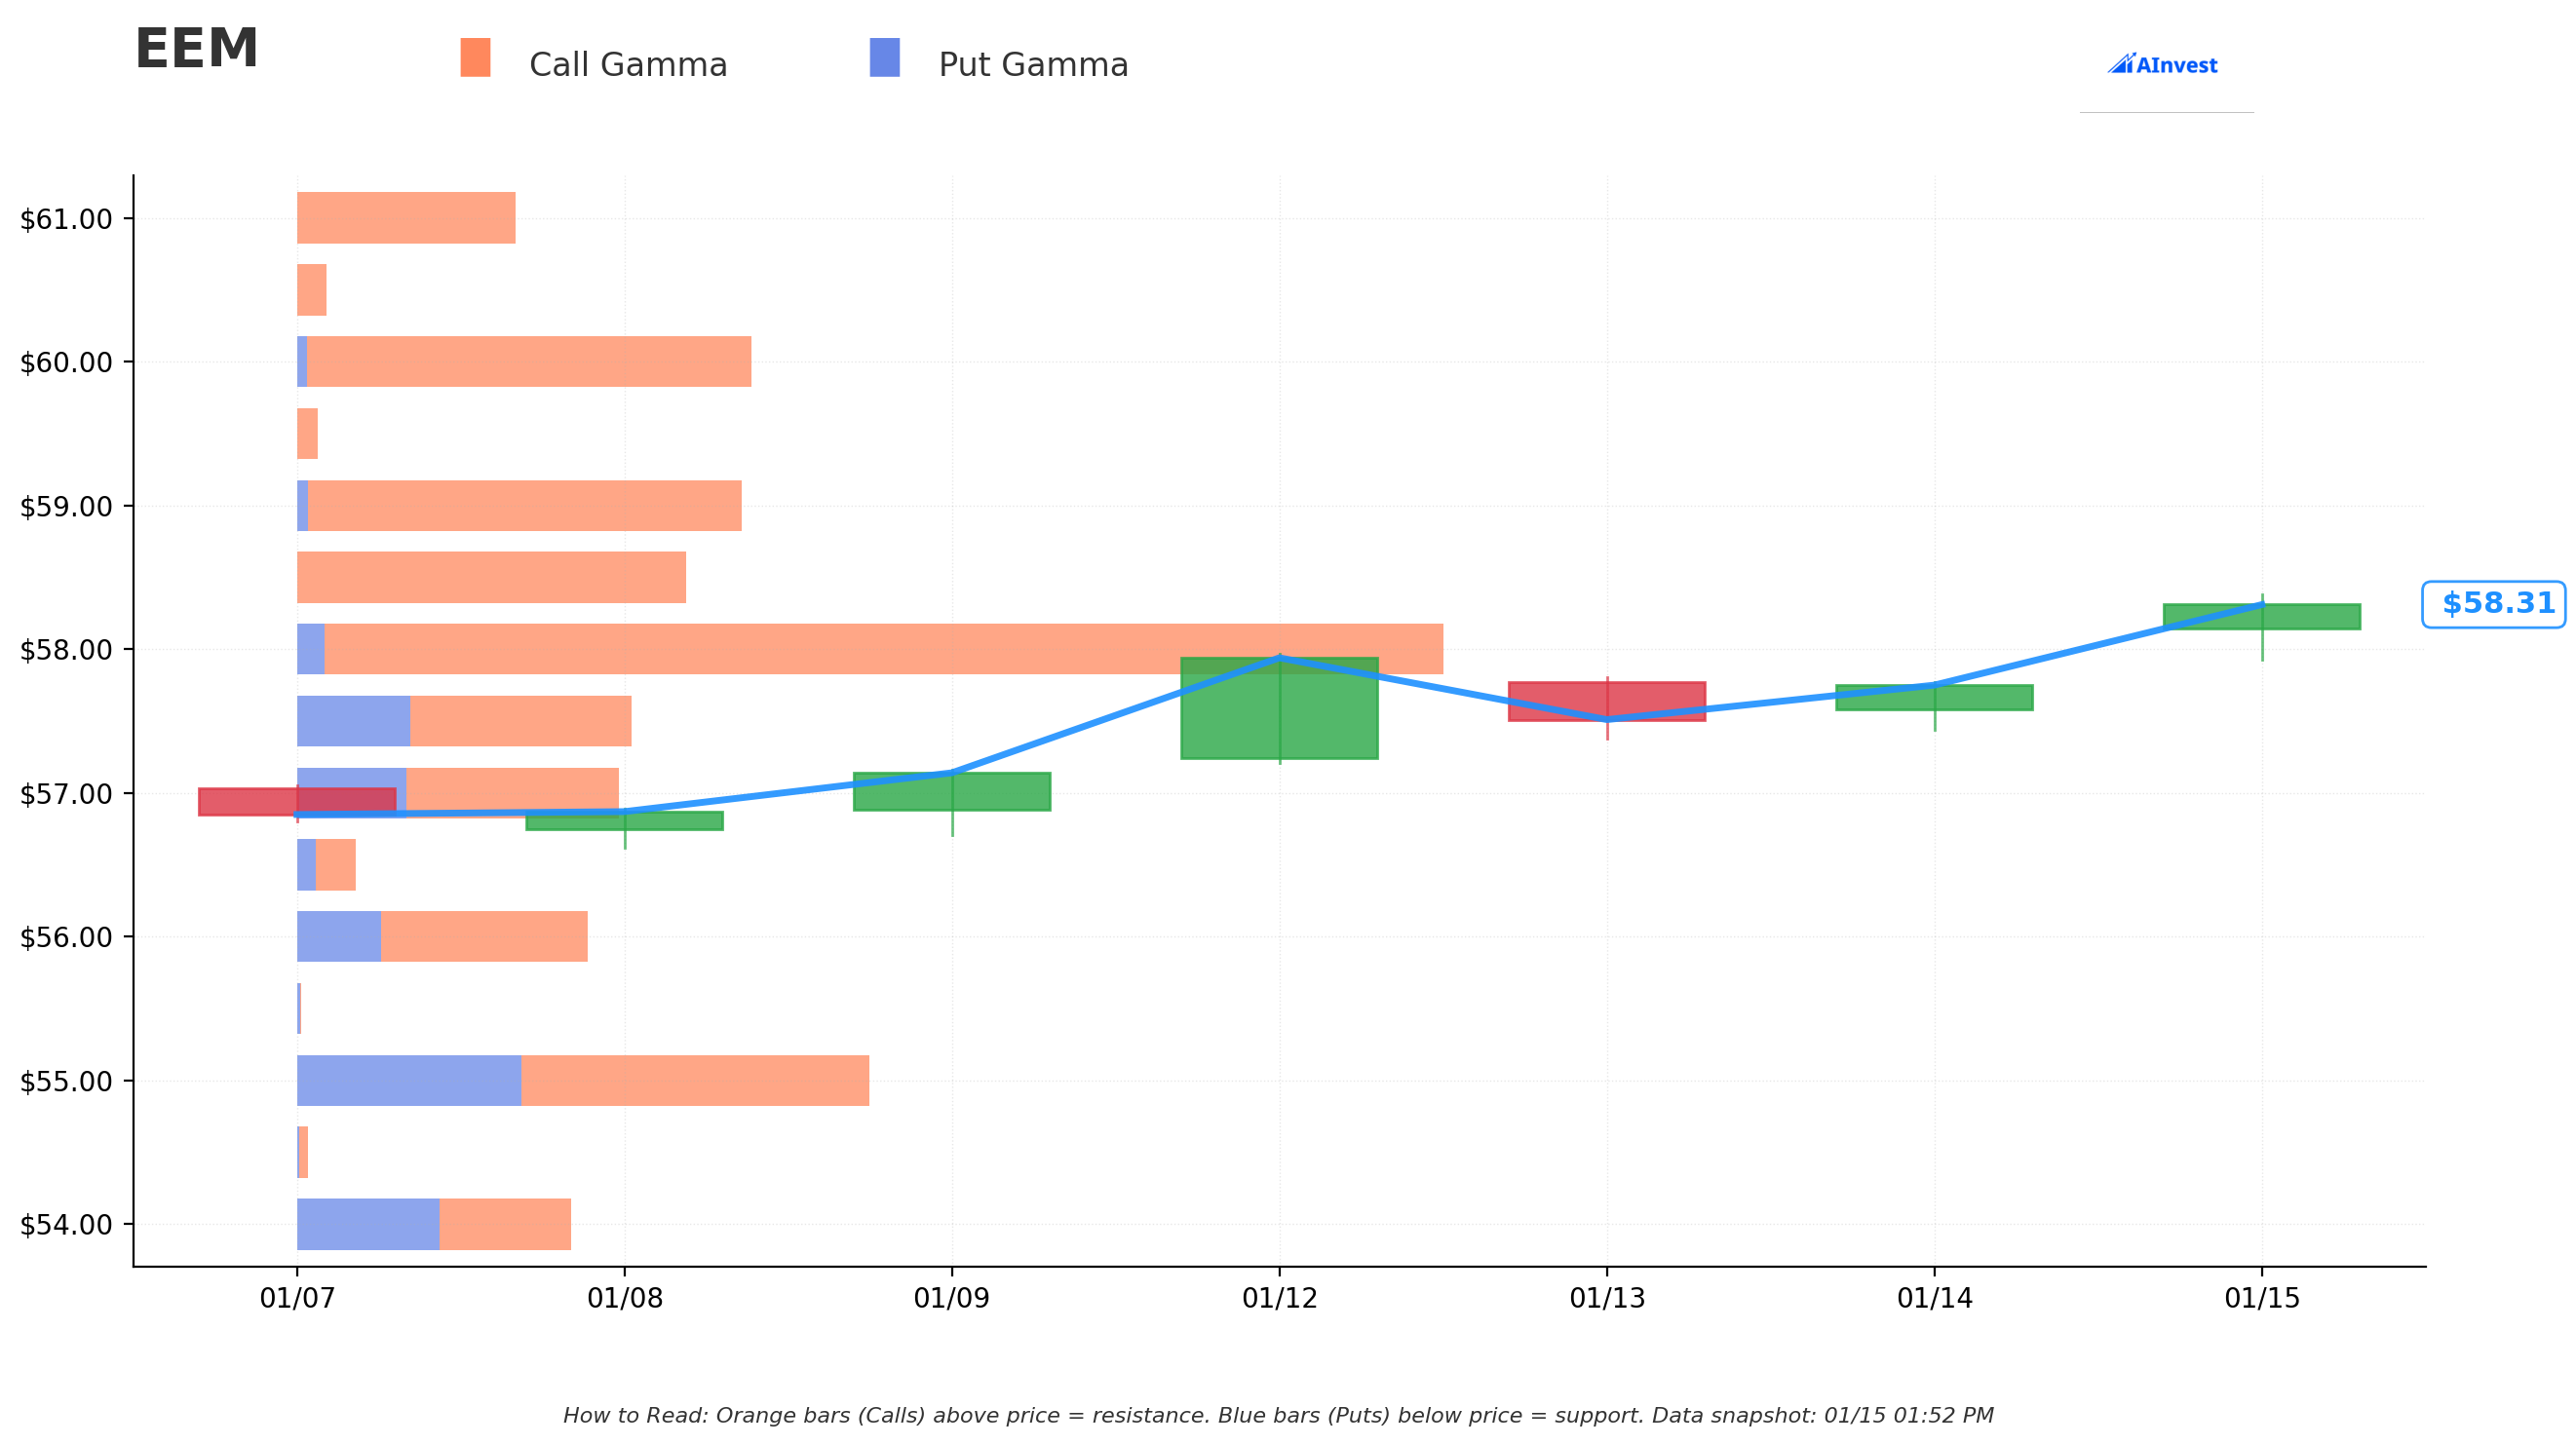
Current Price: $58.29
The gamma exposure map reveals critical price magnets and barriers that will govern near-term price action:
Support Levels (Put Gamma Below Price):
- $58.00 - Immediate support with 209.8B total gamma exposure (strongest nearby floor!)
- $57.50 - Secondary support at 62.3B gamma (dealers will buy dips here)
- $57.00 - Third support tier with 58.1B gamma
- $56.00 - Extended support at 61.6B gamma
- $55.00 - Major structural floor with 108.6B gamma (this is THE LINE IN THE SAND)
- $54.00 - Deep support at 50.4B gamma
Resistance Levels (Call Gamma Above Price):
- $58.50 - Immediate ceiling with 68.7B gamma (just 0.35% overhead)
- $59.00 - Secondary resistance at 81.3B gamma (1.2% above current)
- $60.00 - Major ceiling with 82.7B gamma (2.9% above current)
- $65.00 - Extended upside target at 45.0B gamma (11.5% rally required)
What this means for traders:
EEM is trading right at the $58 strike where massive gamma is concentrated. The call writer struck EXACTLY at this level because they see it as a natural ceiling. Breaking above $60 requires sustained buying to overcome dealer hedging activity. The $55-58 range has strong put gamma support - the call seller is betting EEM stays in this range.
Net GEX Bias: Bullish (829.7B call gamma vs 287.1B put gamma) - Overall positioning remains tilted bullish, but immediate price action is constrained near $58 resistance where this short call was struck.
Implied Move Analysis
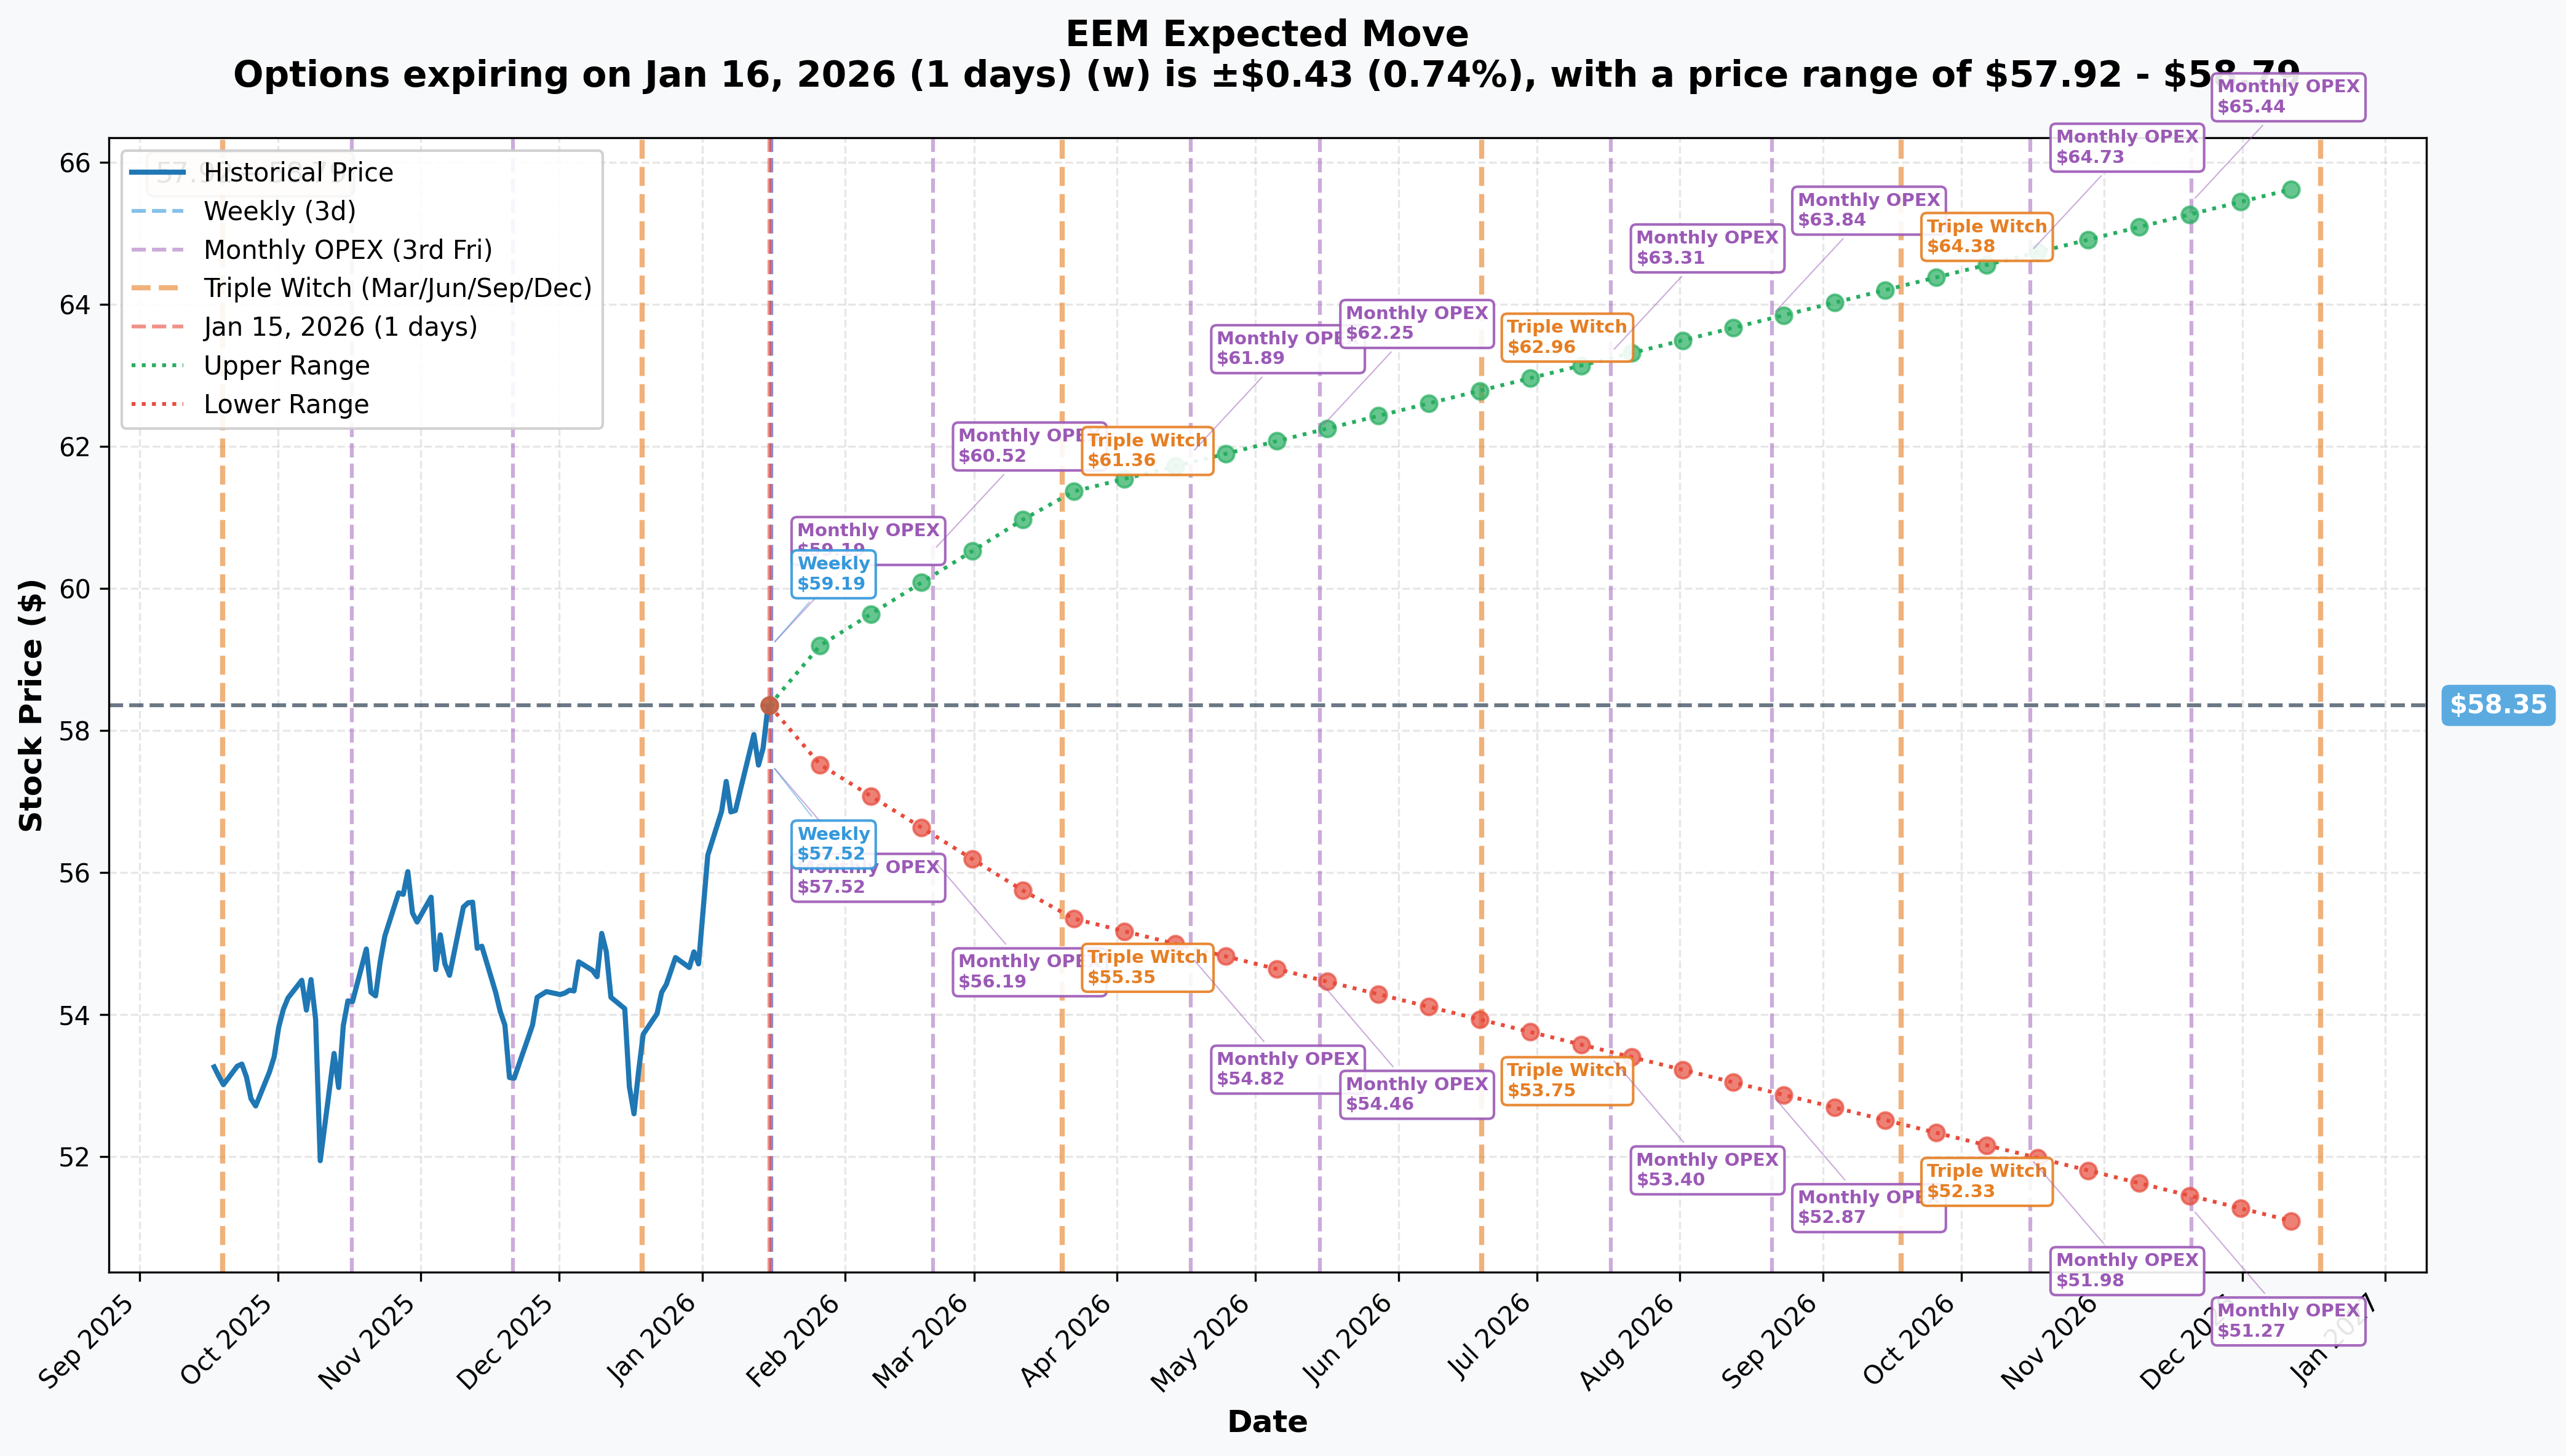
Options market pricing for upcoming expirations:
- Weekly (Jan 16 - 1 day): +/-0.74% (+/-$0.43) - Range: $57.92 - $58.79
- Monthly OPEX (Feb 20): +/-3.7% (+/-$2.17) - Range: $56.19 - $60.52
- Triple Witch (Mar 20 - THIS TRADE!): +/-5.1% (+/-$2.97) - Range: $55.38 - $61.33
- LEAPS (Dec 18): +/-12.64% (+/-$7.37) - Range: $50.98 - $65.73
Translation for regular folks:
Options traders are pricing in a relatively modest 5.1% move (+/-$3) through the March expiration when this $22M trade expires. The implied range of $55.38 to $61.33 means the market thinks there's roughly a 68% chance EEM stays within this band.
The call seller's thesis: At $58 strike with $1.85 premium collected, they profit if EEM stays below $59.85 by March 20th. That's the UPPER END of the implied move range - essentially betting on the "normal" outcome rather than a continued rally. Smart positioning.
Catalysts
Recent Catalysts (Already Happened)
TSMC Q4 2025 Earnings Blowout - January 15, 2026
TSMC (12.3% of EEM) just reported this morning, delivering a 35% increase in fourth-quarter profit per CNBC. Key results:
- Revenue: NT$1.046 trillion ($33.73B) - beat estimates
- Net Income: NT$505.74 billion - beat estimates
- 2026 Guidance: 30% revenue growth, $52-56B capex (up from $40.9B in 2025)
This positive catalyst is ALREADY in the price - the call seller is betting "good news is priced in."
China Policy Pivot - December 2025
China's Politburo announced moderately loose monetary policy for the first time since 2010 per Nasdaq:
- Budget deficit raised to 4% of GDP (highest in three decades)
- 50 basis point RRR cut
- 20 basis point interest rate cut
- President Xi promised more proactive macro policies per CNBC
Korean Memory Chip Surge - January 2026
Samsung and SK Hynix have rallied hard per CNBC:
- SK Hynix YTD: +11.5%
- Samsung YTD: +15.9%
- DRAM prices expected up 40% through Q2 2026 per Counterpoint Research
U.S. Dollar Weakness - 2025
The dollar tumbled 9% in 2025 - its worst year since 2017 per The National. This directly boosted EEM returns. Morgan Stanley expects weakness to continue through mid-2026 per AllianceBernstein.
Upcoming Catalysts (Next 64 Days to Expiration)
Tencent & Alibaba Q4 Earnings - February/March 2026
Key EEM holdings report soon per MarketBeat:
- Alibaba: February 2026 - Cloud growth and Ant Group IPO updates
- Tencent: March 2026 - EPS consensus $4.5, +13.6% revision over past 60 days
Franklin Templeton projects 15% earnings growth for MSCI China in 2026 per 24/7 Wall St.
Federal Reserve Rate Decisions - Q1 2026
Expected Fed timeline per iShares and KPMG:
- Current rate: 3.50%-3.75%
- Expected 2026 cuts: 2-3 cuts projected
- KPMG expects first cut in June 2026
- Year-end target: 2.75%-3.0%
Ant Group IPO 2.0 - Expected H1-H2 2026
The most anticipated catalyst for 2026 is Ant Group's potential Hong Kong listing per NAI 500. This would be a massive liquidity event for Alibaba (3.2% of EEM).
Brazil Rate Cuts - Expected Q1 2026
Brazil shows promise with moderating inflation per VanEck:
- Inflation forecast: Decline from 5.6% in 2025 to 4.4% in 2026
- October 2026 presidential election could spark 100% rally if pro-business candidate wins
Price Targets & Probabilities
Using gamma levels, implied move data, and the short call positioning, here are the scenarios through March 20th expiration:
Bull Case (20% probability)
Target: $61-$65
How we get there:
- China stimulus drives consumer recovery beyond expectations
- TSMC and Samsung earnings continue beating, AI demand surprises higher
- Fed cuts rates earlier than June, dollar weakens another 5%+
- Tencent/Alibaba Q4 earnings crush estimates with strong cloud growth
- India GDP growth exceeds 7.4% forecast, drawing additional inflows
- Breakout above $60 gamma resistance triggers momentum buying to $65 (implied move upper range)
Probability assessment: Only 20% because EEM is already at 52-week highs after +39% 2025 rally. Implied move upper bound of $61.33 suggests market doesn't see significant upside. The $22M short call at $58 by smart money is a strong signal that institutions see limited upside potential from current levels.
Short Call P&L in Bull Case:
- EEM at $63 on March 20: Calls worth $5.00, loss = -$3.15/contract x 116,500 = -$36.7M loss
- EEM at $65 on March 20: Calls worth $7.00, loss = -$5.15/contract x 116,500 = -$60.0M loss
Base Case (55% probability)
Target: $55-$59 range (CHOPPY CONSOLIDATION)
Most likely scenario:
- EEM digests massive 2025 gains, consolidates in trading range
- China stimulus provides support but structural property issues cap upside per IMF
- TSMC earnings already priced in - "sell the news" reaction possible
- Dollar stabilizes rather than continuing weakness
- Fed holds rates steady through Q1, delays cuts to June per KPMG
- EEM oscillates between $57 support and $60 resistance for weeks
- Implied volatility compresses as uncertainty resolves
This is the call seller's target scenario: EEM stays in $55-59 range, $58 calls expire worthless or with minimal value, and they keep the $22M premium. The 5.1% implied move range ($55.38-$61.33) supports this thesis.
Why 55% probability: Stock at technical inflection point near 52-week highs after massive rally. Fundamentals supportive but not explosive. Most catalysts (TSMC earnings, China stimulus) already reflected in price. Market needs new positive surprises to break higher.
Short Call P&L in Base Case:
- EEM at $57 on March 20: Calls expire worthless, profit = +$1.85 x 116,500 = +$21.5M (full premium)
- EEM at $58 on March 20: Calls expire at-the-money, profit = +$1.85 x 116,500 = +$21.5M (full premium)
- EEM at $59 on March 20: Calls worth $1.00, profit = +$0.85 x 116,500 = +$9.9M (partial profit)
Bear Case (25% probability)
Target: $50-$55
What could go wrong:
- China property crisis accelerates - Rhodium Group estimates only 1%-2.5% GDP growth per OMFIF
- U.S.-China trade tensions escalate after midterms per TIME
- Taiwan geopolitical risk flares - TSMC produces 90%+ of advanced chips globally per CNBC
- Dollar reverses course and strengthens on sticky inflation
- Fed delays cuts or signals hawkish tone
- Global risk-off sentiment triggers EM outflows
- Break below $55 gamma support triggers cascade to $50 (implied move lower range)
Critical support levels:
- $58.00: Immediate gamma floor (209.8B) - MUST HOLD or momentum shifts bearish
- $55.00: Major structural support (108.6B gamma) - the LINE IN THE SAND
- $50.98: Implied move lower bound for LEAPS expiration - disaster scenario
Probability assessment: 25% because EEM faces genuine structural risks in China (31% of fund) and geopolitical uncertainty around Taiwan (19% of fund via TSMC). The call seller would LOVE this scenario - they keep full premium plus benefit if holding long stock position that declines.
Short Call P&L in Bear Case:
- EEM at $52 on March 20: Calls expire worthless, profit = +$1.85 x 116,500 = +$21.5M (full premium kept)
- If seller is long stock: Stock loss of -$6 x 11.65M shares = -$70M, but premium offsets some pain
Trading Ideas
Conservative: Wait for Pullback Before Entering
Play: Stay on sidelines until EEM pulls back to $55-56 gamma support zone
Why this works:
- EEM at 52-week highs after +39% 2025 rally - buying here is chasing
- Implied volatility priced at 5.1% through March - options relatively expensive
- The $22M short call signals smart money thinks upside is capped
- Better entry likely at $55-56 where strong gamma support exists (108.6B)
- China structural issues (property, consumer confidence) create uncertainty
- Dollar reversal risk could quickly erase 5-10% of gains
Action plan:
- Set price alert at $55.50 (5% pullback from current levels)
- Look for consolidation and base-building before entry
- Monitor China stimulus implementation and economic data
- Wait for clearer Fed rate cut timing signals
- Consider IEMG or VWO instead - same exposure at 0.09% vs 0.72% expense ratio per Nasdaq
Risk level: Minimal (cash position) | Skill level: Beginner-friendly
Expected outcome: Avoid potential 5-10% drawdown if EEM consolidates. Get better entry with wider margin of safety. Sleep well at night.
Balanced: Covered Call Strategy (Copy The Pros)
Play: Buy 100 shares of EEM and sell 1 March $60 call against it
Structure: Long 100 EEM shares @ $58.29 + Short 1 March 20 $60 Call
Why this works:
- Mirrors the institutional strategy behind the $22M trade
- Collect premium (~$0.80-1.00 for $60 calls) while holding shares
- Still participate in upside to $60 (2.9% above current)
- Premium collected reduces cost basis and provides downside buffer
- 64 days to expiration captures China earnings season and Fed decisions
- Dividend yield (2.1%) adds additional income component
Estimated P&L:
- Pay: $5,829 for 100 shares
- Collect: ~$85-100 premium for $60 call
- Net cost basis: ~$57.35-57.45 per share
- Max profit: ($60 - $57.35) x 100 = ~$265 if called away (4.5% return in 64 days)
- Breakeven: ~$57.35 (2% downside buffer from entry)
Entry timing:
- Can enter now if bullish on EM thesis long-term
- Better entry on pullback to $56-57 zone
- Avoid if EEM already above $59 (limited call premium)
Position sizing: Allocate 3-5% of portfolio to this position (emerging markets exposure)
Risk level: Moderate (defined upside, stock ownership risk) | Skill level: Intermediate
Aggressive: Put Credit Spread on Support Zone
Play: Sell put spread at gamma support to collect premium if EEM holds
Structure: Sell $56 Put / Buy $54 Put (March 20 expiration)
Why this could work:
- $56 strike sits at major gamma support (61.6B)
- $54 strike below deep support (50.4B gamma)
- Implied move lower bound is $55.38 - selling $56 put means you're betting EEM stays within expected range
- Collect ~$0.50-0.70 credit per spread ($50-70 per contract)
- Defined risk of $2 per spread max loss ($200 per contract)
- Risk/reward approximately 1:3 (risk $1.30-1.50 to make $0.50-0.70)
Why this could blow up (SERIOUS RISKS):
- China property crisis could accelerate, dragging EEM below support
- Geopolitical shock (Taiwan, trade war) could gap EEM down 5-10% overnight
- Fed hawkish surprise could strengthen dollar and hurt EM
- Max loss of $1.30-1.50 per $1 spread if EEM below $54 at expiration
Estimated P&L:
- Collect: ~$0.55 credit per spread
- Max profit: $55 per contract if EEM above $56 at March expiration (100% of credit)
- Max loss: $145 per contract if EEM below $54 (spread width minus credit)
- Breakeven: ~$55.45
Position sizing: Risk only 1-2% of portfolio (this is speculative income play)
Risk level: HIGH (can lose more than you collect) | Skill level: Advanced
Risk Factors
Don't get caught by these potential landmines:
-
China structural issues remain unresolved: Property sector deleveraging, local government debt, and subdued consumer confidence persist despite stimulus per IMF. Rhodium Group's 1%-2.5% GDP growth estimate represents significant downside risk. China represents 31% of EEM - any deterioration hits the fund hard.
-
Taiwan geopolitical concentration: TSMC (12.3% of EEM) supplies over 90% of advanced chips globally. Any escalation in Taiwan straits tension could trigger immediate risk-off selling. TSMC expanding overseas fabs but at diluted margins per CNBC. Combined China/Taiwan exposure of 50% creates vulnerability to regional shocks.
-
Dollar reversal risk: The dollar's 9% decline in 2025 directly boosted EM returns. If U.S. inflation proves sticky or risk-off sentiment triggers dollar strength, EEM could quickly give back 5-10% of gains. Morgan Stanley expects weakness through mid-2026 but currency calls are notoriously difficult per Morningstar.
-
High expense ratio drag: EEM's 0.72% expense ratio vs 0.07%-0.09% for VWO and IEMG represents a meaningful 0.63-0.65% annual performance headwind per Nasdaq. Over 10 years, this compounds to 6-7% of lost returns. Persistent outflows ($7.68B over 3 years) show investors migrating to cheaper alternatives.
-
U.S.-China trade uncertainty: Trade environment remains complex per Rabobank. Tariff impact milder than feared (-0.6pp vs -1.6pp estimated) but midterms approaching could limit new tariffs. Any escalation post-midterms could disrupt supply chains and sentiment.
-
The $22M short call signal: Smart money just sold $22M worth of upside calls at $58 - the current price level. When institutions with superior information and resources are willing to cap their gains at current levels, retail traders should pay attention. This isn't a bearish bet necessarily, but it IS a vote of no confidence in significant further upside through March.
-
Good news already priced in: TSMC earnings beat this morning, China stimulus announced, dollar weakness benefiting EM - these are all in the price after +39% 2025 rally and new 52-week highs. The market needs NEW positive surprises to push higher, and the bar is now elevated.
The Bottom Line
Here's the deal: Someone just sold $22 MILLION worth of EEM call options AT the current price level right as the fund hits 52-week highs. This isn't bearish on emerging markets - it's a statement that the easy money has been made after the +39% 2025 rally, and smart money is now focused on collecting income rather than reaching for more upside.
What this trade tells us:
- Sophisticated player thinks $58 is fair value or slightly overvalued for EEM through March
- They're willing to cap gains at $58 in exchange for $22M of immediate premium
- The timing (right after TSMC earnings beat, China stimulus deployed, new highs) suggests "sell the news" mentality
- Z-score of 22.37 shows this is extremely unusual positioning - not normal hedging activity
This is NOT a "dump everything" signal - it's a "upside is capped, manage expectations" signal.
If you own EEM:
- Consider writing covered calls at $60-61 strikes to generate income while holding
- Set mental stop at $55 (major gamma support) to protect gains
- You've already won with +39% in 2025! Taking some profits here is smart
- Alternative: Consider switching to IEMG or VWO for same exposure at lower cost (0.09% vs 0.72%)
If you're watching from sidelines:
- Wait for pullback to $55-56 zone where gamma support is strongest
- Better risk/reward at 5% lower entry than chasing 52-week highs
- The EM thesis remains valid: dollar weakness, AI semiconductor demand, China stimulus
- But valuations are fair (13.5x P/E) not cheap after massive rally
If you're bullish long-term:
- Consider covered call strategy to generate income while waiting
- Dollar weakness through mid-2026 and Fed rate cuts are legitimate tailwinds
- TSMC AI demand story supports 30% revenue growth per Bloomberg
- Ant Group IPO could be major catalyst for China tech holdings
Key dates to watch:
- January 16 - Monthly/Weekly OPEX (implied move +/-0.74%)
- February 2026 - Alibaba Q4 earnings
- March 2026 - Tencent Q4 earnings
- March 20 - THIS TRADE EXPIRES (Triple Witch, +/-5.1% implied move)
- June 2026 - Expected first Fed rate cut per KPMG
- October 2026 - Brazil presidential election (potential 100% rally catalyst)
Final verdict: EEM's emerging markets story remains compelling - dollar weakness, AI semiconductor demand from TSMC/Samsung, China stimulus, and improving India growth all support the thesis. BUT, at 52-week highs after +39% 2025 returns, the risk/reward no longer favors aggressive new positioning. The $22M institutional short call is a CLEAR signal: smart money is harvesting premium at current levels because they see limited near-term upside.
Be patient. Let the market digest these gains. Look for better entries at $55-56. The emerging markets opportunity will still be there in 2-3 months, and you'll get better prices.
Emerging markets are a marathon, not a sprint. Protect your capital and manage your risk.
Disclaimer: Options trading involves substantial risk of loss and is not suitable for all investors. This analysis is for educational purposes only and not financial advice. Past performance doesn't guarantee future results. The 22.37 Z-score reflects this specific trade's size relative to recent EEM history - it does not imply the trade will be profitable or that you should follow it. Always do your own research and consider consulting a licensed financial advisor before trading. Emerging markets carry additional risks including currency fluctuations, political instability, and less regulatory oversight compared to developed markets.
About iShares MSCI Emerging Markets ETF: EEM provides exposure to large and mid-cap companies across 24 emerging market countries including China, Taiwan, India, South Korea, and Brazil, with $23.4 billion in assets under management and holdings in 1,495 stocks across the technology, financial services, and consumer sectors.