🌏 EEM: $10.9M Bet on Emerging Markets Breakout - Big Money Rolling Into Summer!
📅 February 24, 2026 | 🔥 Unusual Activity Detected
🎯 The Quick Take
Someone just deployed $10.9 MILLION in call options on the iShares MSCI Emerging Markets ETF (EEM) - and the positioning tells a story. We're seeing a classic calendar roll where traders sold near-term March calls while loading up on June positions, signaling confidence that the EM rally has legs well into summer 2026. With EEM up 11.3% YTD while the S&P 500 stays flat, institutional money is clearly chasing this outperformance.
📊 Company Overview
iShares MSCI Emerging Markets ETF (EEM) is one of the largest and most liquid emerging market ETFs, providing exposure to over 1,242 companies across developing economies.
| Metric | Value |
|---|---|
| Current Price | $62.59 |
| 52-Week Range | $38.19 - $62.36 |
| AUM | ~$20-28B |
| Expense Ratio | 0.72% |
| P/E Ratio | 16.56 |
| Exchange | NYSE Arca |
Top Holdings: TSMC (13.1%), Samsung (5.4%), Tencent (3.7%), SK hynix (3.1%), Alibaba (2.8%)
Country Exposure: China (27%), Taiwan (17-18%), India (15-16%), South Korea (12-13%), Brazil (5-6%)
💰 The Option Flow Breakdown
📊 What Just Happened
| Time | Side | C/P | Strike | Expiration | Volume | OI | Size | Premium | Spot | Option Price | Option Symbol |
|---|---|---|---|---|---|---|---|---|---|---|---|
| 12:13:11 | BUY | CALL | $70 | 2026-06-18 | 23K | 61K | 20,000 | $1.3M | $62.81 | $0.64 | EEM20260618C70 |
| 12:13:11 | BUY | CALL | $65 | 2026-06-18 | 73K | 150K | 10,000 | $2.2M | $62.81 | $2.15 | EEM20260618C65 |
| 09:53:26 | SELL | CALL | $62 | 2026-03-20 | 20K | 105K | 12,045 | $2.1M | $62.84 | $1.76 | EEM20260320C62 |
| 09:54:22 | BUY | CALL | $62 | 2026-03-20 | 50K | 105K | 30,000 | $5.3M | $62.36 | $1.76 | EEM20260320C62 |
Total Premium: ~$10.9M across 4 trades
🤓 What This Actually Means
This is textbook institutional positioning with two distinct plays happening:
🔄 The March Roll (Morning Trades):
- Someone SOLD $2.1M of March $62 calls at 09:53
- Then BOUGHT $5.3M of the same March $62 calls just a minute later
- Net result: +$3.2M bullish exposure at the money with 24 days to expiration
🚀 The June Lottery Tickets (Midday):
- BUY $2.2M in June $65 calls (4% OTM) - needs ~$2.50 move to profit
- BUY $1.3M in June $70 calls (12% OTM) - aggressive upside bet
Translation: Big money is betting EEM continues climbing into summer. The March position captures near-term momentum, while the June calls are positioned for a potential breakout above the 52-week high. That $70 strike implies a target of +12% from current levels by mid-June.
📈 Technical Setup
YTD Performance
EEM has been on a tear in 2026, significantly outperforming US equities:
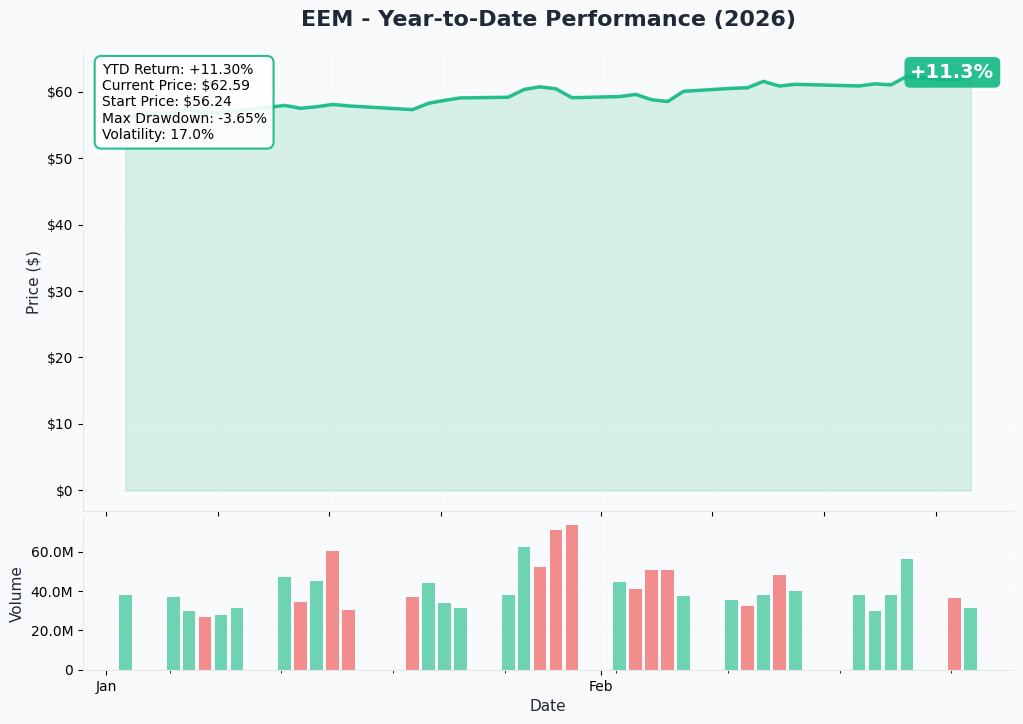
Key Stats from the Chart:
- 📈 YTD Return: +11.3%
- 💵 Current Price: $62.59
- 📊 Start Price: $56.24
- 📉 Max Drawdown: Just -3.65% (very controlled pullbacks)
- 🎢 Volatility: 17.0%
The chart shows steady accumulation since January with minimal drawdowns - exactly the kind of price action that attracts institutional capital. We're trading near 52-week highs ($62.36), and the volume profile shows increasing participation on up days.
Key Technical Levels
| Level | Price | Significance |
|---|---|---|
| Resistance | $65 | June call strike, psychological level |
| Current | $62.59 | At 52-week highs |
| Support 1 | $60 | Round number, recent consolidation |
| Support 2 | $56.24 | YTD starting price |
🎪 Catalysts
📅 Upcoming Events
| Date | Event | Impact |
|---|---|---|
| March 17-18, 2026 | FOMC Meeting + SEP | Rate guidance critical for EM flows |
| March 20, 2026 | Options Expiration | March $62 calls expire |
| April 28-29, 2026 | FOMC Meeting | Rate decision |
| June 16-17, 2026 | FOMC Meeting + SEP | Mid-year policy assessment |
| June 18, 2026 | Options Expiration | June calls expire |
| October 4, 2026 | Brazil First Round Election | Major political catalyst |
✅ Recent Tailwinds (Already Happened)
China Policy Shift (December 2025): China's Politburo announced a major pivot to "moderately loose monetary policy" - the first since 2010. This includes:
- RMB 1 trillion in fiscal stimulus
- 20 bps rate cuts expected
- RMB 800 billion liquidity support for stock market
Fed Rate Stability: The Fed held rates at 3.50%-3.75% at the January meeting following three cuts in 2025. Stable rates support EM currencies and capital flows.
Dollar Weakness: According to Morningstar's analysis, the dollar had its worst year since 2017 in 2025, falling ~9% against a currency basket. This directly benefits EM assets.
Record Inflows: Per ETF Database, EEM attracted $4.1 billion in January 2026 - its strongest month since 2015!
🎲 Price Targets & Probabilities
Based on the options positioning and catalyst calendar:
🐂 Bull Case: $70 by June (Target: +12%)
Probability: 25%
This matches the aggressive June $70 call positioning. Requires:
- Continued dollar weakness
- China stimulus delivering results
- Fed maintaining dovish stance
- No Taiwan escalation
Per OMFIF's outlook, EM earnings are expected to grow 29% in 2026 - double the US rate. If this plays out, $70 is achievable.
⚖️ Base Case: $65-67 by June (Target: +4-7%)
Probability: 50%
The $65 June call strike appears to be the consensus institutional target. This scenario assumes:
- Current momentum continues
- No major geopolitical shocks
- Fed cuts 1x in 2026 as expected
- China stimulus provides moderate lift
With EEM trading at a 40% discount to US equities on forward P/E, valuation expansion alone could drive this move.
🐻 Bear Case: $58-60 (Target: -4-7%)
Probability: 25%
Watch for these warning signs:
- Taiwan semiconductor tensions escalate (TSMC = 13% of fund)
- Dollar reversal on hot inflation data
- China stimulus disappoints
- Brazil election uncertainty accelerates
According to Taiwan Business TOPICS, TSMC produces 90% of the world's advanced chips - any supply chain disruption would hit EEM hard.
💡 Trading Ideas
🛡️ Conservative: "The Momentum Rider"
Buy EEM June 2026 $63 Call
- View Option Chart
- Entry: ~$2.50-3.00
- Max Risk: Premium paid
- Target: $65+ by June
- Why it works: Slightly ITM call captures upside while limiting risk. You're aligned with the institutional flow without the aggressive OTM exposure.
⚖️ Balanced: "Follow the Whales"
Buy EEM June 2026 $65 Call
- View Option Chart
- Entry: ~$2.15 (per the flow)
- Max Risk: Premium paid
- Target: EEM at $68+ for 40%+ gains
- Why it works: This is exactly what the big money bought today. You're riding alongside institutional positioning with a realistic target.
🚀 Aggressive: "The EM Moonshot"
Buy EEM June 2026 $70 Call
- View Option Chart
- Entry: ~$0.64 (cheap lottery ticket)
- Max Risk: Premium paid
- Target: EEM breaks $72 for 3-4x return
- Why it works: At $0.64, you're getting a cheap shot at 12% upside. If EM earnings growth materializes and dollar weakness continues, this could be a multi-bagger. But know this is a long-shot bet.
⚠️ Risk Factors
🌏 Geopolitical Concentration
Taiwan Risk: TSMC alone is 13% of EEM. Per Taiwan Business TOPICS, Trump's 100% tariff threats on chips made outside the US plus Chinese military maneuvers create headline risk.
US-China Trade: According to Deloitte's global outlook, trade tensions remain a major global risk for 2026. Any escalation disrupts supply chains and raises commodity prices.
📉 Market Risks
Carry Trade Crowding: Morningstar warns that Latin American carry trades returned ~30% in 2025 and may be overcrowded. A sentiment reversal could trigger sharp corrections.
Valuation Stretch: Per Siblis Research, EM trailing P/E expanded from 12.18 (end 2022) to ~17 today. The 5-year average is 12.27-14.84, suggesting limited multiple expansion room.
🏛️ Political Uncertainty
Brazil Election (October 2026): Per Bloomberg, Brazil's election is tightening. The Bovespa dropped 4.31% on Bolsonaro nomination news. Brazil is ~5-6% of EEM.
🎯 The Bottom Line
Real talk: This $10.9M EEM options flow is telling us something important - institutional money believes the emerging markets rally has room to run. The calendar roll structure (selling near-term, buying longer-dated) signals conviction beyond just a quick trade.
Here's your game plan:
📈 If you're bullish on EM: The June $65 calls at ~$2.15 offer the best risk/reward. You're aligned with whale positioning and have 4 months for the thesis to play out. The FOMC meetings in March and June are your key catalysts.
👀 If you're watching: Set alerts for EEM breaking $63 (new 52-week high) as a momentum trigger, or $60 as a warning sign. The March 20 expiration will show us if the at-the-money $62 calls were a smart bet.
🐻 If you're cautious: The concentration risk is real - TSMC at 13% means any Taiwan headline can move this ETF sharply. Consider waiting for a pullback to the $60 support area before entering.
Mark your calendar: March 17-18 FOMC meeting is the next major event. If the Fed signals more cuts ahead, EM should catch a bid. If they turn hawkish on inflation, that $60 support will be tested fast.
The bottom line? Big money is betting on a weaker dollar, China stimulus working, and EM earnings growth outpacing the US. The setup is compelling, but don't ignore the risks. Position size accordingly!
Disclaimer: This analysis is for informational purposes only and does not constitute investment advice. Options involve significant risk and are not suitable for all investors. You can lose your entire investment. Always do your own research and consider your risk tolerance before trading.
Track EEM options activity in real-time at Ainvest