🌏 EEM: Someone Just Paid $8.1M to Escape Their Short Call Position!
📅 March 4, 2026 | 🔥 Unusual Activity Detected
🎯 The Quick Take
A massive player just spent $8.1M to buy back 30,000 call contracts on EEM -- that's closing out a short call position covering 3 million shares worth of emerging markets exposure ($176M notional). This trade ate through 94% of the entire open interest at the $58 strike, registering a z-score of 5.44 (extremely unusual -- you might see activity this concentrated a few times per year at most). With China's Two Sessions kicking off today and the FOMC meeting in two weeks, someone decided they didn't want to be short calls heading into a catalyst storm.
💰 The Option Flow Breakdown
📊 What Just Happened
| Detail | Value |
|---|---|
| 🕐 Time | March 4, 10:20:50 AM ET |
| 📌 Ticker | EEM (iShares MSCI Emerging Markets ETF) |
| 📝 Contract | $58 Call, 2026-04-17 expiration |
| 📦 Size | 30,000 contracts (3M shares equivalent) |
| 💵 Premium | $8.1M at $2.71 per contract |
| 🏷️ Spot Price | $58.69 (slightly ITM) |
| 🔄 Direction | Sell-to-Close (buying back short calls) |
| 📊 Volume vs OI | 30,000 vs 32,000 (94% of all open interest!) |
| 🎯 Z-Score | 5.44 -- Extremely Unusual |
🤓 What This Actually Means
Let me break this down. Someone was previously short 30,000 EEM call contracts at the $58 strike -- meaning they had sold those calls, likely as part of a covered call overlay or an outright bearish/neutral bet on emerging markets.
Now they're paying $8.1M to get out.
Why would someone pay that much to close a short call? A few possibilities:
🔑 They see upside risk. If you're short calls and you think the underlying is about to rip higher, you buy them back before they get even more expensive. With China's NPC delivering its Government Work Report tomorrow and the FOMC meeting on March 17-18, the catalyst calendar is loaded.
🔑 They're de-risking after the selloff. EEM dropped 5% on March 3 with 2.2x average volume -- that's capitulation-level selling. When things get that volatile, short call positions can flip from "easy income" to "unlimited liability nightmare" fast.
🔑 This looks institutional. 30,000 contracts is 3 million shares of EEM exposure. At $58.69 per share, that's roughly $176M notional. This isn't a retail trader managing a covered call -- this is likely an asset manager, pension fund, or hedge fund repositioning.
The fact that this trade consumed 94% of the open interest at this strike is the real headline. When nearly all the open interest at a strike gets wiped out in a single transaction, it signals a decisive portfolio repositioning, not tentative adjustments.
📈 Technical Setup / Chart Check-Up
About EEM
The iShares MSCI Emerging Markets ETF by BlackRock tracks the MSCI Emerging Markets Index, giving you exposure to the world's fastest-growing economies in one trade. Top holdings include TSMC, Tencent, Samsung, and Alibaba, with heavy weightings to China (~30%), India, Taiwan, and South Korea.
After rallying ~13% YTD through late February on the back of China's AI/DeepSeek rally and broad EM outperformance, EEM got slammed when the Section 122 universal tariff hit.
YTD Price Action
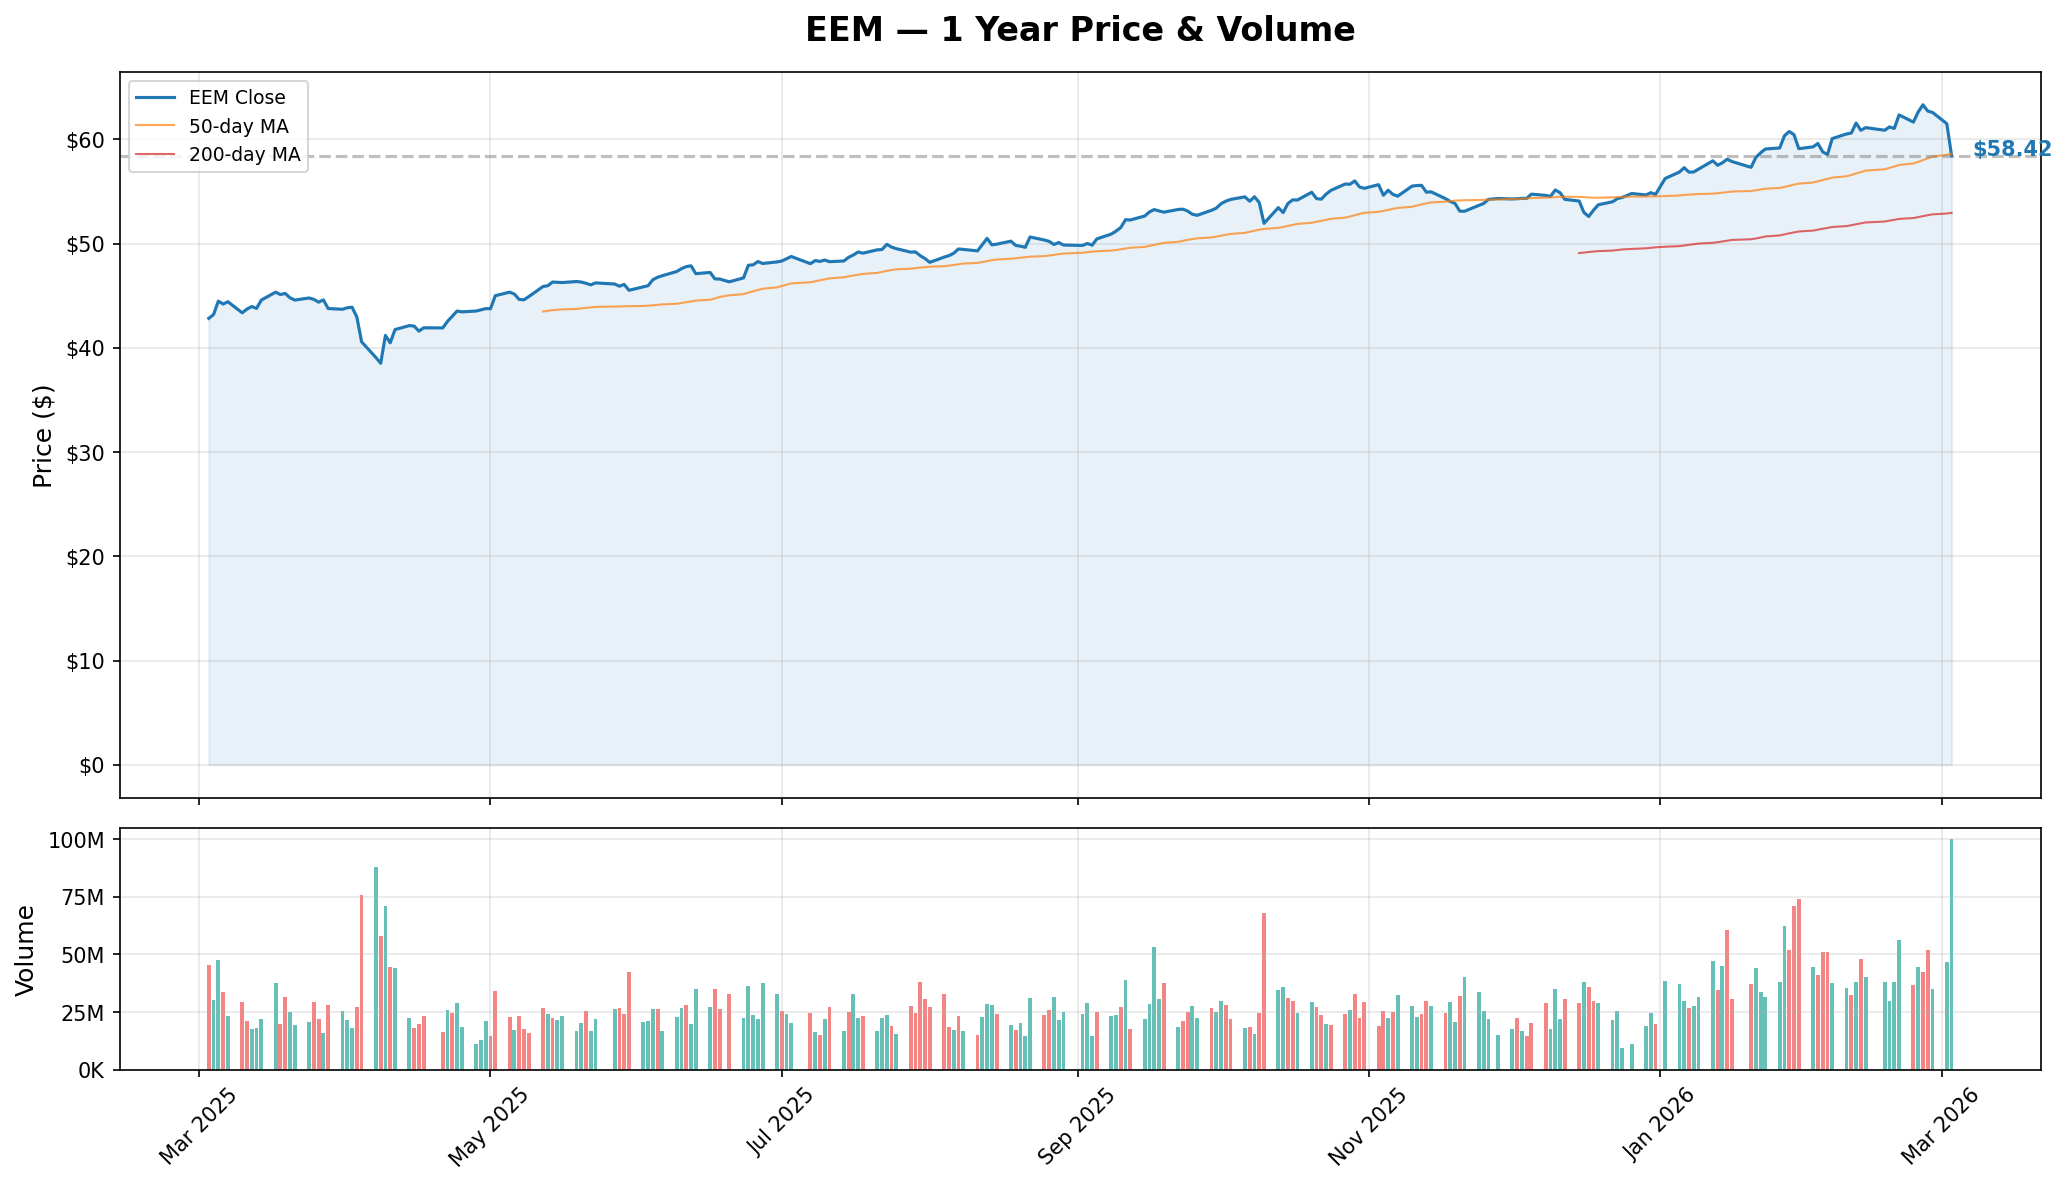
Here's where things stand:
📉 Current Price: $58.69 (intraday March 4) 📉 March 3 Selloff: -5% on 99.7M shares (2.2x normal volume) 📉 52-Week High: $65.96 | 52-Week Low: $38.19 📊 5-Day SMA: $61.70 (price well below -- bearish short-term) 📊 20-Day SMA: $60.99 (price below -- bearish intermediate) 📊 50-Day SMA: $58.63 (price sitting right on it -- this is the line in the sand)
The 50-day moving average at $58.63 is the critical level right now. EEM is essentially testing it today. A close below opens the door to $56.50. A bounce here could signal the March 3 selloff was the washout.
🔵🟠 Gamma-Based Support & Resistance
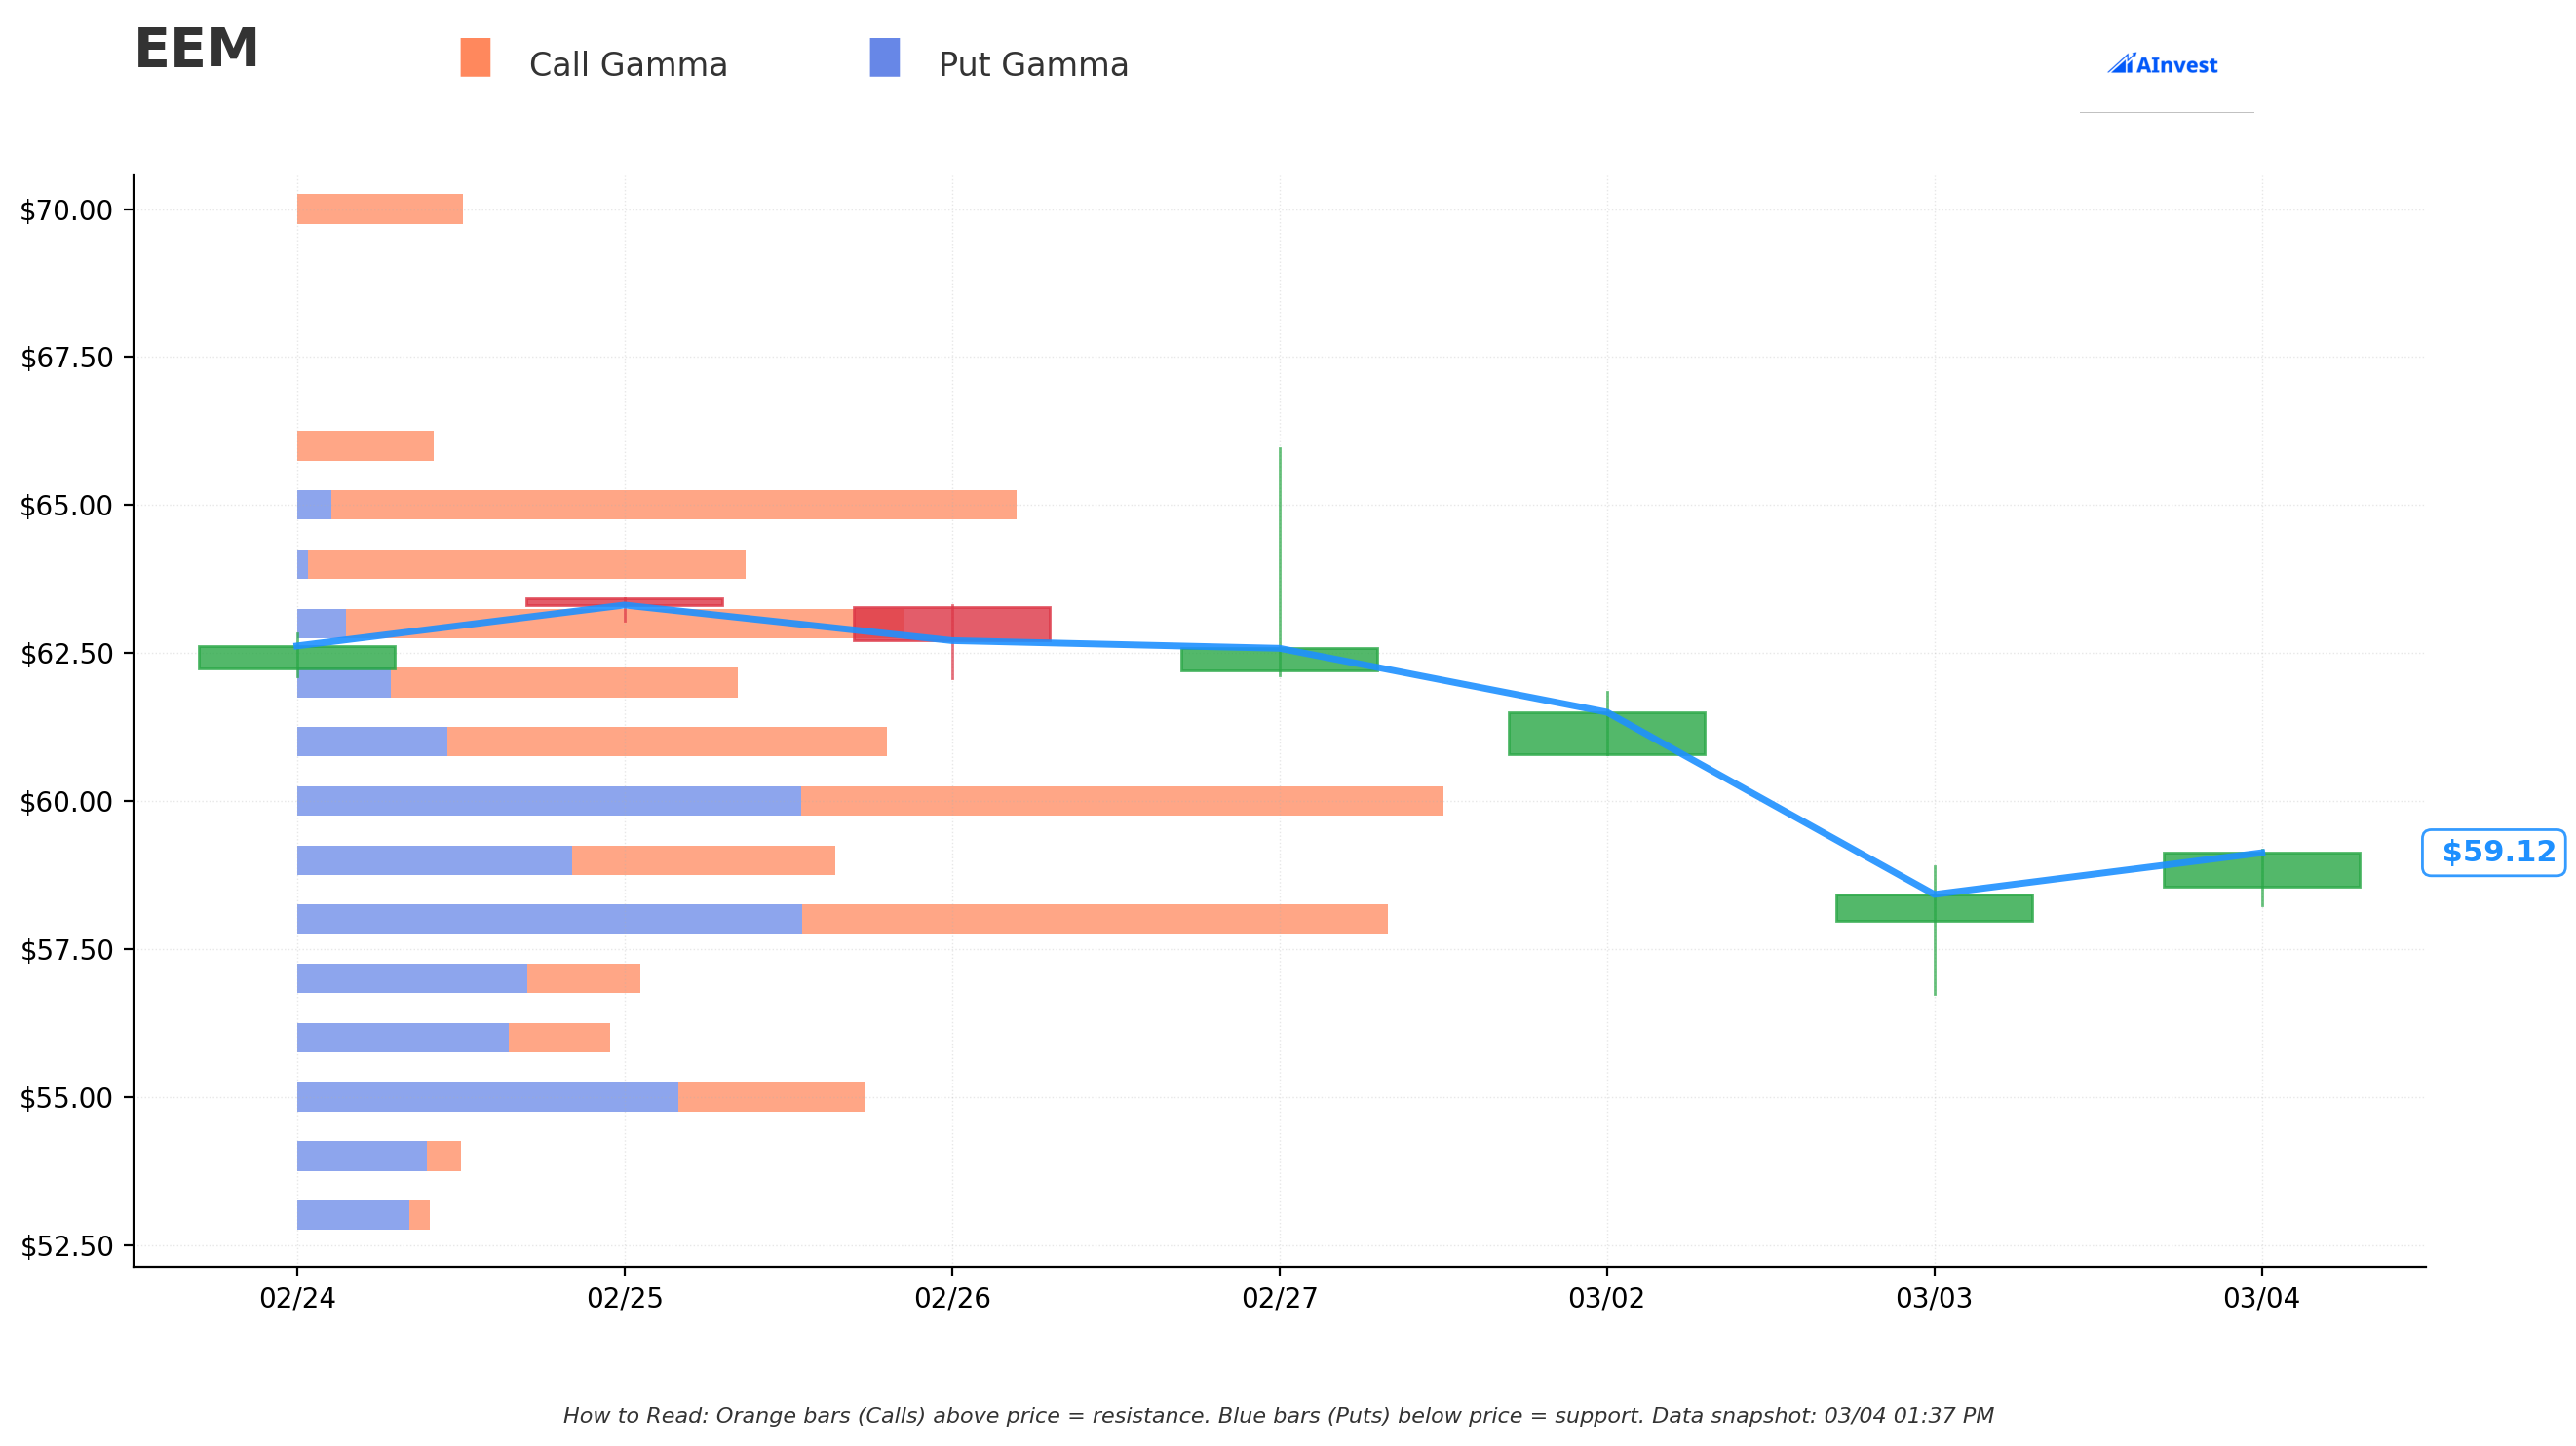
Here's what the options positioning tells us about key levels:
🔵 $55 and $56 -- Put gamma concentration below. These strikes act as downside cushions where market makers would need to buy EEM shares to hedge, potentially slowing a decline.
🟠 $61 and $66 -- Call gamma above the current price. These are the resistance walls where hedging activity could cap a rally.
📌 $50 -- The max gamma strike and a deep support floor. If EEM ever gets close to this level, you'd expect aggressive put hedging flows to provide a floor.
Think of these gamma levels as "speed bumps." The bigger the bar, the more options activity is concentrated there, and the harder it is for the price to blow through.
📐 Implied Move Analysis
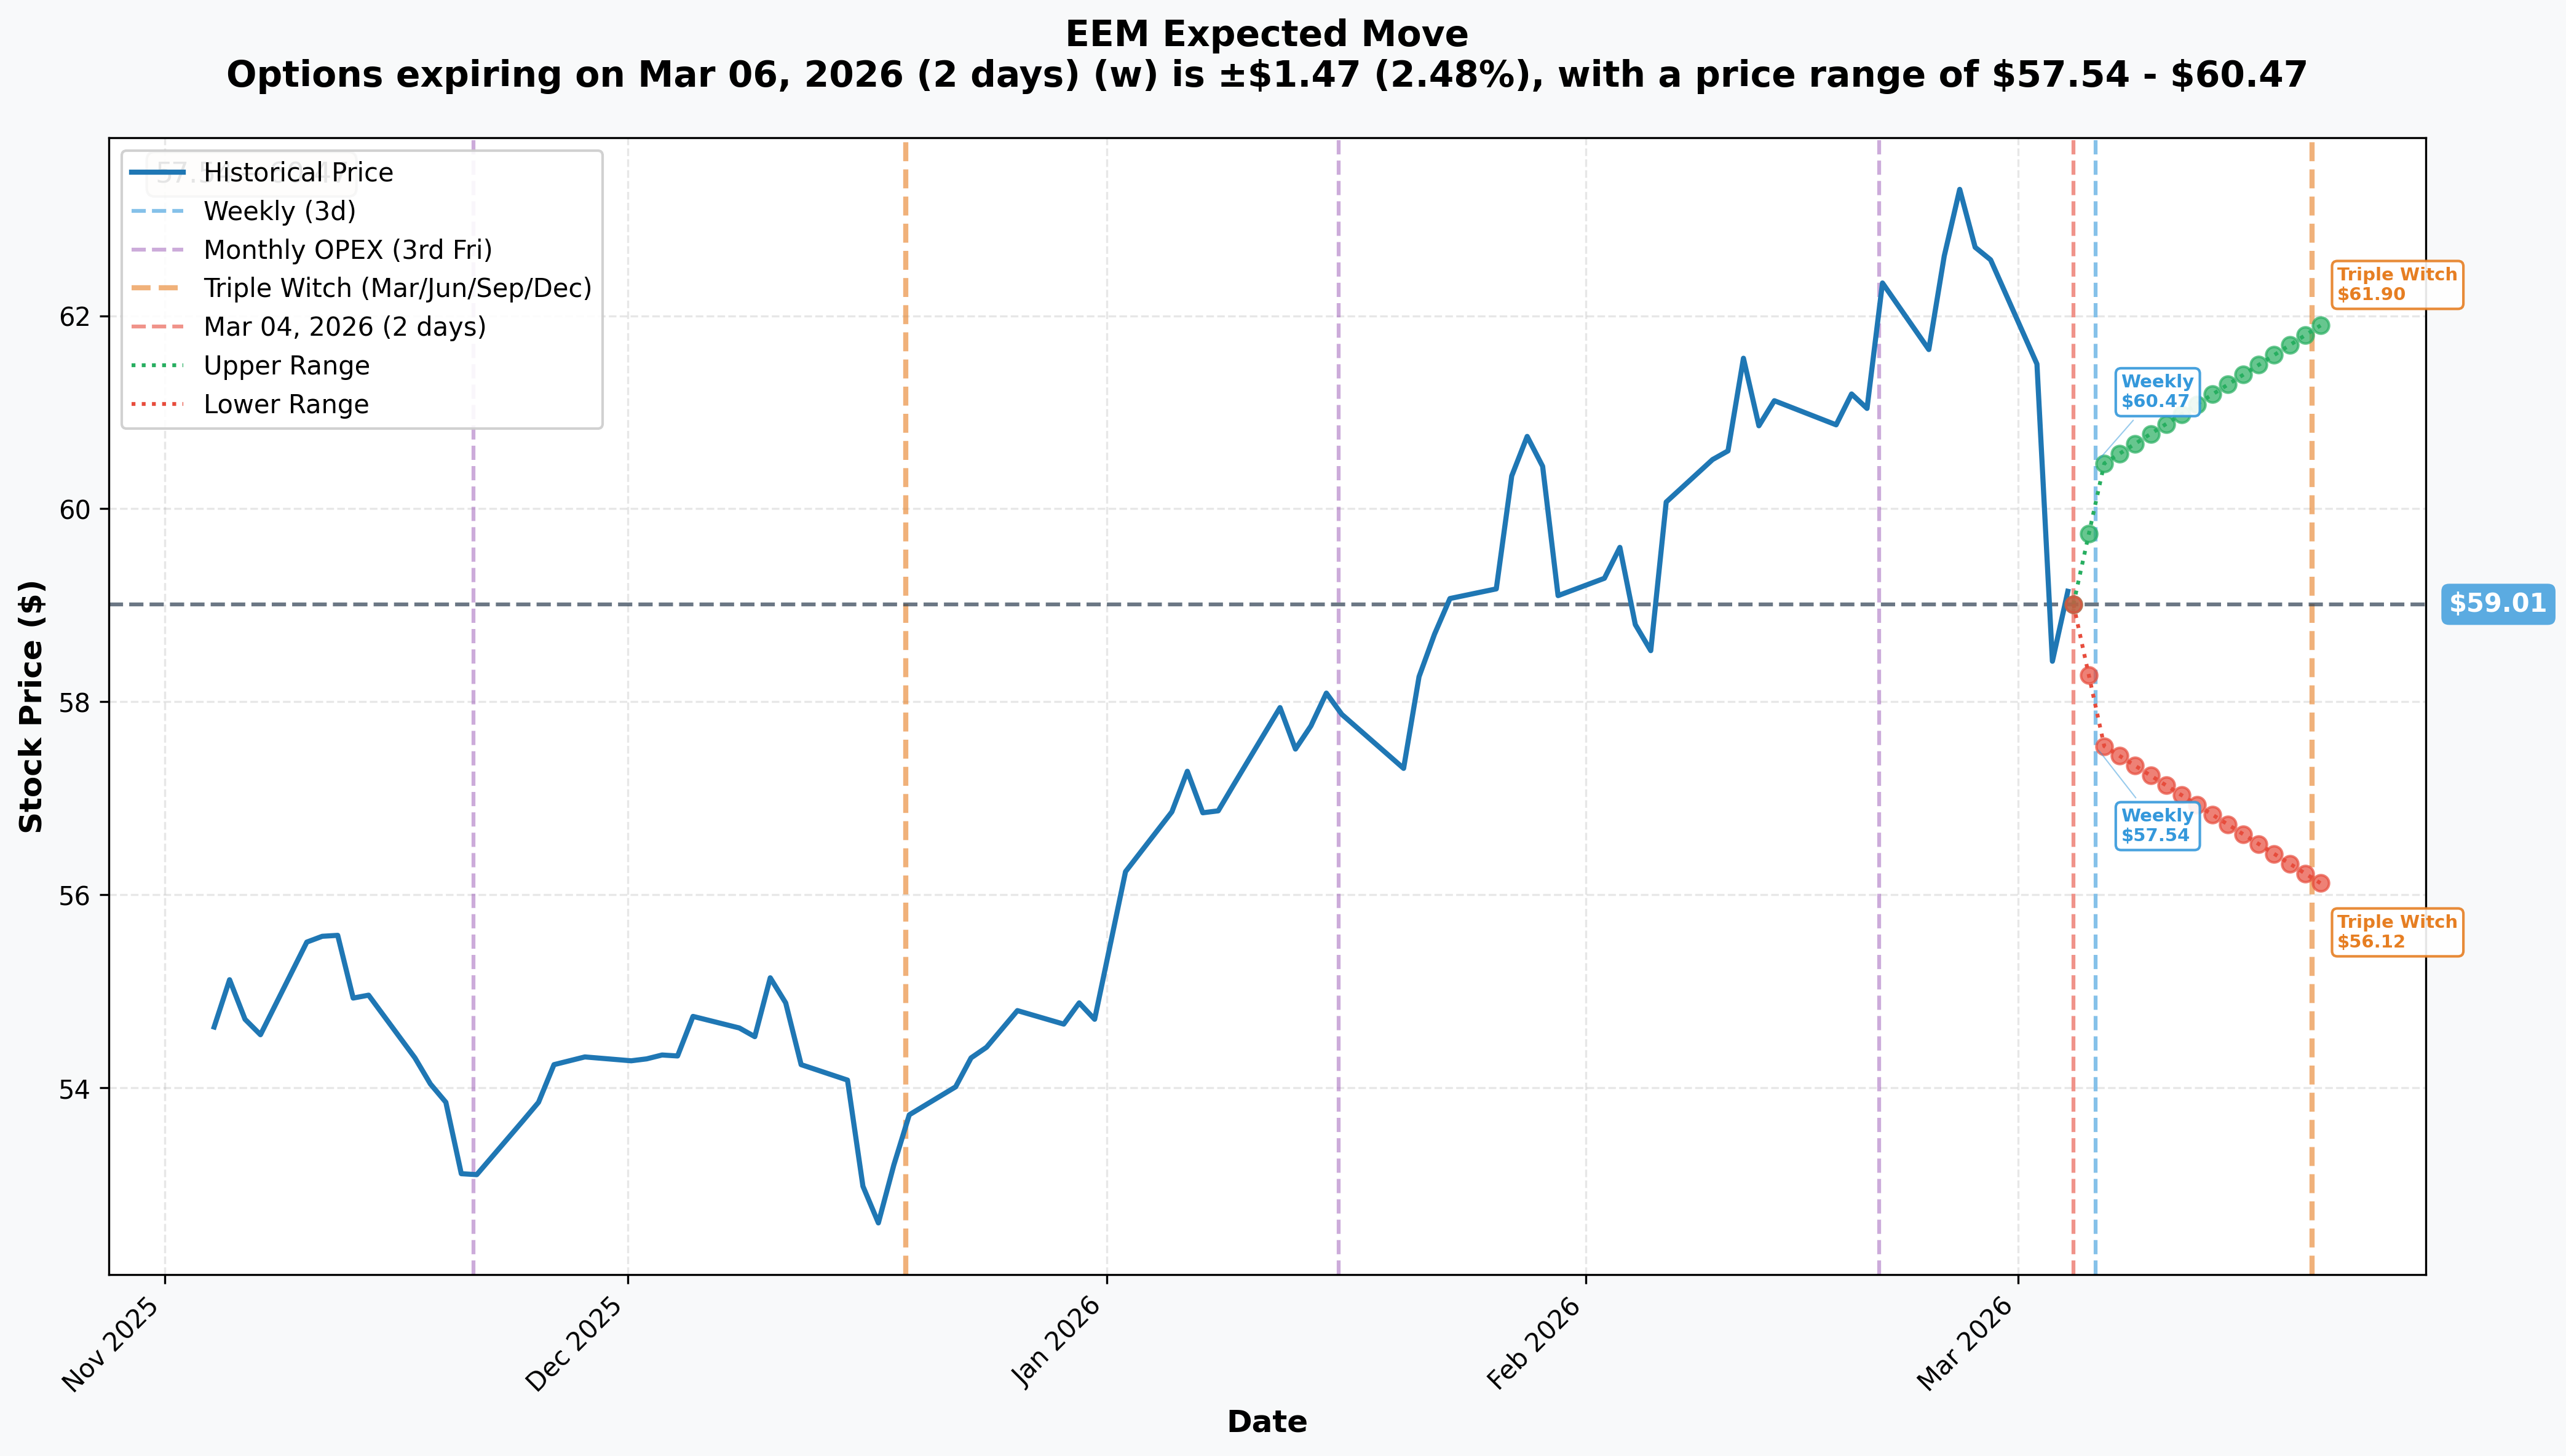
The options market is pricing in some serious movement:
| Timeframe | Expiry | Implied Move | Range |
|---|---|---|---|
| 📅 Weekly | 2026-03-06 | +/- 2.5% ($1.47) | $57.54 - $60.47 |
| 📅 Monthly (OpEx) | 2026-03-20 | +/- 4.9% ($2.89) | $56.12 - $61.90 |
| 📅 Triple Witch | 2026-03-20 | +/- 4.9% ($2.89) | $56.12 - $61.90 |
That 4.9% implied move through March OpEx is substantial. The market is telling you it expects EEM to trade anywhere from $56.12 to $61.90 over the next two weeks. That wide range reflects the uncertainty from the NPC, FOMC, and tariff overhang all hitting at once.
🎪 Catalysts
✅ Already Happened (Last 2 Weeks)
📌 Section 122 Universal Tariff (February 24) -- After the Supreme Court struck down IEEPA tariffs, the administration pivoted to a 15% universal surcharge capped at 150 days (expires July 24). This triggered the March 3 selloff.
📌 EEM Selloff (March 3) -- Down 5% on 2.2x volume. Short interest had already declined 20.1% from January to mid-February, meaning the selloff was driven by fresh selling, not short covering.
📌 Taiwan-U.S. Trade Deal (January) -- Taiwan locked in a tariff reduction to 15% in exchange for $250B in U.S. investment. TSMC pledged $100B. This is structurally bullish for EEM's Taiwan weight.
📌 China AI Rally -- The Hang Seng Tech Index surged 35% YTD, led by Alibaba and SMIC, on DeepSeek and China AI momentum.
🔮 Coming Up (Next 1-8 Weeks)
📅 March 4 (Today) -- CPPCC opens (China Two Sessions begins)
📅 March 5 (Tomorrow) -- 🚨 Biggest near-term catalyst. NPC opens with Premier Li Qiang delivering the Government Work Report. Key watches: GDP target (4.5% vs 5%), fiscal deficit ratio, special bond quotas, and 15th Five-Year Plan details. Goldman Sachs expects 1.8T yuan special treasury bonds + 4.6T yuan local government bonds. An upside surprise could send EEM flying.
📅 March 17-18 -- 🚨 FOMC Meeting + Dot Plot. Core CPI at 2.0% creates conditions for rate cut signaling. 47% market-implied probability of a cut at this meeting. If the dot plot shows multiple 2026 cuts, EM assets could rally hard on dollar weakness.
📅 March 20 -- Triple Witching OpEx. Expect elevated volatility and positioning unwinds.
📅 April -- China Q1 GDP release (first read on 2026 growth).
📅 July 24 -- Section 122 tariff expiration. This is the hard deadline -- either Congress extends, the administration pivots to Section 301/232, or tariffs expire.
🎲 Price Targets & Probabilities
Based on gamma levels, implied move ranges, and the catalyst calendar:
🐻 Bear Case -- $55-$56 (25% probability)
If the NPC disappoints (GDP target cut to 4.5% without stimulus surprise) and the FOMC stays hawkish, EEM breaks below the 50-day SMA ($58.63) and slides toward the gamma support zone at $55-$56. The implied move lower bound of $56.12 through March OpEx aligns with this level. A close below $57.18 would confirm the bearish breakdown.
⚖️ Base Case -- $57.50-$61 (50% probability)
EEM consolidates around the 50-day SMA and slowly recovers as NPC delivers in-line stimulus and the FOMC takes a wait-and-see approach. The price chops within the implied move range ($57.54-$60.47 weekly, $56.12-$61.90 monthly). The short call unwind we just saw suggests at least one big player thinks the downside is limited from here.
🚀 Bull Case -- $61-$63 (25% probability)
China surprises with a 5% GDP target, above-consensus bond quotas, and expanded consumer stimulus. The FOMC dot plot signals 2-3 cuts in 2026, crushing the dollar. EM easing cycles continue with PBOC cuts adding fuel. EEM reclaims the 20-day SMA ($60.99) and pushes toward $63. The medium-term put/call ratio of 0.44 (bullish) supports this outcome.
💡 Trading Ideas
🛡️ Conservative: "The Cashflow Collector" -- Sell EEM Put Spread
The trade: 🔹 Sell EEM April 17 $56 Put 🔹 Buy EEM April 17 $53 Put 🔹 Net credit: ~$0.55-$0.70 per spread
Why this works: You're selling elevated put premium into a market that just had a 5% capitulation move. The $56 strike sits below both the implied move lower bound and the gamma support zone. Your max loss is capped at $3 minus the credit received. The put/call ratio at 1.41 tells you puts are in high demand -- great time to be the seller.
Risk: EEM breaks $56 on continued tariff escalation or China NPC disappointment. Max loss ~$2.30-$2.45 per spread.
⚖️ Balanced: "The Two Sessions Bounce" -- EEM April 17 $58/$62 Call Spread
The trade: 🔹 Buy EEM April 17 $58 Call 🔹 Sell EEM April 17 $62 Call 🔹 Net debit: ~$1.40-$1.60
Why this works: You're positioned for the exact thesis that today's short-call closer seems to believe -- that EEM's downside is limited near the 50-day SMA and the catalysts favor upside. The $58 strike is the same one where 30,000 contracts just changed hands, so there's clearly institutional interest at this level. Your max gain is ~$2.40-$2.60 per spread if EEM closes above $62 at April expiration. The 13% YTD EM rally before the selloff shows the structural trend is still bullish.
Risk: Tariff escalation or a hawkish FOMC keeps pressure on EM. Max loss is limited to the debit paid.
🚀 Aggressive: "The Catalyst Straddle" -- EEM March 20 $59 Straddle
The trade: 🔹 Buy EEM March 20 $59 Call 🔹 Buy EEM March 20 $59 Put 🔹 Net debit: ~$2.80-$3.10
Why this works: You've got China's Two Sessions (this week), the FOMC + dot plot (March 17-18), AND Triple Witching OpEx (March 20) all packed into one expiration window. The implied move through March 20 is +/- 4.9% ($56.12-$61.90). If EEM moves more than $3 in either direction from $59, you're profitable. With this many catalysts stacked up and a Catalyst Density Score of 9/10, the odds of a big move are high.
Risk: If all catalysts are "in-line" and EEM stays pinned near $59, time decay eats your premium. This trade needs movement -- direction doesn't matter.
⚠️ Risk Factors
❗ Tariff Escalation: The Section 122 tariff's 150-day window is a bridge -- if the administration pivots to harsher Section 301/232 authorities, emerging markets face prolonged headwinds.
❗ Dollar Strength: If the FOMC stays hawkish (one cut or none in 2026), a strong dollar drains capital from emerging markets.
❗ China Disappointment: A GDP target cut to 4.5% without an offsetting stimulus surprise could trigger a de-rating of China equities -- and China is 30%+ of EEM.
❗ Geopolitical Risk: Taiwan Strait tensions and Middle East escalation (gold hit $5,100 on March 3) create background tail risk.
❗ South Korea Overextension: After a 43% YTD rally, some specialists are flagging bubble risk in a key EEM component.
❗ Liquidity Risk: EEM options can have wider spreads in volatile conditions. Watch bid-ask spreads, especially on the weekly expiration.
🎯 The Bottom Line
Here's the deal: Someone managing a $176M emerging markets position just paid $8.1M to buy back their short calls on EEM. That's not a casual adjustment -- that's a deliberate decision to remove upside cap risk heading into the densest catalyst window we've seen for EM all year.
The timing is everything. China's Two Sessions starts today, the NPC delivers its Government Work Report tomorrow, and the FOMC meeting with a fresh dot plot is two weeks out. Meanwhile, EEM just had a 5% capitulation-day drop that might have flushed out the weak hands.
If you're bullish on EM: The call spread ($58/$62, April 17) lets you ride the bounce with defined risk. Mark your calendar for March 5 -- if China's stimulus details come in hot, EEM could reclaim $60+ fast.
If you're just watching: Keep an eye on the 50-day SMA at $58.63. That's the bull/bear line. A daily close below it opens $56.50. A hold and bounce targets $60.99 (20-day SMA).
If you're bearish: Don't fight the short interest decline. Shorts have already unwound 20% since January, and this big call-cover trade suggests the smart money is reducing short exposure, not adding to it. If you want downside, buy puts rather than shorting the stock.
One thing is clear -- the next two weeks will not be boring for emerging markets. 🌏
Disclaimer: Options trading involves substantial risk and is not suitable for all investors. The analysis above is for informational purposes only and does not constitute financial advice. Always do your own research and consult with a qualified financial advisor before making investment decisions. Past performance does not guarantee future results.
Data provided by Ainvest Labs. For more on EEM, visit Ainvest.