🌏 EEM Whale Just Loaded Up 10,000 LEAP Calls — Betting $4.6M on an EM Comeback!
📅 March 10, 2026 | 🔥 Unusual Activity Detected
🎯 The Quick Take
Someone just dropped $4.6 MILLION on EEM LEAP calls this afternoon, buying 10,000 contracts of the $62 strike expiring January 2027 — a 10-month bet that emerging markets roar back from their tariff-shock lows. Volume of 10K blew past existing open interest of just 6.2K contracts, meaning this is an entirely new position, not a hedge. With EEM bouncing off the $59 gamma support zone today, this looks like an institutional player calling the bottom on the EM recovery story.
📊 Company Overview
iShares MSCI Emerging Markets ETF (EEM) is BlackRock's flagship emerging markets ETF — the go-to institutional vehicle for getting broad EM exposure:
- AUM: ~$17 billion (most liquid EM ETF on the planet for options trading)
- Expense Ratio: 0.70%
- Current Price: $59.10 (bouncing off $59 support, up from $57.40 last week)
- What It Owns: ~1,200 companies across China, Taiwan, India, South Korea, Brazil, and 20+ more emerging economies
- Why It Matters for Traders: EEM is THE institutional vehicle for EM macro bets — deep options liquidity, tight spreads, and massive open interest make it perfect for large directional plays
Top Holdings that drive the price:
| Holding | Weight |
|---|---|
| Taiwan Semiconductor (TSMC) | ~13.4% |
| Samsung Electronics | ~5.1% |
| Tencent Holdings | ~3.9% |
| SK Hynix | ~2.9% |
| Alibaba Group | ~2.7% |
Country mix: China (~33%), Taiwan (~15%), India (~13%), South Korea (~12%), Brazil (~5%). Translation: EEM is basically a bet on China stimulus working, Taiwan semis booming, and the US dollar staying weak.
💰 The Option Flow Breakdown
📊 The Tape — March 10, 2026
| Date | Time | Symbol | Buy/Sell | Call/Put | Expiration | Strike | Premium | Volume | OI | Size | Spot | Option Price | Option Symbol |
|---|---|---|---|---|---|---|---|---|---|---|---|---|---|
| 2026-03-10 | 13:23:19 ET | EEM | BUY | CALL | 2027-01-15 | $62 | $4.6M | 10,000 | 6,200 | 10,000 | $59.82 | $4.60 | EEM20270115C62 |
Z-Score: 16.0 — EXTREMELY UNUSUAL | Volume/OI Ratio: 1.61x (new position confirmed)
🤓 What This Actually Means
This is a straight-up bullish directional bet — no hedging, no spread, just loading up on upside. Here's the breakdown:
- 💸 Premium paid: $4.6M ($4.60 per contract × 10,000 contracts × 100 shares)
- 🎯 Strike: $62 sits 3.6% above the spot price of $59.82 at time of trade — slightly out-of-the-money
- ⏰ Duration: 10 months to expiration (January 15, 2027) — this is a LEAP, not a quick flip
- 📊 New money: Volume of 10,000 contracts exceeds the existing open interest of 6,200 — this is fresh capital entering the market, not someone rolling an existing position
- 🐋 Size check: 10,000 contracts = exposure to 1,000,000 shares of EEM worth ~$59.8M at spot — this is institutional-scale conviction
What's really happening here:
This trader is betting that EEM climbs above $66.60 (breakeven = $62 strike + $4.60 premium) by January 2027 — a roughly 11.3% move from today's spot of $59.82. They're not panicking about the recent tariff-shock selloff. Instead, they're leaning INTO the volatility, buying while everyone else is still nervous. The 10-month timeframe captures the full catalysts calendar: US-China trade talks, TSMC earnings, China Q1 GDP, three expected Fed rate cuts, and a potential second half EM recovery.
The Z-score of 16.0 means this trade is about 16 standard deviations above average daily volume for this strike — we see activity this unusual maybe a handful of times a year. That's institutional money making a high-conviction macro call, not retail noise.
📈 Technical Setup / Chart Check-Up
YTD Performance
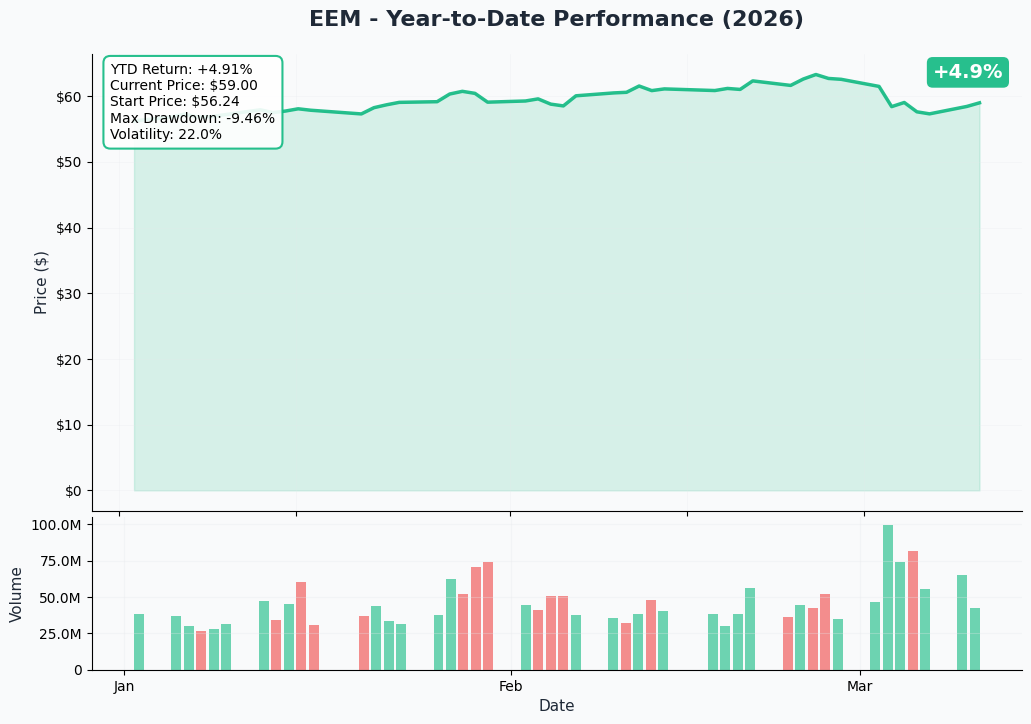
EEM started 2026 at $56.24 and is currently up +4.91% YTD at $59.00. But the chart tells a more interesting story — EEM ran all the way to the $62–$65 range in late January before the tariff shock hit in late February/early March, slicing the ETF down 8.41% in a single week.
Key observations from the chart:
- 📈 Strong January run: EEM ripped from $56 to $63+ as China stimulus optimism and dollar weakness fueled EM inflows
- 😰 March tariff crash: The Trump administration's escalating trade war triggered a violent risk-off rotation — EEM hit a max drawdown of -9.46% from peak
- 🔄 Volatility regime: Annualized vol running at 22% — elevated but not in panic territory yet
- 📊 Volume spike: The volume bars in early March show massive red (selling) volume, followed by a stabilization — classic capitulation pattern before a potential base
- 👀 Where we are now: Trading at $59, trying to form a base after the selloff — exactly the kind of entry point a smart institutional buyer would target for a LEAP
Gamma-Based Support & Resistance
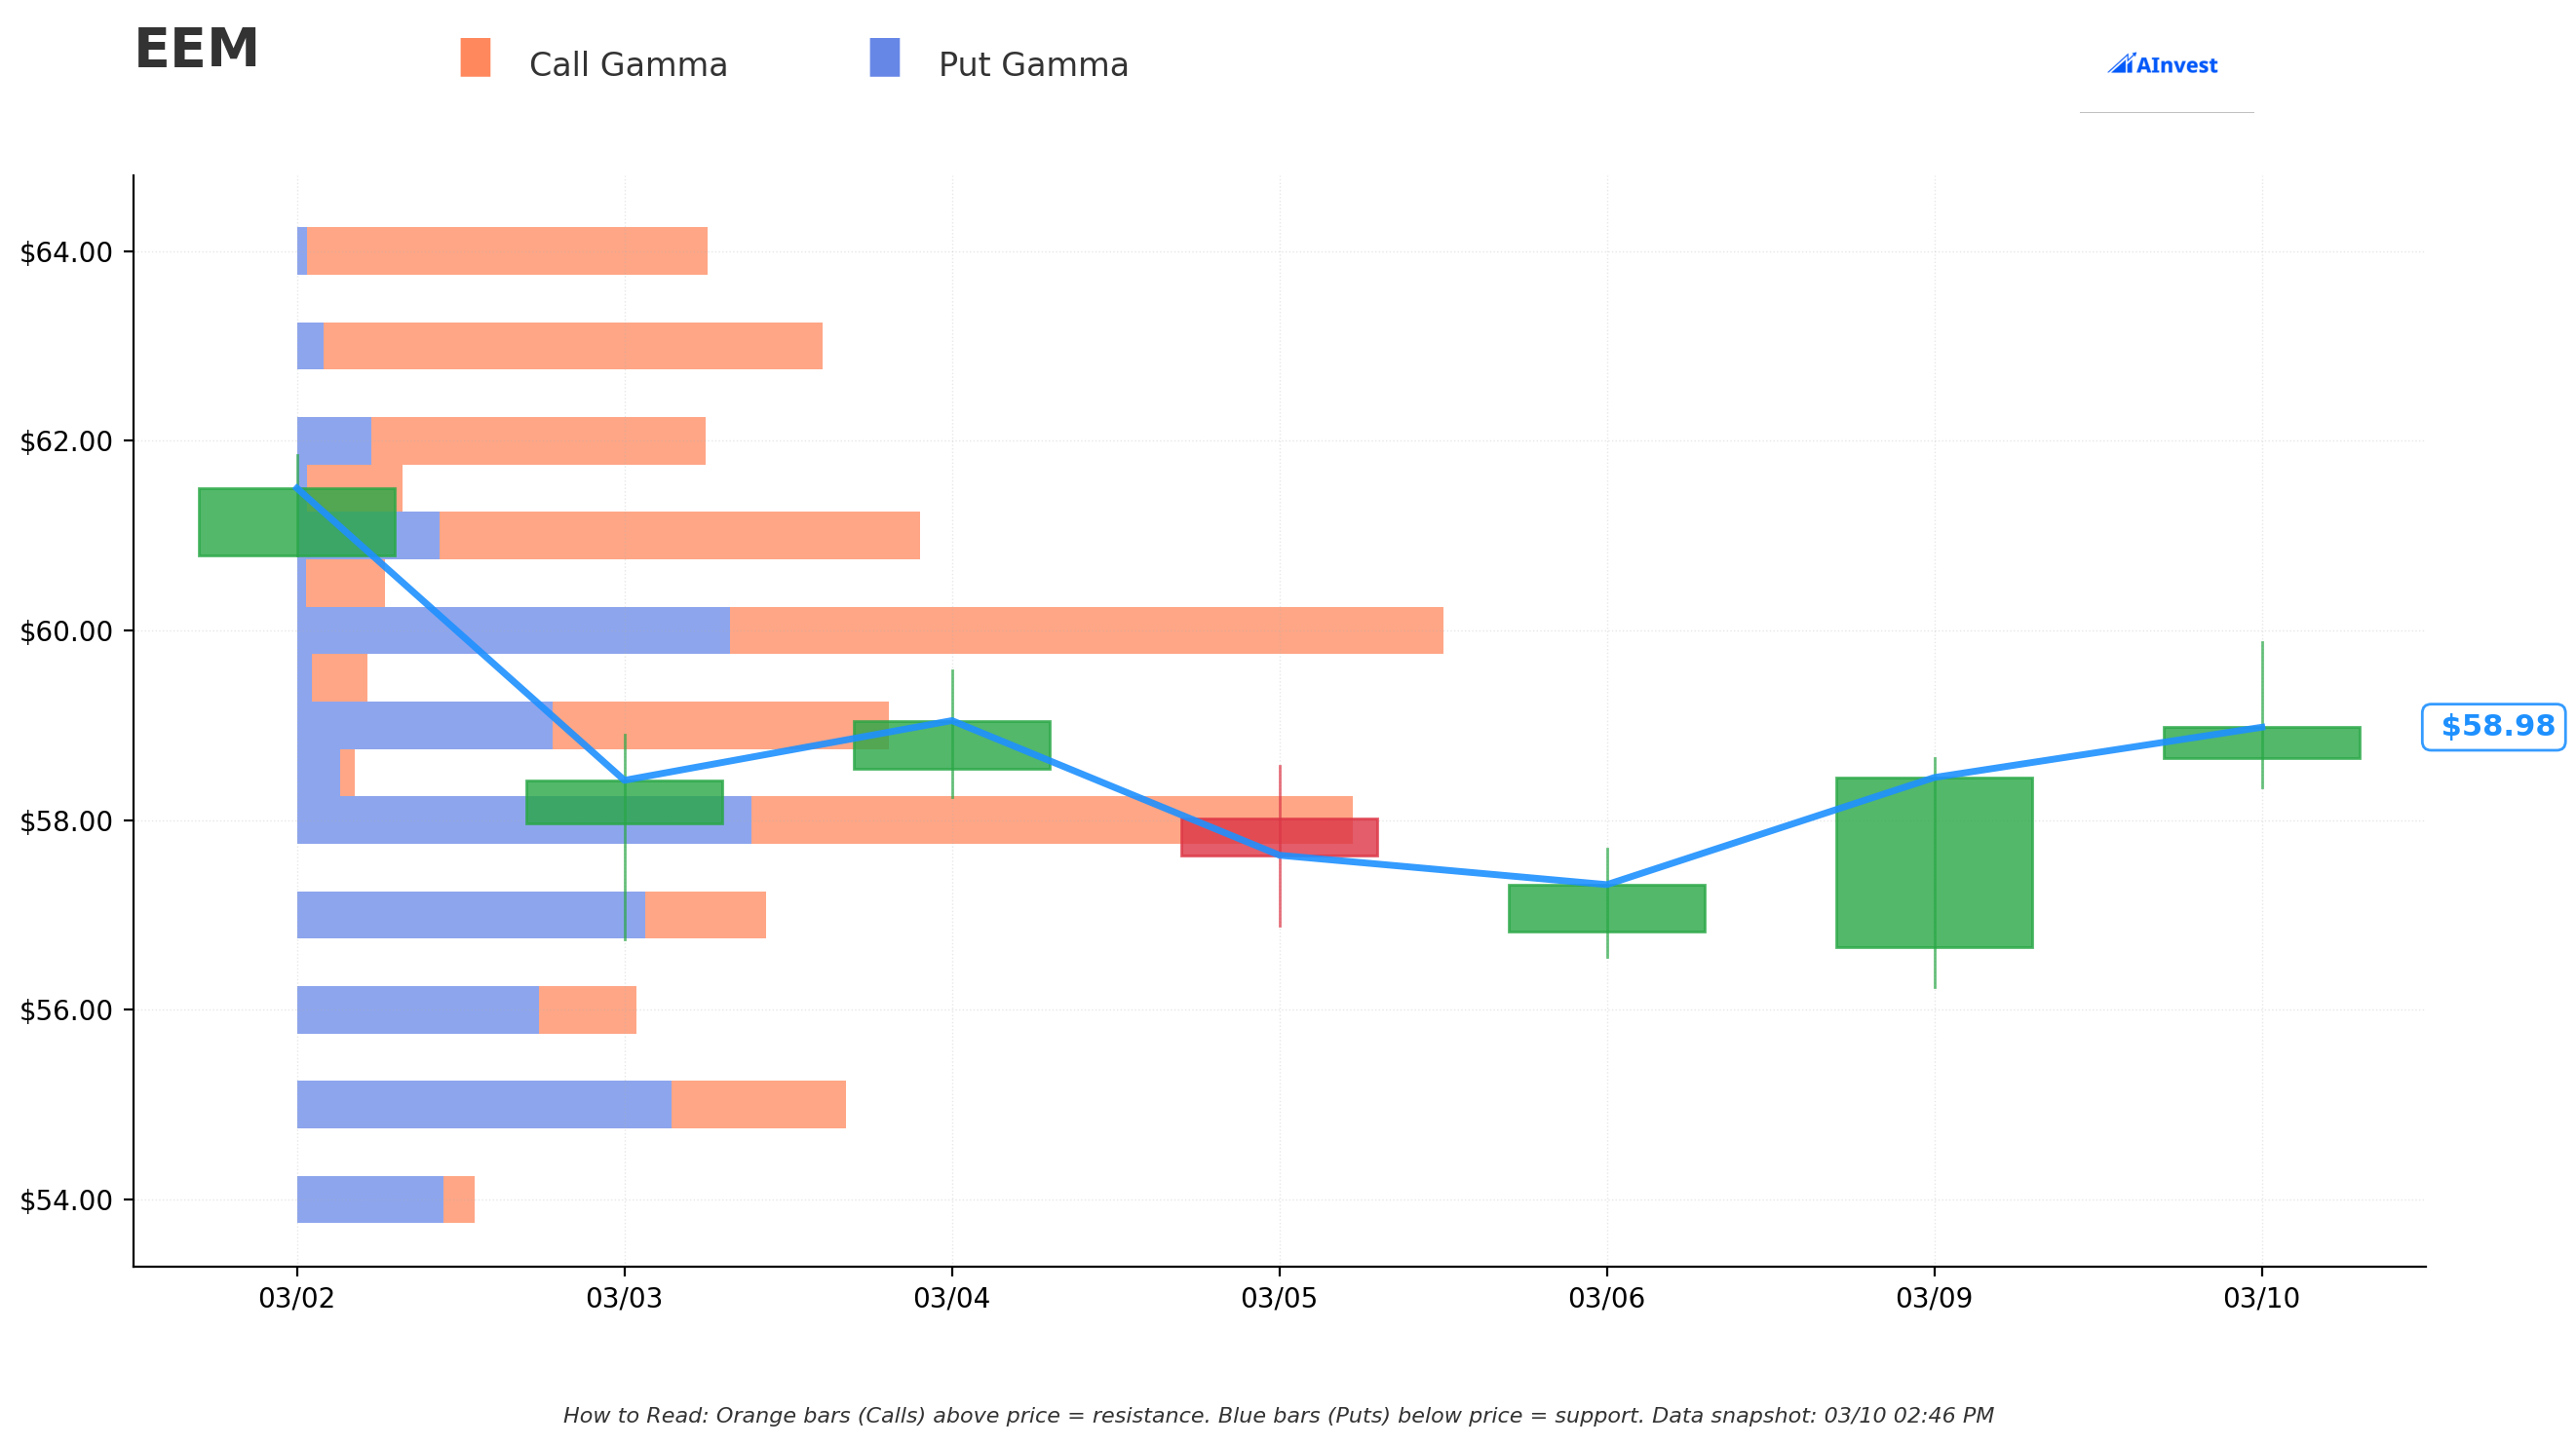
Current Price: $59.10 | GEX Bias: BULLISH
The gamma exposure map shows EEM sitting right at a critical inflection zone:
🔵 Support Levels (Put Gamma Below Price):
- $59 — Immediate support (current price sitting right on this level — buyers here act as a floor)
- $58 — Secondary support with meaningful put gamma accumulation
- $57 — Extended support zone
- $55–$54 — Deep gamma floors visible on the chart; this is the last line of defense for bulls
🟠 Resistance Levels (Call Gamma Above Price):
- $60 — Immediate ceiling; dealers will sell into rallies toward this level (most important near-term battle)
- $61–$62 — The LEAP strike zone — heavy call gamma buildup here (the $62 strike from today's trade is right in this cluster!)
- $63–$64 — Extended resistance zone from the January highs
- $60 is the key level to watch: break above it with conviction and the gamma dynamic flips supportive all the way to $62+
What this means for the LEAP buyer:
The trader bought the $62 calls right at the upper resistance cluster. If EEM can clear $60 resistance (just $0.90 away), the gamma setup becomes increasingly supportive as call gamma builds above price. The $59 put gamma wall provides an immediate floor — market makers are mechanically buying dips here. This is a smart entry point: buying the LEAP while spot sits right on support and resistance is close enough to potentially flip in their favor.
Implied Move Analysis
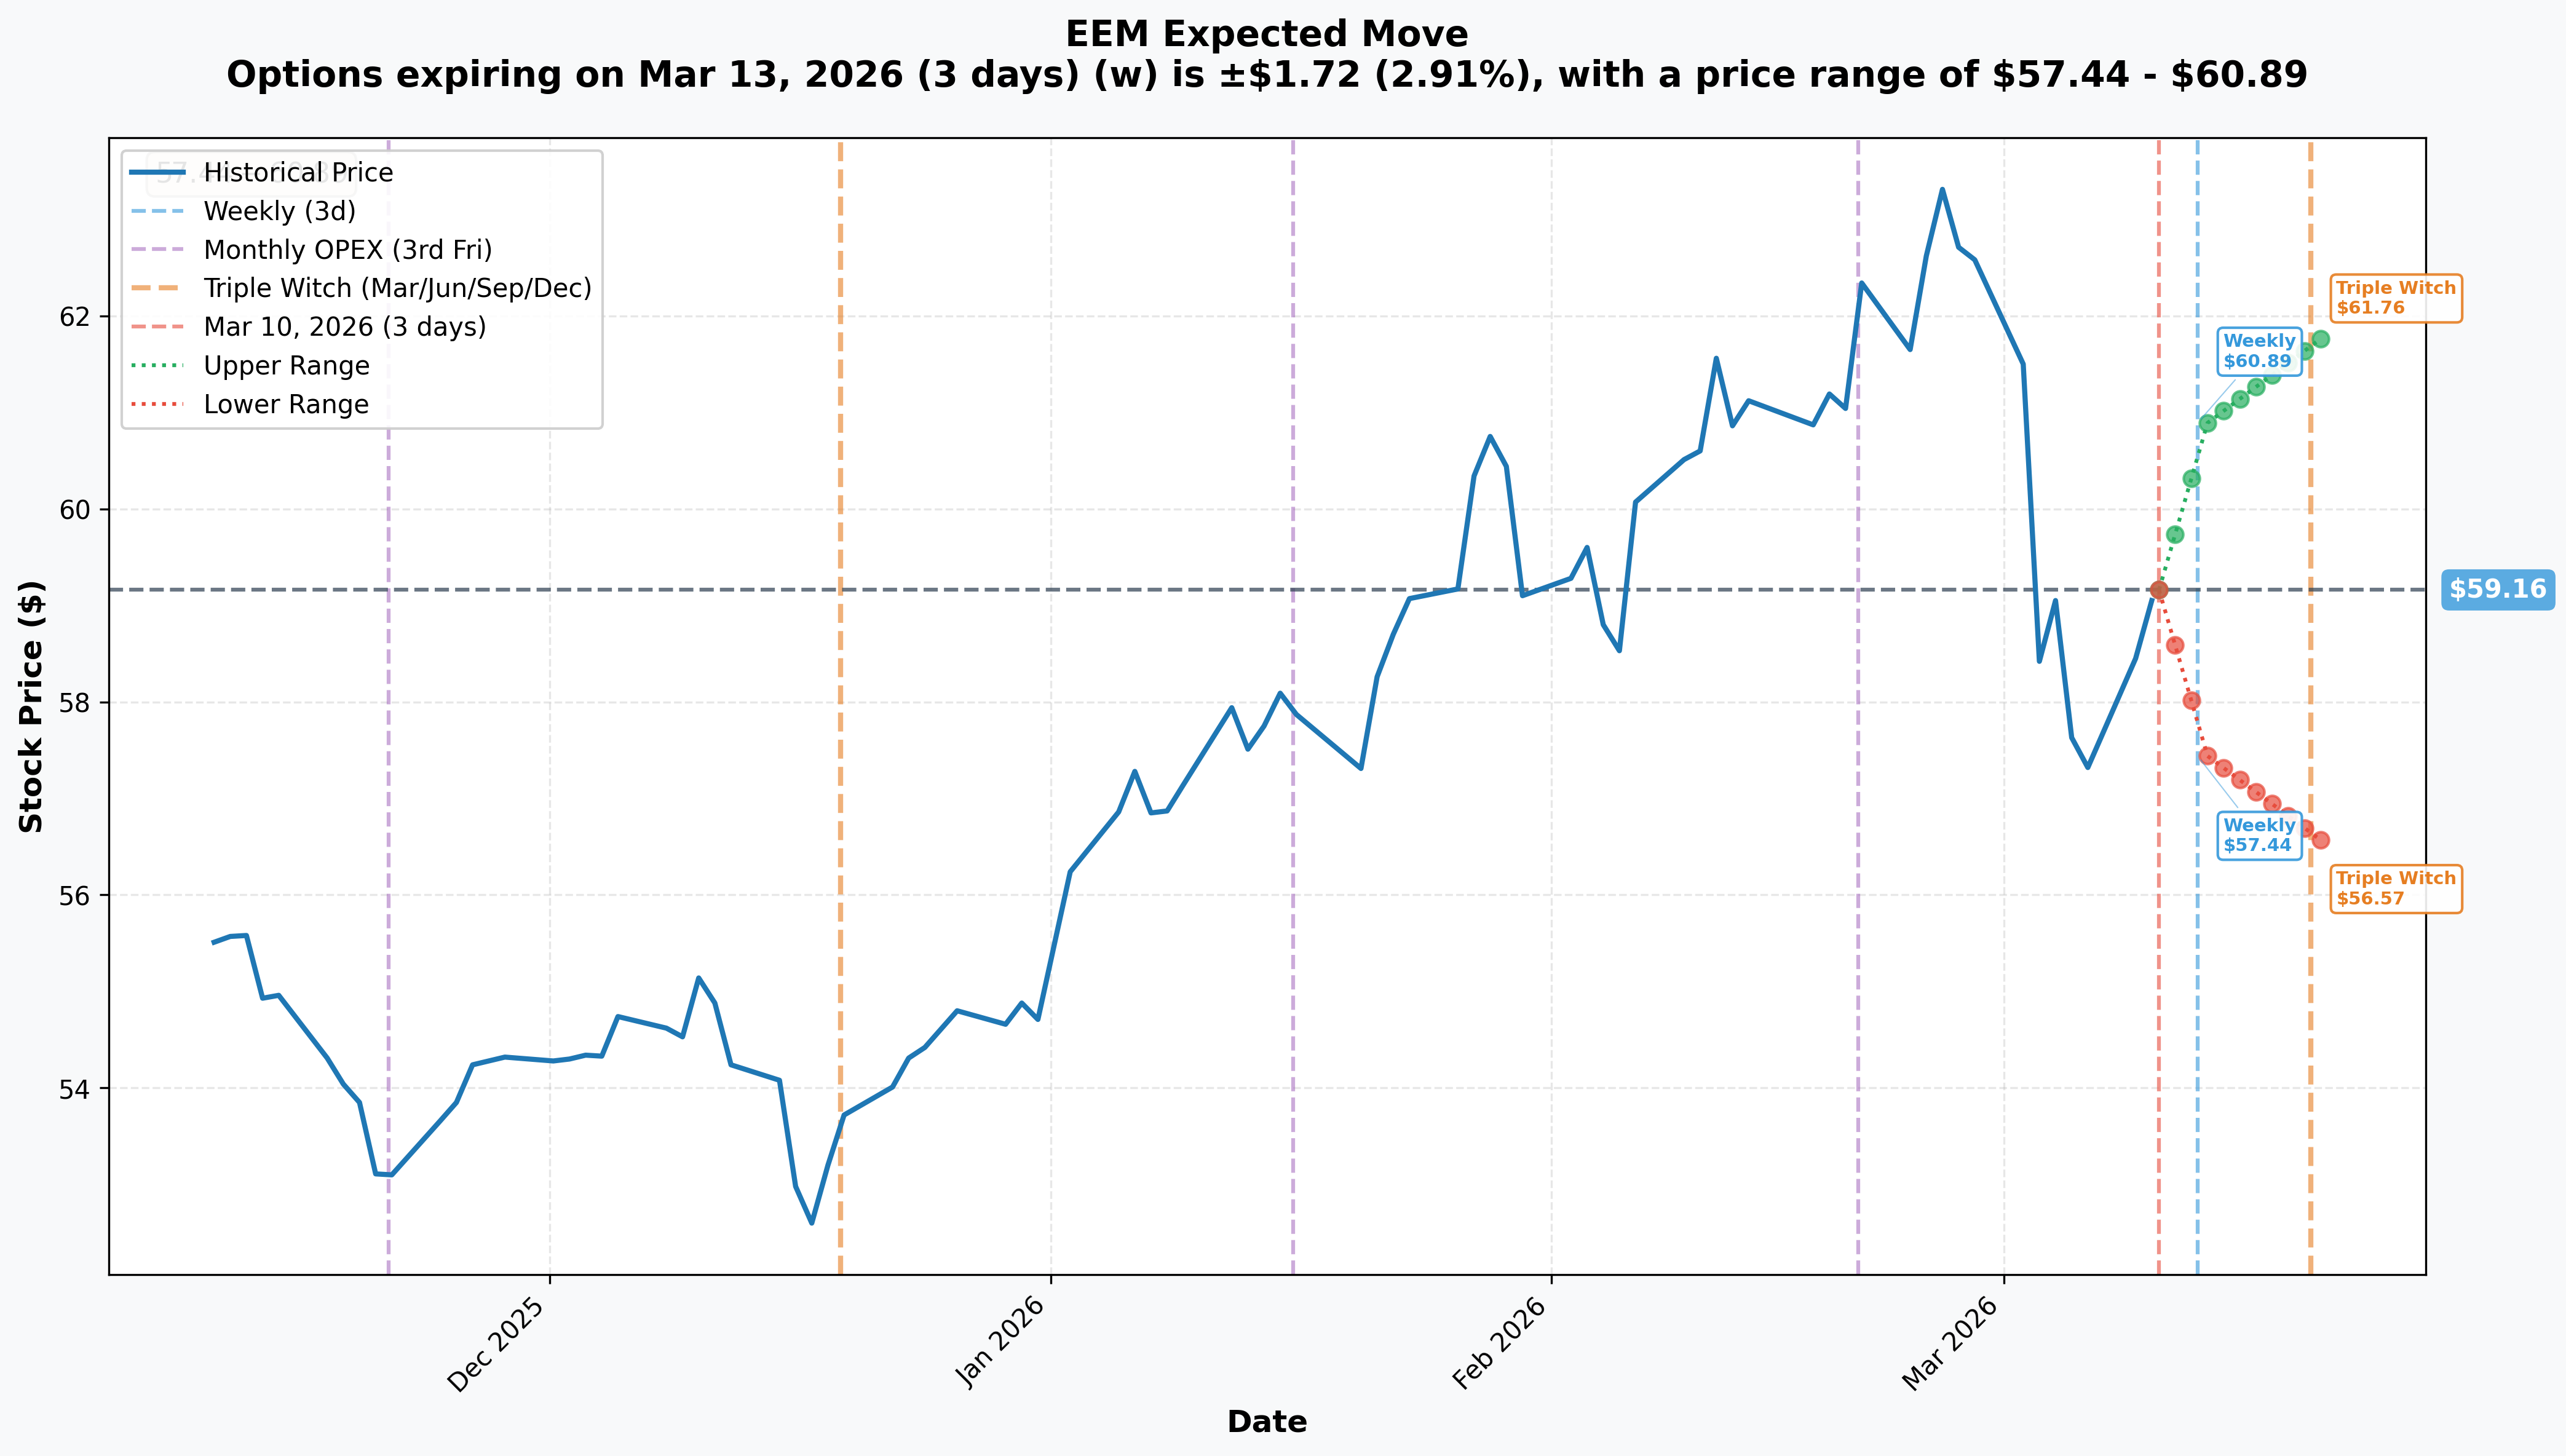
What options are pricing in right now:
- 📅 Weekly (March 13 — 3 days): ±$1.72 (±2.91%) → Range: $57.44 – $60.89
- 📅 Monthly OPEX (March 20 — 10 days): ±approx. $2.07 (±3.5%) → Range: ~$57.03 – $61.17
- 📅 Triple Witch visible on chart: Extended range targets showing upper bound around $61.78
Translation for regular folks:
The market expects EEM to stay in a fairly tight $57–$61 band over the next week or two. That's actually GOOD news for the LEAP buyer — they're not paying for near-term fireworks, they're paying for the 10-month thesis to play out. If you look at the chart, the weekly range of $57.44 – $60.89 captures both the key $59 support AND the $60 resistance. The real question is which side breaks.
The LEAP trade expires January 15, 2027 — way beyond any of these near-term implied move windows. The trader is essentially saying: "I don't care what happens this week or even this month. I'm betting on the macro picture over the next 10 months." That's a very different mindset from the weekly trader.
🎪 Catalysts
🔥 Near-Term Catalysts (Next 30 Days)
US-China Trade Talks — The #1 Driver 🇨🇳
This is the single biggest binary event for EEM right now. China represents 33% of the fund's weight, so any movement on US-China tariff negotiations is an immediate, direct catalyst. Any hint of de-escalation — tariff exemptions, working group meetings, or a pause — could send EEM up 5-8% in days. Conversely, further escalation is the primary downside risk. Watch closely for any diplomatic signals out of Washington and Beijing.
India's Budget & RBI Rate Cut Cycle 🇮🇳
India (~13% of EEM) is the structural bright spot. The US-India bilateral trade deal finalized January 27 cut tariffs from 25% to 18%, driving a 2.5%+ Nifty rally. The RBI is expected to cut rates an additional 50 bps in 2026, stimulating consumer spending. India is the diversification story that partially offsets China risk in this fund.
🚀 Medium-Term Catalysts (30–90 Days)
TSMC Q1 2026 Earnings (~April 17) 🏭
TSMC is EEM's largest single holding at 13.43%. As the world's dominant AI chip manufacturer — making chips for Nvidia, Broadcom, Apple — TSMC's earnings are a direct catalyst for EEM. Strong guidance confirming the AI infrastructure buildout is on track would be a major positive. This is a date to mark on your calendar.
China Q1 2026 GDP Release (~April 16) 📊
Consensus expects 4.8–5.0% growth for China Q1. Any upside surprise would validate the thesis that Beijing's stimulus program — fiscal spending on consumption, housing, and tech sector normalization — is actually working. Analysts are forecasting 15% earnings growth for MSCI China companies in 2026. If that story gets confirmed, EEM's 33% China allocation could be the biggest tailwind of the year.
Federal Reserve Rate Decision — May 7 FOMC 💰
Three Fed rate cuts are projected for 2026. A confirmed dovish pivot by May would weaken the dollar — and a weaker dollar is the single most important macro tailwind for EEM returns. The dollar posted its sharpest annual decline in eight years in 2025. If that trend continues into 2026, EM assets broadly re-rate higher. Watch Fed language carefully.
MSCI EM Quarterly Rebalance — May 2026 🔄
MSCI's semi-annual review in May could bring meaningful weight changes (India increasing, China potentially decreasing). Announced weight increases in India would bring predictable institutional buying flows into EEM's India holdings.
✅ Already Happened — Positive Catalysts
Korea Semiconductor Strength 🇰🇷
Samsung (5.13%) and SK Hynix (2.92%) — together ~8% of EEM — have provided a tailwind through strong Q1 2026 guidance. SK Hynix is the dominant supplier of HBM3E memory used in Nvidia AI accelerators. The AI infrastructure buildout is directly benefiting EEM's South Korea allocation right now.
⚠️ Already Happened — Negative Catalysts
Tariff Shock — 8.41% Weekly Drop March 6, 2026 📉
The Trump administration's trade war escalation triggered a broad EM selloff that knocked EEM down 8.41% in a single week ending March 6. Mexico's 80% US export dependence under a 30% tariff regime shows the acute damage. Southeast Asian exporters face secondary shock from cheap Chinese goods flooding their markets. VIX spiked to 23.75 — risk-off rotation out of EM assets was the result.
China Stimulus Disappointment — Q1 2026 📉
Despite Beijing's multi-pronged stimulus program, delivery has disappointed relative to bullish expectations in Q1 2026, contributing to the recent pullback from $63+ highs. The 15% MSCI China earnings growth thesis is intact but needs proof of execution.
🎲 Price Targets & Probabilities
Using the gamma levels, implied move data, and full catalyst calendar, here's how the next 10 months could play out:
📈 Bull Case (30% probability)
Target: $66–$70 by January 2027
How we get there:
- 🤝 US-China trade de-escalation removes the biggest overhang — just reducing tariffs by even 5–10% could add 5–8% to EEM overnight
- 🇨🇳 China stimulus actually delivers: 15% MSCI China earnings growth materializes by mid-2026
- 💵 Dollar continues weakening as three Fed cuts materialize — every 5% DXY decline adds ~3–4% to EM USD returns
- 🏭 TSMC April earnings confirm AI chip demand roaring — drives re-rating of EEM's biggest holding
- 📈 Break above $60 gamma resistance triggers technical momentum, shorts cover, flows accelerate
- 🇮🇳 India continues its structural outperformance — 7.4% GDP growth, ongoing RBI rate cuts, expanding trade deal benefits
LEAP P&L in Bull Case:
- EEM at $66 on Jan 15: Calls worth ~$7.60, profit = ~$3.00/share × 10,000 contracts = +$3M gain (65% ROI)
- EEM at $70 on Jan 15: Calls worth ~$11.00, profit = ~$6.40/share × 10,000 contracts = +$6.4M gain (139% ROI)
🎯 Base Case (45% probability)
Target: $60–$65 range (gradual recovery)
Most likely scenario:
- ⚖️ Trade talks progress but no decisive resolution — tariff uncertainty persists but doesn't escalate further
- 📊 China stimulus delivers mediocre results — growth holds at 4.8–5%, not a blowout recovery
- 💵 Dollar weakens modestly — one or two Fed cuts happen but inflationary pressure from tariffs complicates the path
- 🔄 EEM grinds back toward the January highs of $63–$65 over the course of 2026 as the tariff panic fades
- 📅 TSMC and Korea semiconductor earnings remain solid, providing tech sector tailwinds
LEAP P&L in Base Case:
- EEM at $63 on Jan 15: Calls worth ~$3.20 (still slightly OTM), loss = ~-$1.40/share × 10,000 = -$1.4M loss (-30%)
- EEM at $65 on Jan 15: Calls worth ~$5.10, profit = ~$0.50/share × 10,000 = +$500K gain (11% ROI)
📉 Bear Case (25% probability)
Target: $54–$58 (re-test of lows or worse)
What could go wrong:
- 🚨 Trade war escalates further — new tariff rounds targeting Chinese tech companies or broader EM economies
- 🇨🇳 China stimulus fails to revive growth — property sector overhang proves too heavy, corporate earnings disappoint badly vs. the 15% growth consensus
- 💵 Dollar strengthens — tariff-driven US inflation forces Fed to PAUSE cuts, dollar reverses 2025 decline
- 🌏 Taiwan Strait geopolitical escalation — would devastate both Taiwan (15%) and South Korea (12%) simultaneously via tech supply chain disruption
- 📉 VIX continues climbing above 25 — sustained risk-off rotation continues bleeding EM assets
LEAP P&L in Bear Case:
- EEM at $56 on Jan 15: Calls expire worthless, loss = -$4.6M (100% of premium)
- EEM at $58 on Jan 15: Calls expire worthless, loss = -$4.6M (100% of premium)
💡 Trading Ideas
🛡️ Conservative: The "Wait and See" Approach
Play: Buy shares of EEM on a confirmed break above $60, or accumulate in tranches near $57–$58 support
Why this works:
- 🎯 The gamma chart shows $59 as immediate support and $60 as the key resistance. A close above $60 on volume confirms the tariff-shock bottom is in
- 📉 If EEM dips back toward $57–$58 (within the weekly implied move range of $57.44–$60.89), the put gamma wall provides buying support — a good reload zone
- 💵 No options risk — you own the ETF outright, collect any distributions, and let the 10-month macro thesis play out
- 🛡️ Even in the base case, EEM recovering to $63–$65 from current $59 represents a 7–10% gain on the stock alone
Entry: $57.50–$59.50 | Target: $63–$65 | Stop: Close below $56 (below all gamma support)
Risk level: Low | Best for: Entry-level investors building EM exposure
⚖️ Balanced: Copy the Whale (Smaller Size)
Play: Buy the same January 2027 $62 calls — but right-sized for your portfolio
Why this works:
- 🐋 You're literally copying the institutional trade — same strike, same expiration, same directional thesis
- ⏰ The 10-month duration means time is your friend — no rush, no theta panic, just let the macro catalysts unfold
- 📊 At $4.60/contract cost, a 5-contract position (controlling 500 shares) costs only $2,300 — defined risk, unlimited upside
- 🎯 Breakeven at $66.60 — EEM only needs to recover from the current $59 zone back to the January highs AND add a bit more. Not outrageous.
- 💰 If EEM hits $66–$68 by year-end, these calls could double or triple from here
Estimated P&L:
- Cost: ~$4.60/contract (matches the whale's entry)
- EEM at $66: contracts worth ~$7–8, gain of $2.40–3.40 per share (52–74% ROI)
- EEM at $70: contracts worth ~$11, gain of ~$6.40 per share (139% ROI)
- EEM stays below $62: lose full premium — max loss is exactly what you paid
Position sizing: Risk only 2–5% of portfolio | Skill level: Intermediate
🚀 Aggressive: Near-Term Catalyst Play
Play: Buy shorter-dated calls to ride a potential quick bounce — March 20 OPEX $60 calls or April $60 calls
Why this could work:
- 🎯 EEM is sitting right at $59 gamma support with resistance just at $60 — a $1 move clears the key level
- 📊 Any positive trade war headline in the next 1–2 weeks (diplomatic meetings, exemption announcements) could spike EEM 3–5% instantly
- 💡 The weekly implied move of ±$1.72 means $60.89 is within the expected range — if the trade news cooperates, March 20 calls could pay off quickly
- 🚀 Near-term calls are significantly cheaper than LEAPs — lower dollar risk per trade
The serious risks:
- ⏰ Theta burns FAST: Short-dated options lose value every day if EEM stays flat
- 😱 Direction has to be right AND soon: Unlike the LEAP, you don't have 10 months for the thesis to work out
- 💸 If EEM dips to the $57.44 lower implied move range, these calls go to near zero quickly
- ⚠️ Trade war headlines can go either direction without warning — binary event risk
CRITICAL: This is a short-term directional bet with high binary risk. Position size accordingly — never more than 1–2% of your portfolio on a single short-dated directional trade.
Risk level: High | Skill level: Advanced options traders only
⚠️ Risk Factors
Don't get caught by these landmines:
-
🇨🇳 China concentration is both the opportunity AND the biggest risk: At 33% weight, EEM lives and dies by China. Any further US-China tariff escalation — new tech company sanctions, tariff hikes beyond current levels, or Chinese retaliation — could take EEM down another 10–15% quickly. The 33% China weight means there's no diversification saving you if Beijing-Washington tensions explode.
-
💵 Dollar reversal is the hidden killer: The entire 2025 EM bull run was powered by dollar weakness. If US tariff-driven inflation forces the Fed to pause or reverse rate cuts, the dollar could strengthen sharply — directly compressing EEM's USD returns even if local EM equity markets hold steady.
-
🏝️ Taiwan Strait remains a tail risk: A geopolitical escalation around Taiwan would simultaneously crater both the Taiwan (15%) AND South Korea (12%) allocations — together nearly 27% of the fund. A sudden deterioration in cross-strait relations is the kind of shock that could blow past all gamma support levels. CNBC has flagged the concentration risk in Northeast Asia exposed to Middle East and US-China flashpoints.
-
📉 The LEAP is all-or-nothing on the $62 strike: The $62 call expires worthless if EEM closes below $62 on January 15, 2027. Today's spot is $59.82. That's a 3.6% move required just to break even on the strike, plus you need to cover the $4.60 premium for actual profit (breakeven at $66.60 = 11.3% total move from today). Ten months feels like a long time — but if EM stays range-bound or sells off further, this position goes to zero.
-
🔄 EEM vs. EMXC rotation: Institutional investors worried about China risk have been rotating out of EEM into EMXC (the ex-China EM ETF). This structural AUM outflow creates persistent selling pressure that can cap recoveries. EEM's high 0.70% expense ratio vs VWO's 0.08% is another long-term headwind.
-
📊 China stimulus disappointment risk: The 15% MSCI China earnings growth consensus for 2026 is an aggressive projection. If Beijing's fiscal and monetary stimulus fails to revive consumption and the property sector overhang persists, earnings disappoint, and EEM's largest allocation drags the whole fund lower.
-
🌍 EM currency devaluation: Tariff-driven export compression puts pressure on EM local currencies — the Brazilian real, South African rand, Turkish lira. Even if local equity markets hold, USD-denominated EEM returns get compressed by currency weakness.
-
🎢 $60 resistance is a real ceiling: The gamma chart shows heavy call gamma at $60 — market makers will mechanically sell into rallies toward that level. Until EEM closes cleanly above $60 on solid volume, the path of least resistance remains choppy. The LEAP buyer needs sustained breakout momentum, not just a day-trip above $60.
🎯 The Bottom Line
Here's the deal: A whale just plunked down $4.6M on a 10-month call that EEM is going back to $62+ and beyond. This isn't a hedge — volume beat open interest, meaning they opened a fresh position while EEM was sitting right on key gamma support at $59. They could have bought anything. They chose the $62 LEAP.
What this trade tells us:
- 🐋 Someone with serious money sees the tariff-shock selloff as a buying opportunity, not a crisis — they're betting the macro tide turns positive within 10 months
- 💡 The $62 strike is where EEM was trading in late January before the tariff scare hit — the trader is essentially saying "we're going back to those levels AND higher"
- 🌏 The thesis requires at least one or two of these to happen: US-China trade de-escalation, continued dollar weakness, confirmed China stimulus delivery, three Fed rate cuts, or TSMC/Korea semiconductor outperformance
- ⏰ The January 2027 expiration captures the full 2026 catalyst calendar — nothing is being rushed
If you're interested in EM right now:
- ✅ Watch the $60 level closely — a clean close above it with volume is the bull signal the gamma chart is pointing to
- 📊 Track US-China diplomatic signals weekly — even rumor of trade talks resuming could add 3–5% to EEM fast
- 🎯 The implied move range of $57.44–$60.89 this week gives you the near-term playbook — dips to $57.50 are buyable dips if you believe the macro thesis
- 📅 April will be the moment of truth: TSMC earnings (April 17) and China GDP (April 16) arriving back-to-back could either confirm or shatter the bull case
If you're watching from the sidelines:
- ⏰ The next 2–3 weeks will tell us a lot — if EEM can hold $59 gamma support and make a run at $60, momentum is turning. If it breaks below $57, the bear case gets real.
- 🎯 Waiting for a confirmed break above $60 before entering is the disciplined play — let the tape confirm the thesis before committing
Mark your calendar — Key dates:
- 📅 March 13, 2026 — Weekly OPEX (3 days), implied range $57.44–$60.89
- 📅 March 20, 2026 — Monthly OPEX (~3.5% implied move)
- 📅 April 16, 2026 — China Q1 2026 GDP release
- 📅 April 17, 2026 — TSMC Q1 2026 earnings (EEM's biggest single holding)
- 📅 May 7, 2026 — Federal Reserve FOMC rate decision
- 📅 May 2026 — MSCI EM semi-annual index rebalance
- 📅 January 15, 2027 — Expiration of today's $4.6M LEAP call trade
Final verdict: EEM at $59 after an 8.41% tariff-shock selloff, sitting right on gamma support, with a whale loading $4.6M into LEAPs — that combination is worth paying attention to. The risk is real (China, dollar, geopolitics), but so is the reward (China stimulus execution + dollar weakness + three Fed cuts = genuine EM recovery). The LEAP buyer is betting the dip is done. Time will tell if they're right.
Keep your position sizes sane, watch the $60 level, and remember: the option market priced in ±$1.72 this week — anything beyond that is a surprise. Stay nimble. 💪
Disclaimer: Options trading involves substantial risk of loss and is not appropriate for all investors. This analysis is provided for educational and informational purposes only and does not constitute financial advice, investment recommendations, or a solicitation to buy or sell any securities. Past performance is not indicative of future results. The Z-score of 16.0 reflects this specific trade's size relative to recent EEM historical activity — it does not imply the trade will be profitable or that you should replicate it. LEAP options can expire completely worthless, resulting in 100% loss of premium paid. The trades and scenarios described involve significant risk including the potential loss of your entire investment. Emerging market investments carry additional risks including currency fluctuation, geopolitical instability, and limited regulatory oversight. Always conduct your own due diligence and consult with a licensed financial advisor before making any investment decisions.