:sunny: ENPH $1.2M Bullish Call Bet Targets Earnings Bounce! :chart_with_upwards_trend:
:calendar: January 22, 2026 | :fire: Unusual Activity Detected
:dart: The Quick Take
Someone just dropped $1.2 MILLION on ENPH calls expiring February 20th, betting on a rebound in the beaten-down solar stock! This 5,000 contract position at the $43 strike represents a bullish play heading into Q4 2025 earnings on February 3rd. With ENPH trading around $40 after a brutal -48% decline in 2025, this trader is positioning for a snapback rally. Translation: Institutional money sees value emerging from the solar wreckage - they're betting management calls the cycle trough correctly!
:bar_chart: Company Overview
Enphase Energy (ENPH) is a global energy technology leader in residential solar microinverters and battery storage systems:
- Market Cap: $4.71 Billion
- Industry: Semiconductors & Related Devices
- Current Price: ~$40.38 (trading near 52-week lows)
- Primary Business: Smart microinverter systems, battery storage, EV chargers, and home energy management platforms
Enphase leads the residential inverter market and has shipped over 84.8 million microinverters across 5+ million systems in 160+ countries. The company is navigating significant headwinds from the expiration of the Section 25D tax credit and elevated interest rates suppressing consumer demand.
:moneybag: The Option Flow Breakdown
The Tape (January 22, 2026):
| Date | Time | Symbol | Buy/Sell | Call/Put | Expiration | Strike | Volume | Premium | Order Type | Strategy | Confidence |
|---|---|---|---|---|---|---|---|---|---|---|---|
| 2026-01-22 | 12:10:23 | ENPH | BUY | CALL $43 | 2026-02-20 | $43.00 | 5,000 | $1,200,000 | BTO | Long Call | LOW |
:nerd_face: What This Actually Means
This is a directional bullish bet on ENPH bouncing into and through earnings! Here's the breakdown:
- :money_with_wings: Substantial premium paid: $1.2M ($2.40 per contract x 5,000 contracts)
- :dart: Strike selection: $43 is approximately 6.5% out-of-the-money from current price (~$40.38)
- :clock3: Strategic timing: 29 days to expiration captures Q4 2025 earnings on February 3rd
- :bar_chart: Size matters: 5,000 contracts represents 500,000 shares worth ~$20M notional exposure
- :chart_with_upwards_trend: Vol/OI Ratio: 178.57x indicates HIGH ACTIVITY relative to open interest
What's really happening here: This trader is making a calculated bet that ENPH has bottomed and will rally into or through Q4 earnings. With Goldman Sachs upgrading ENPH to Buy on January 20th with a $45 price target (above this strike!), the timing is notable. The $43 strike aligns almost perfectly with Goldman's target, suggesting this could be institutional money following the analyst upgrade.
Trade Profile:
- :green_circle: Breakeven: $45.40 at expiration ($43 strike + $2.40 premium)
- :dart: Profit zone: Stock needs to rise 12.4% from current levels to breakeven
- :moneybag: Max risk: $1.2M (entire premium)
- :rocket: Upside: Unlimited above breakeven
:chart_with_upwards_trend: Technical Setup / Chart Check-Up
YTD Performance Chart
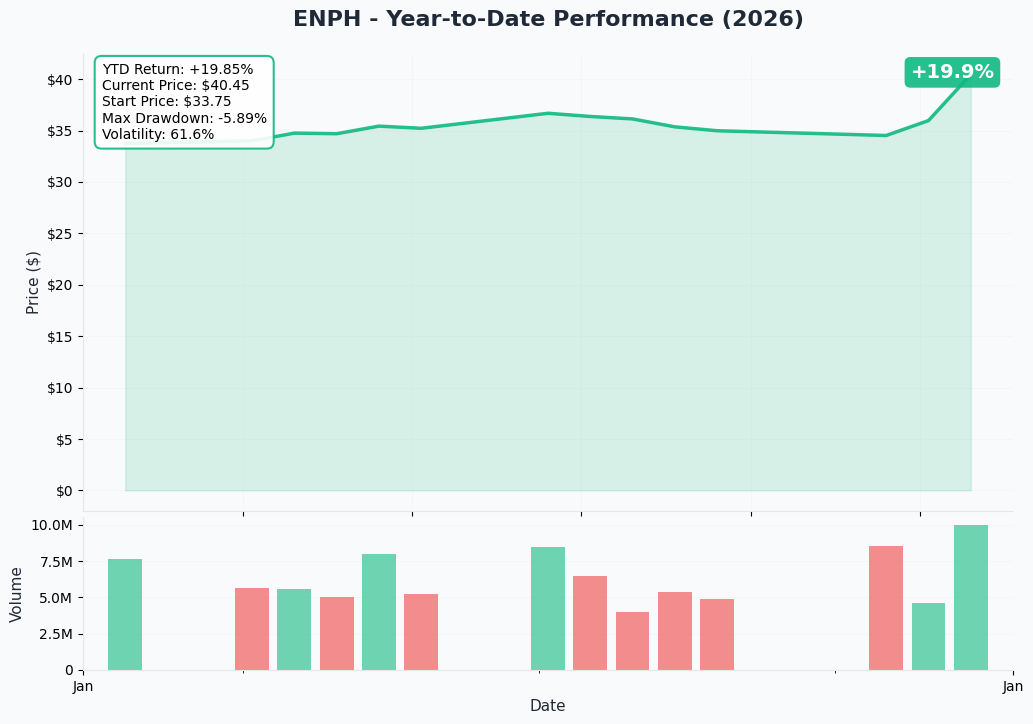
ENPH has been absolutely crushed - down -48.56% in 2025 with current price around $40.38. The stock started the year near $70 and has been in a persistent downtrend driven by solar market headwinds. After hitting a low of $25.78, there's been some stabilization in the $35-$40 range.
Key observations:
- :chart_with_downwards_trend: Brutal downtrend: Persistent selling pressure from policy uncertainty and demand weakness
- :shield: Support forming: $35 level has held multiple tests, suggesting potential base building
- :fire: Capitulation levels: Trading near 52-week lows with heavy seller exhaustion
- :mag: Recent catalyst: Goldman Sachs upgrade on January 20th sparked brief rally from $35 to $40+
- :thinking: Contrarian setup: Extreme pessimism often precedes turning points
Gamma-Based Support & Resistance Analysis
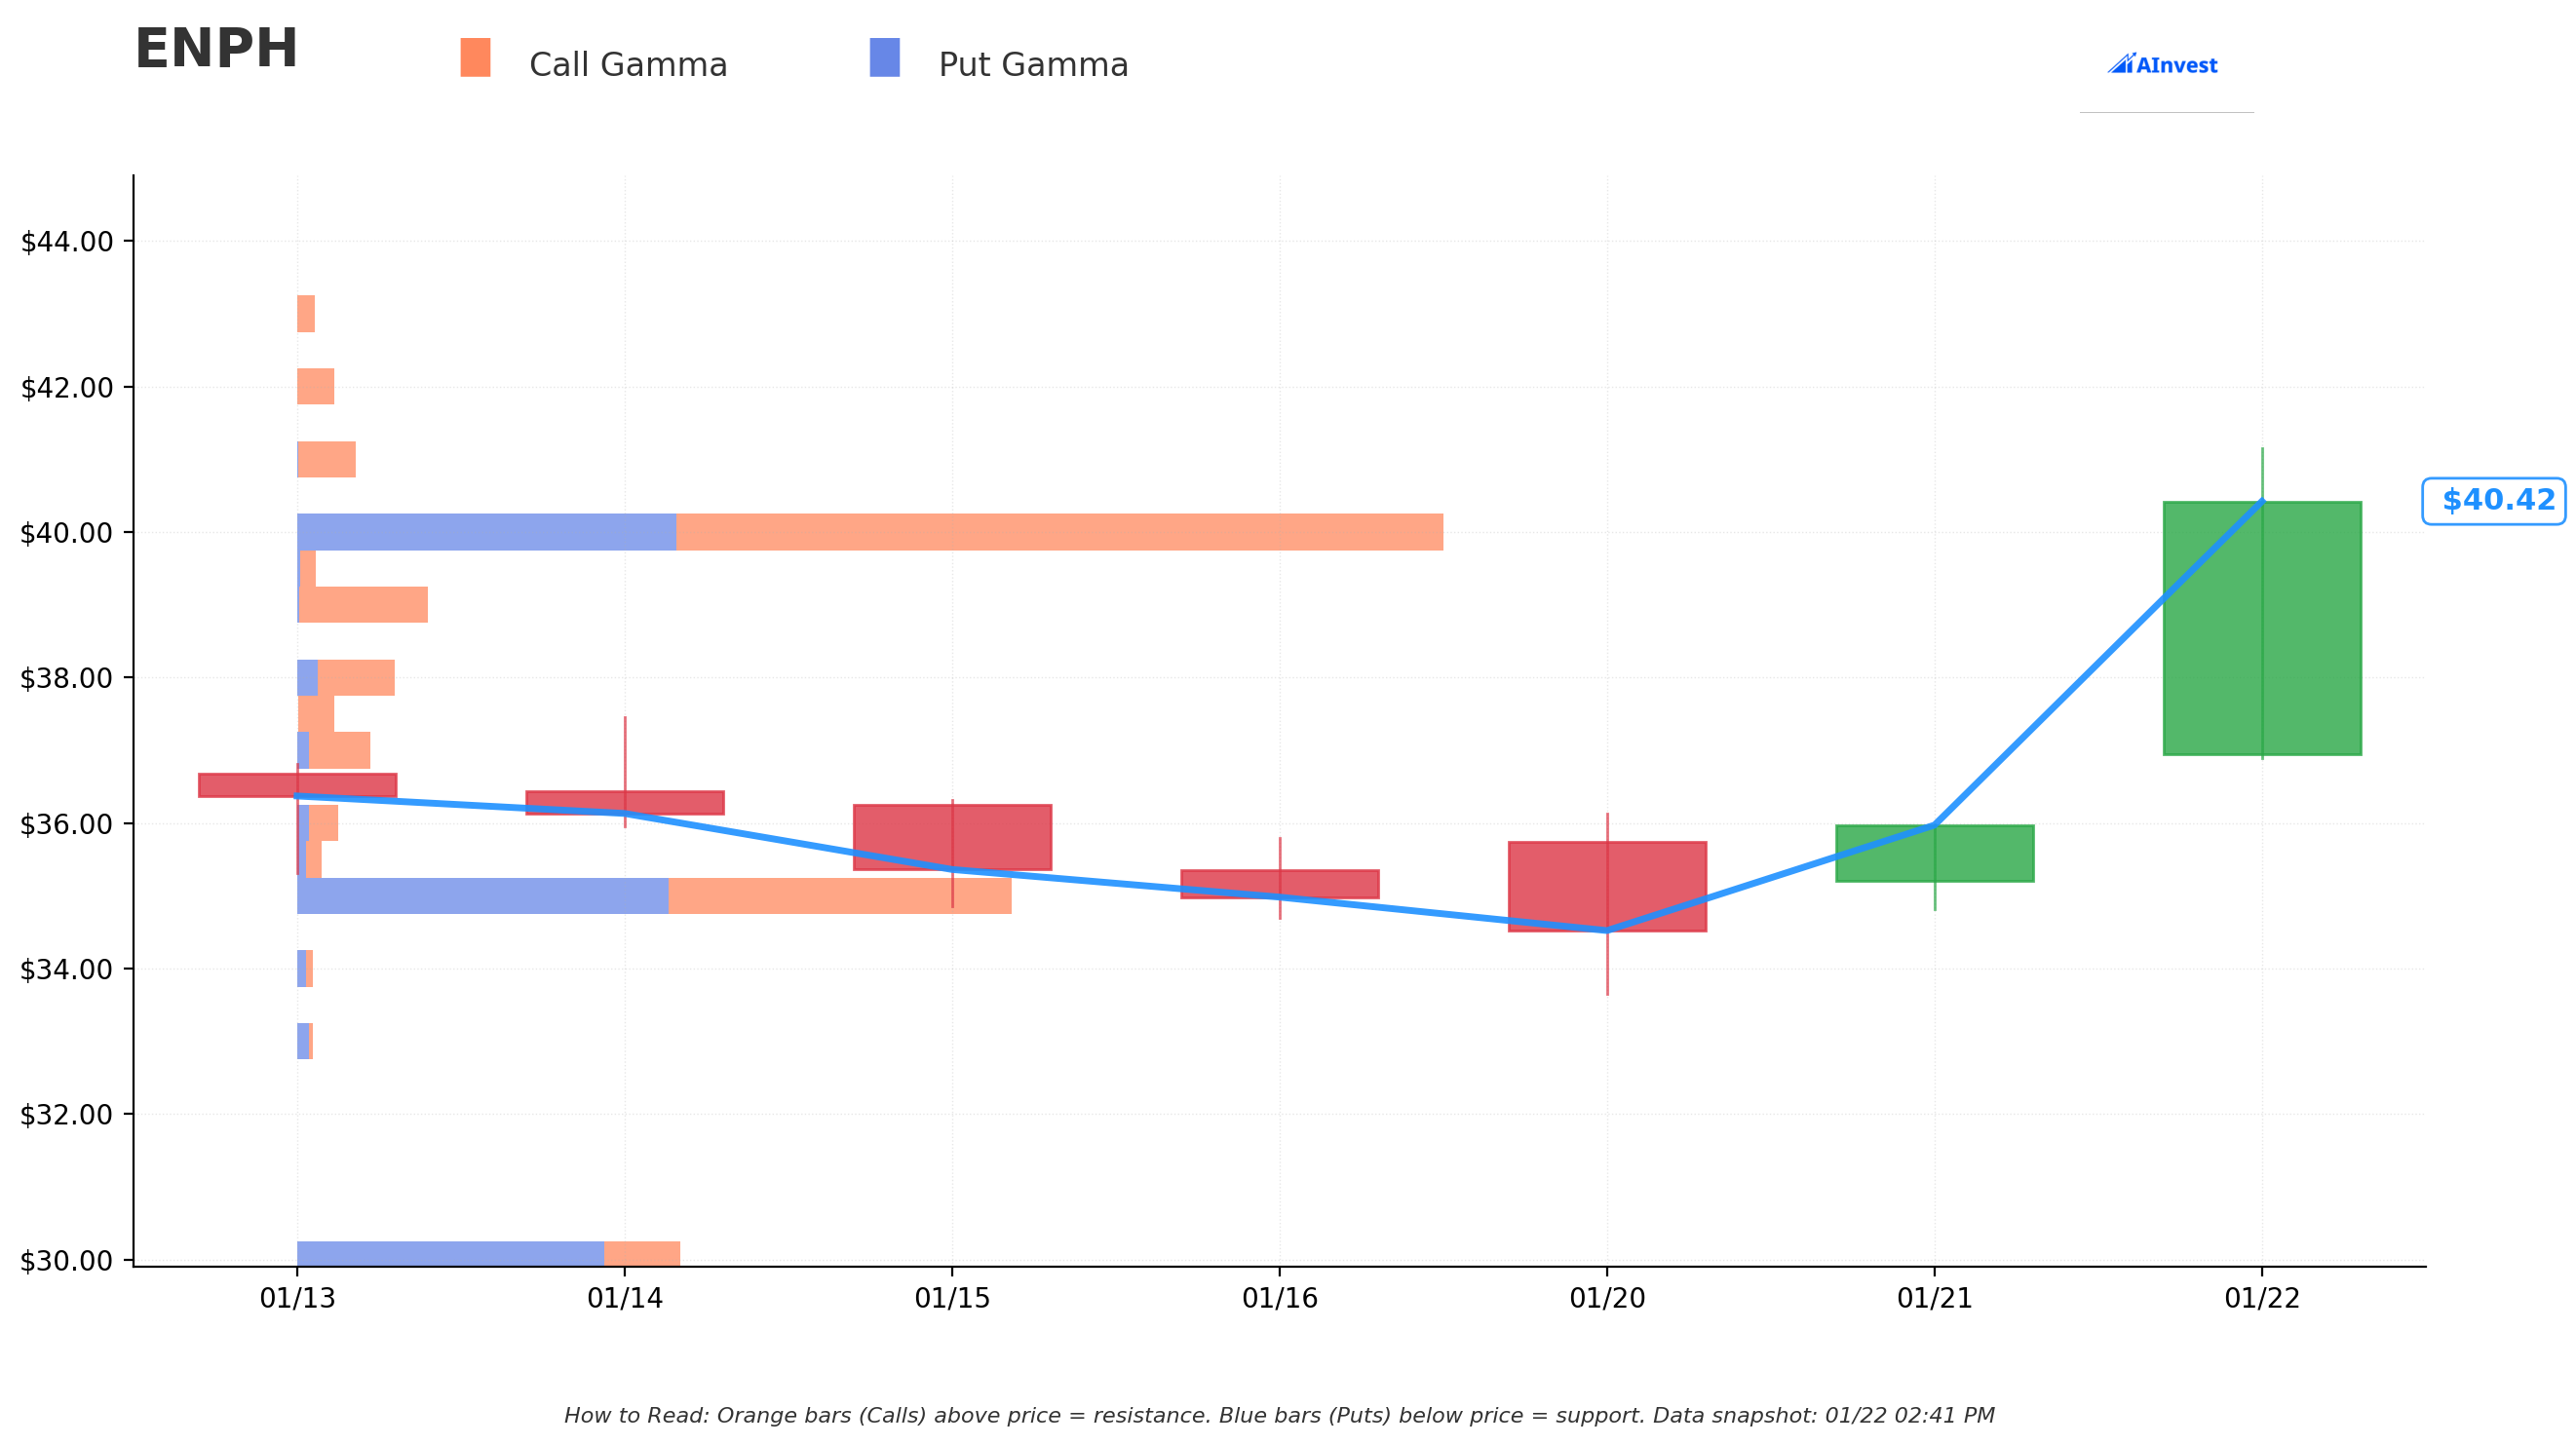
Current Price: $40.38
The gamma exposure map reveals critical price magnets and barriers:
:large_blue_circle: Support Levels (Below Current Price):
- $40.00 - Immediate support with 7.62B total gamma exposure (2.60B net GEX - strongest nearby floor!)
- $39.00 - Secondary support at 0.87B gamma (0.84B net - solid floor)
- $38.00 - Third level support at 0.60B gamma
- $37.00 - Extended support at 0.42B gamma
- $36.00 - Deeper support at 0.27B gamma
- $35.50 - Light support at 0.16B gamma
- $35.00 - MAJOR structural floor with 4.73B total gamma (put-heavy zone creating strong support)
:large_orange_circle: Resistance Levels (Above Current Price):
- $41.00 - Immediate ceiling with 0.39B gamma (1.5% overhead)
- $42.00 - Secondary resistance at 0.25B gamma (4% above current)
- $45.00 - Major resistance with 2.35B gamma (this is Goldman's price target zone!)
What this means for traders: ENPH is sitting right at strong $40 gamma support with relatively light resistance overhead until $45. The gamma structure is FAVORABLE for bulls - strong floor at $40, weak ceilings until the $45 target zone. The call buyer struck at $43 which sits in a "gamma gap" between $42 and $45, potentially allowing for a quick move if the stock breaks higher.
Net GEX Bias: Bullish (19.4B call gamma vs 9.9B put gamma) - Positioning suggests institutional traders are net long.
Implied Move Analysis
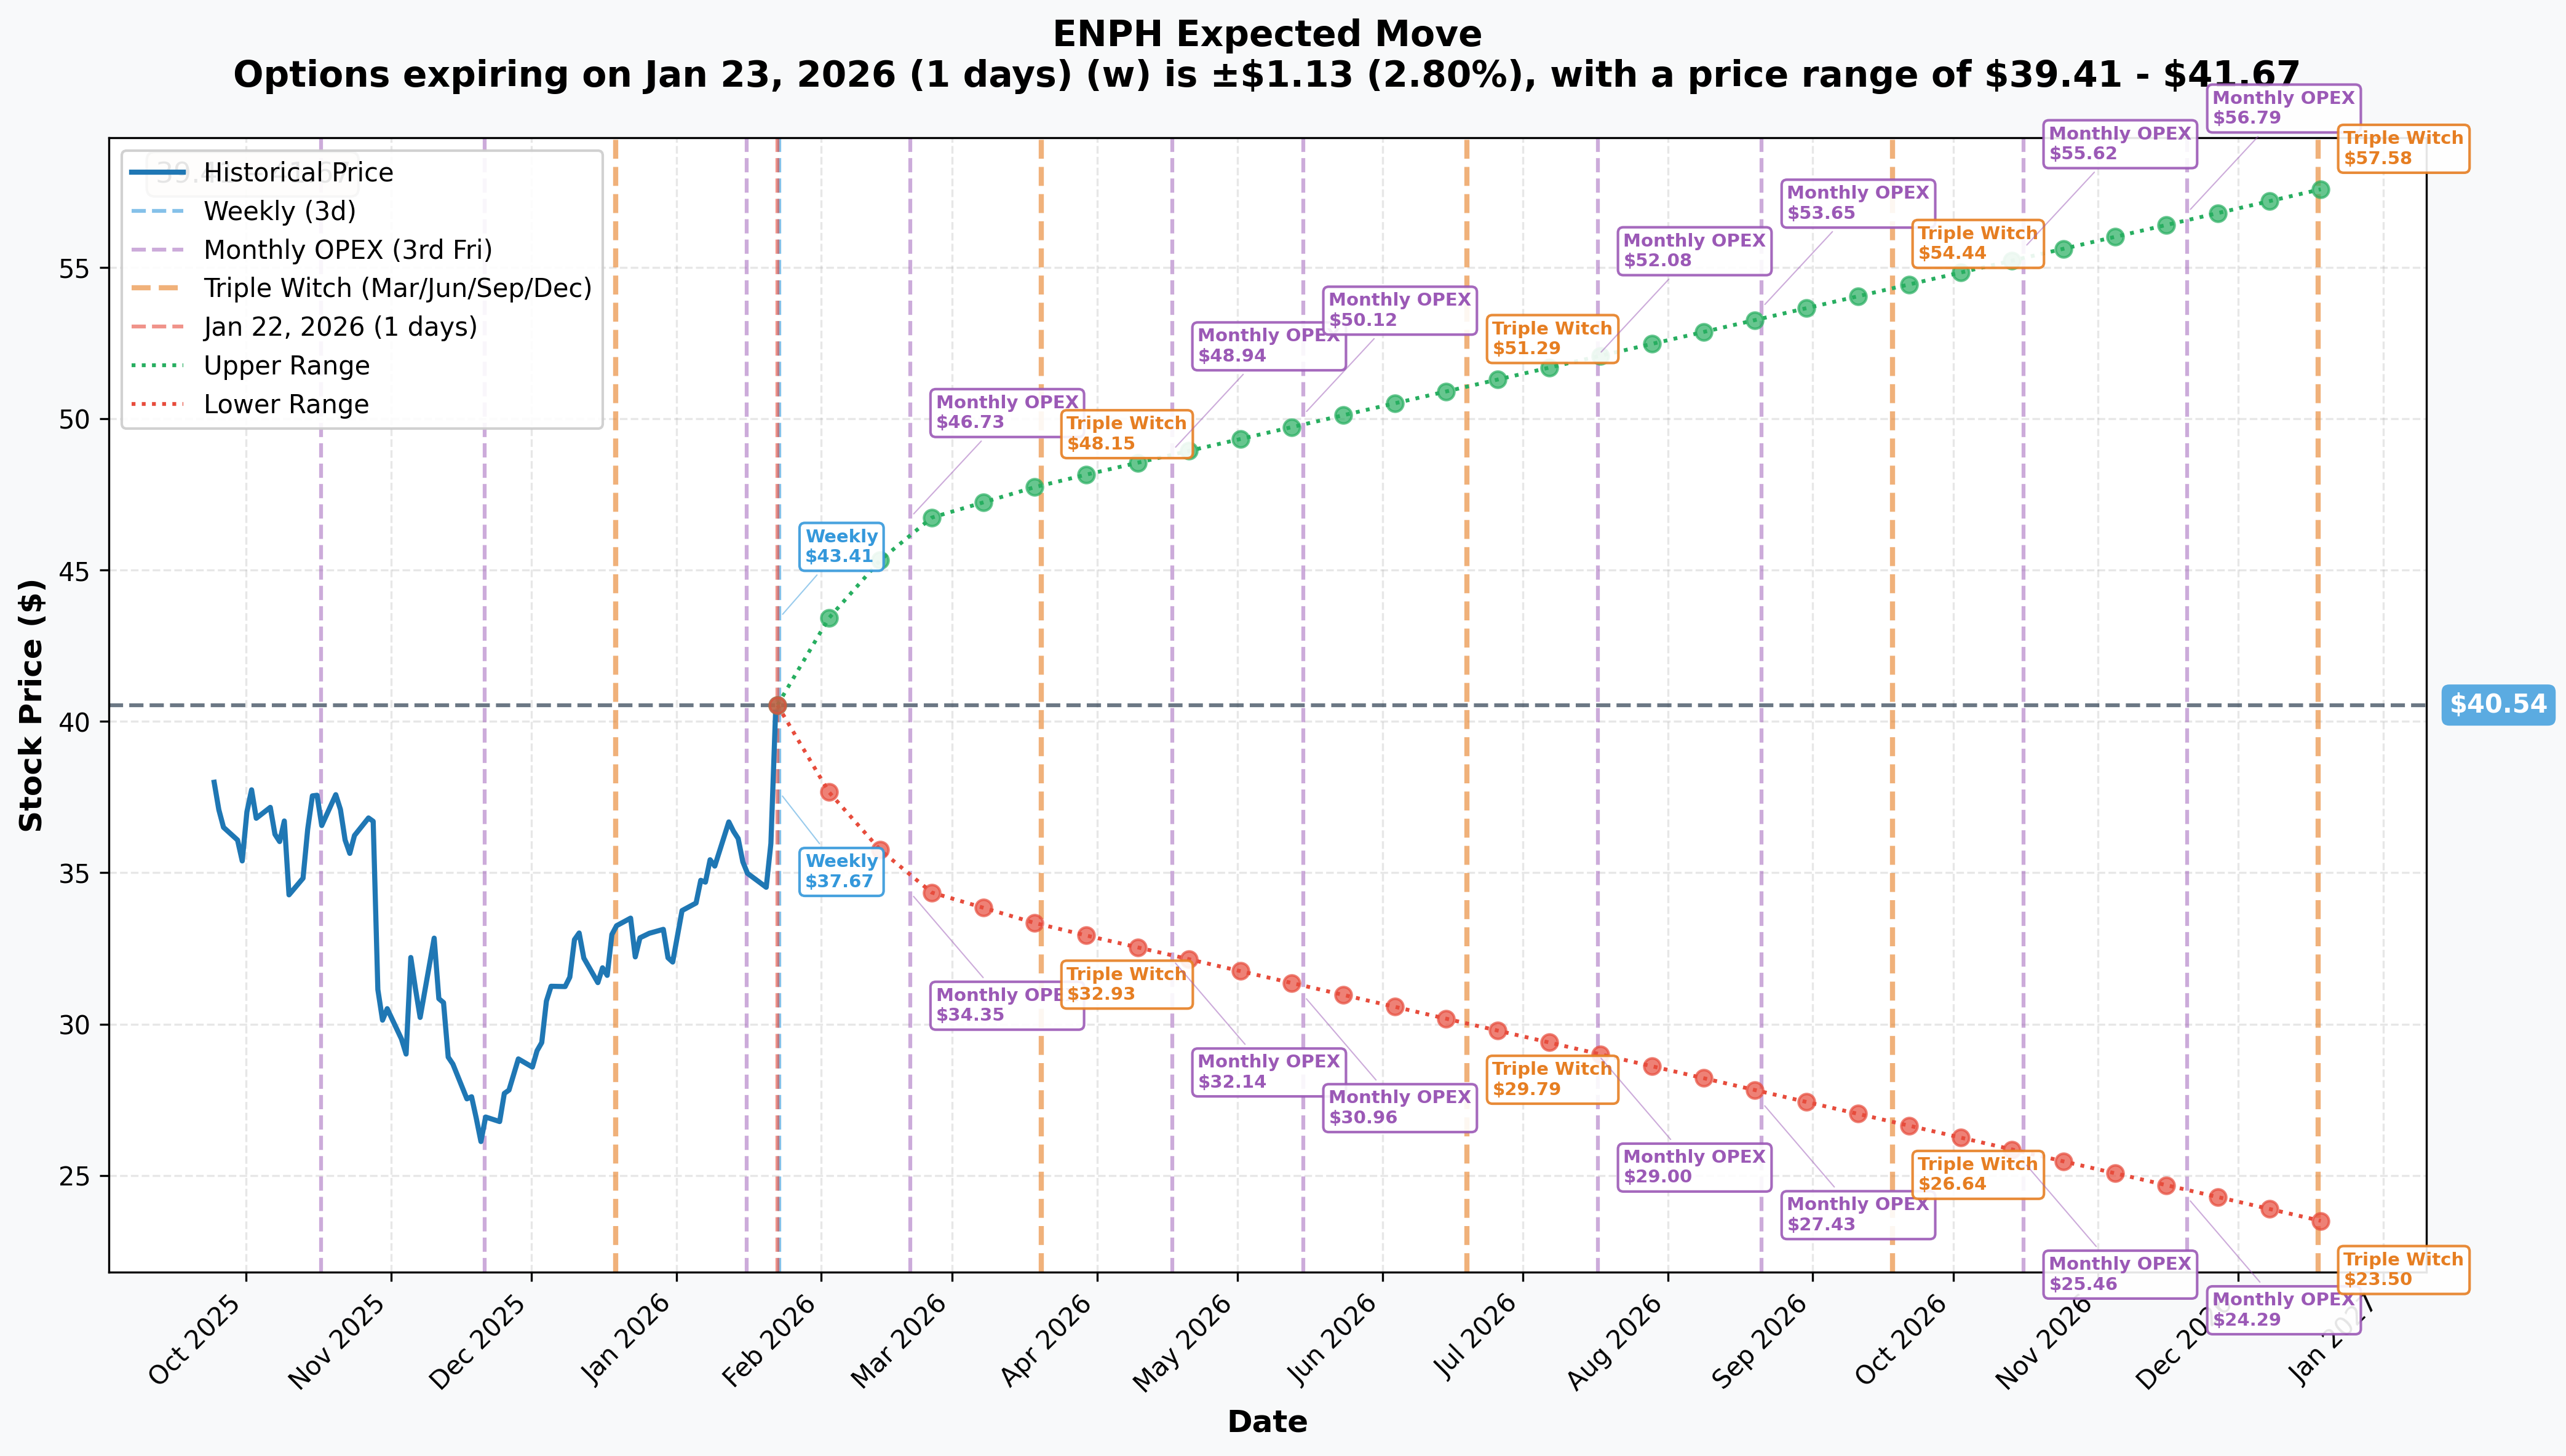
Options market pricing for upcoming expirations:
- :calendar: Weekly (Jan 23 - 1 day): +/-$1.13 (+/-2.8%) -> Range: $39.41 - $41.67
- :calendar: Monthly OPEX (Feb 20 - 29 days - THIS TRADE!): +/-$6.01 (+/-14.83%) -> Range: $34.53 - $46.55
- :calendar: Quarterly Triple Witch (Mar 20 - 57 days): +/-$7.29 (+/-17.98%) -> Range: $33.25 - $47.83
- :calendar: LEAPS (Dec 18 - 330 days): +/-$17.04 (+/-42.04%) -> Range: $23.50 - $57.58
Translation for regular folks: Options traders are pricing in a MASSIVE +/-14.83% move ($6) through February OPEX which includes Q4 2025 earnings on February 3rd. The market expects significant volatility around earnings - typical for a beaten-down stock with binary catalyst risk.
The February 20th implied move upper range of $46.55 puts the $43 strike WELL within reach if the stock rallies. In fact, it would only require about a 6.5% move to hit the strike - well below the 14.83% implied move. This suggests the call buyer sees favorable odds.
Key insight: The call buyer is essentially betting that ENPH will participate in at least HALF of the implied move to the upside. Given the stock's beaten-down status and Goldman's upgrade, this isn't an unreasonable thesis.
:circus_tent: Catalysts
:fire: Immediate Catalysts (Next 30 Days)
Q4 2025 Earnings - February 3, 2026 (12 DAYS AWAY!) :bar_chart:
ENPH reports fiscal Q4 results on Tuesday, February 3, 2026 with conference call at 4:30 PM ET. This is THE catalyst this trade is targeting:
- :bar_chart: Revenue guidance: $310-350 million (midpoint: $330M)
- :moneybag: EPS consensus: $0.58
- :battery: Battery shipments guidance: 140-160 MWh
- :chart_with_upwards_trend: Non-GAAP gross margin guidance: 42-45%
- :eyes: Key metrics to watch: TPO safe harbor contribution, battery attach rates, European recovery signals, tariff impact updates
Why this matters: Management has guided Q1 2026 as the "cycle trough" at approximately $250 million revenue. If they confirm sequential recovery beyond Q1 and provide constructive commentary on TPO demand and IQ9 traction, the stock could rally significantly.
Goldman Sachs Upgrade - January 20, 2026 :bank:
Just two days before this call trade, Goldman Sachs upgraded ENPH to Buy from Neutral with a $45 price target (raised from $29). This is a significant catalyst:
- :dart: The $45 price target is 11% above current price
- :bulb: Signals institutional recognition that the bottom may be in
- :chart_with_upwards_trend: Creates potential for momentum buying as funds adjust positions
- :thinking: The $43 strike on this trade sits just below Goldman's target - likely not coincidental!
:rocket: Recent Positive Catalysts (Last 90 Days)
IQ9 Commercial Microinverter Launch - January 12, 2026 :factory:
Enphase began commercial shipments of IQ9 GaN-powered microinverters - their most advanced technology:
- :zap: Industry-leading efficiency up to 97.5%
- :us: Manufactured in U.S. for domestic content requirements and FEOC compliance
- :shield: 25-year limited warranty
- :dart: Residential IQ9 expected Q1 2026 - additional revenue catalyst
Q3 2025 Beat - October 28, 2025 :moneybag:
Strong Q3 results exceeded expectations:
- :bar_chart: Revenue: $410.4M vs. $369.6M consensus (+29% sequential U.S. growth)
- :moneybag: Non-GAAP EPS: $0.90 vs. $0.60 consensus
- :battery: Record battery shipments: 195 MWh
- :bank: Strong cash position: $1.48 billion
TPO Safe Harbor Agreements - November 2025 :handshake:
Enphase secured significant third-party ownership agreements:
- ~$68 million projected revenue over 12-24 months
- ~$55 million additional revenue in Q4 2025 and Q1 2026
- Total safe harbor revenue: ~$123M pipeline providing demand visibility
CEO Insider Purchase - November 10, 2025 :briefcase:
CEO purchased 5,000 shares at $30.69 - signaling management confidence at depressed levels.
:warning: Headwind Catalysts (Risks)
Section 25D Tax Credit Expiration - December 31, 2025 :receipt:
The residential solar tax credit expired, eliminating the 30% federal incentive for customer-owned systems. This is the PRIMARY driver of current weakness and creates structural demand challenges for 2026.
Residential Solar Market Decline :chart_with_downwards_trend:
Residential solar installations forecast to fall 18% YoY in 2026 driven by:
- High interest rates suppressing consumer demand
- California NEM 3.0 reducing solar economics
- Policy uncertainty post-election
:game_die: Price Targets & Probabilities
Using gamma levels, implied move data, and upcoming catalysts, here are the scenarios through February 20th expiration:
:chart_with_upwards_trend: Bull Case (30% probability)
Target: $45-$50
How we get there:
- :muscle: Q4 earnings BEAT expectations (revenue $350M+ high-end of guidance)
- :rocket: Management confirms Q1 2026 is indeed the trough with sequential recovery beginning Q2
- :bulb: IQ9 residential launch generates strong pre-order interest
- :chart_with_upwards_trend: Goldman upgrade triggers additional analyst upgrades and fund flows
- :money_with_wings: TPO safe harbor revenue beats expectations, demonstrating pivot success
- :globe_with_meridians: European stabilization commentary reduces geographic risk concerns
- :dart: Stock breaks through $41-$42 resistance and tests Goldman's $45 target
In this scenario: The $43 calls would be worth $2-$7 each at expiration (currently $2.40 paid), generating 0-190% returns on the $1.2M position.
Why 30% probability: Requires multiple positive catalysts to align - earnings beat, constructive guidance, and market sentiment shift. Possible given Goldman upgrade momentum and technical base forming at $35-$40.
:dart: Base Case (45% probability)
Target: $38-$44 range (CHOPPY CONSOLIDATION)
Most likely scenario:
- :white_check_mark: Q4 earnings meet guidance (~$330M revenue, $0.55-0.60 EPS)
- :bar_chart: Management confirms "cycle trough" thesis but doesn't provide upside surprise
- :balance_scale: Market digests tax credit expiration impacts - some selling on any weakness
- :repeat: Trading range of $38-$44 as bulls and bears fight over narrative
- :thinking: Investors wait for Q1 2026 actual results to confirm recovery
- :zzz: Low conviction environment until clarity emerges on demand trajectory
In this scenario: The $43 calls expire near worthless to slightly in-the-money ($0-$2 value). The $1.2M position loses 20-100% of value depending on exact price at expiration.
Why 45% probability: Solar stocks remain in "show me" mode. Investors skeptical of recovery calls until proven with actual results. Goldman upgrade provides support but headwinds remain substantial.
:chart_with_downwards_trend: Bear Case (25% probability)
Target: $32-$38
What could go wrong:
- :worried: Q4 earnings miss guidance or management lowers Q1 outlook further
- :rotating_light: European weakness accelerates (Q3 already saw 38% QoQ decline)
- :receipt: Tariff impacts worse than expected, compressing margins below 42%
- :money_with_wings: Safe harbor revenue disappoints, questioning TPO pivot thesis
- :chart_with_downwards_trend: Broader solar selloff drags sector lower (SolarEdge, First Solar weakness)
- :hammer: Break below $35 support triggers cascade to 52-week low at $25.78
Critical support levels:
- :shield: $40: Major gamma floor (7.6B) - MUST HOLD
- :shield: $35: Structural support (4.7B gamma) - disaster if broken
- :shield: $25.78: 52-week low - capitulation level
In this scenario: The $43 calls expire worthless, losing the entire $1.2M premium.
Why 25% probability: Q3 results were strong and management has provided clear guidance. While risks exist, the worst may be priced in at current levels. However, sector sentiment remains fragile.
:bulb: Trading Ideas
:shield: Conservative: Wait for Earnings Clarity
Play: Stay on sidelines until after February 3rd earnings volatility settles
Why this works:
- :clock3: Earnings in 12 days creates binary event risk with +/-14.8% implied move
- :money_with_wings: Options premiums inflated pre-earnings - better prices post-IV crush
- :bar_chart: Stock down 48% YTD - catching falling knives is dangerous
- :dart: Better entry likely post-earnings after direction becomes clear
- :thinking: The "cycle trough" thesis needs Q1 2026 proof, not just management assurances
Action plan:
- :eyes: Watch February 3rd earnings for revenue ($330M target), margins (42-45%), and Q1 guidance
- :dart: If stock pulls back to $35-$38 post-earnings with constructive outlook, consider entry
- :white_check_mark: Need to see TPO traction and IQ9 demand before committing capital
- :bar_chart: Monitor unusual options activity - if institutions add more calls, sentiment shifting
Risk level: Minimal (cash position) | Skill level: Beginner-friendly
:balance_scale: Balanced: Post-Earnings Call Spread
Play: After earnings, buy call spread targeting Goldman's $45 target
Structure: Buy $40 calls, Sell $45 calls (March 20 expiration)
Why this works:
- :roller_coaster: IV crush after earnings makes spreads cheaper - buy AFTER volatility drops
- :bar_chart: Defined risk spread ($5 wide = $500 max risk per spread)
- :dart: Targets Goldman's $45 price target with reasonable probability
- :clock3: March expiration gives 45+ days for thesis to play out
- :shield: Limits loss if recovery thesis fails
Estimated P&L (adjust after seeing post-earnings IV):
- :moneybag: Pay ~$1.50-2.00 net debit per spread post-earnings
- :chart_with_upwards_trend: Max profit: $300-350 if ENPH above $45 at March expiration
- :chart_with_downwards_trend: Max loss: $150-200 if ENPH below $40 (defined and limited)
- :dart: Breakeven: ~$41.50-42.00
- :bar_chart: Risk/Reward: ~1.5:1 to 2:1
Entry timing:
- :clock3: Wait 2-3 days post-earnings (by Feb 5-6) for full IV collapse
- :dart: Only enter if stock holds above $38 and guidance is constructive
- :x: Skip if stock below $35 (bearish confirmation)
Risk level: Moderate (defined risk, bullish directional) | Skill level: Intermediate
:rocket: Aggressive: Follow the Flow - Long Calls
Play: Buy calls copying the institutional positioning
Structure: Buy $43 calls February 20 expiration (same as the $1.2M trade)
Why this could work:
- :whale: Following $1.2M institutional bet with defined risk
- :bank: Goldman upgrade to Buy with $45 target validates the strike selection
- :chart_with_upwards_trend: Stock at 52-week lows with potential mean reversion
- :bar_chart: Implied move of +/-14.8% to Feb OPEX means $43 is achievable
- :money_with_wings: Contrarian play in hated sector often generates outsized returns
Why this could blow up (SERIOUS RISKS):
- :money_with_wings: EXPENSIVE RELATIVE TO PROBABILITY: ~$2.40 cost requires 12%+ rally to breakeven
- :clock3: TIME DECAY: Only 29 days to expiration - theta burns fast
- :worried: EARNINGS RISK: Miss or weak guidance could gap stock to $35
- :bar_chart: Sector headwinds: Tax credit expiration creates structural demand problem
- :warning: Solar stocks have disappointed repeatedly - "this time is different" rarely works
Estimated P&L:
- :moneybag: Cost: ~$2.40 per contract ($240 per contract)
- :chart_with_upwards_trend: Profit scenario: Stock hits $47 = ~$4.00 profit (167% ROI)
- :rocket: Home run: Stock hits $50 = ~$7.00 profit (292% ROI)
- :chart_with_downwards_trend: Loss scenario: Stock flat at $40 = lose entire premium (-100%)
- :skull: Total loss: Stock drops to $35 = lose entire premium (-100%)
Position sizing: Risk only 1-2% of portfolio - this is pure speculation
Risk level: HIGH (can lose 100% of premium) | Skill level: Advanced
:warning: Risk Factors
Don't get caught by these potential landmines:
-
:clock3: Earnings binary event in 12 days: Results Tuesday February 3rd create MASSIVE volatility risk. Stock could gap 10-15% either direction based on revenue ($310-350M guidance), margins (42-45% target), and Q1 outlook. The "cycle trough" narrative needs validation - any disappointment could trigger flush to $30s.
-
:receipt: Tax credit expiration structural headwind: The Section 25D residential solar tax credit expired December 31, 2025, eliminating the 30% federal incentive for customer-owned systems. This creates a fundamental demand problem that no amount of product innovation can fully offset in the near-term.
-
:chart_with_downwards_trend: Residential solar market in decline: Residential installations forecast to fall 18% YoY in 2026. High interest rates, NEM 3.0 in California, and economic uncertainty are suppressing demand. This isn't a cyclical pause - it's a structural reset.
-
:globe_with_meridians: European weakness accelerating: Q3 2025 European revenue declined 38% QoQ with Netherlands and France markets struggling. Europe was supposed to offset U.S. weakness - instead it's adding to problems.
-
:moneybag: Tariff margin compression: 145% tariffs on Chinese products impacting battery segment. Q4 gross margin guidance of 42-45% is BELOW historical 49-50% levels. Margin recovery not expected until Q2 2026.
-
:balance_scale: Competition intensifying: SolarEdge stock doubled in 2025 with turnaround execution. Tesla gaining inverter market share with Powerwall 3 integrated solution. ENPH's premium positioning under pressure.
-
:receipt: Section 48E expiration looming (2027): The business-claimed credits for TPO models expire end of 2027. ENPH's pivot to TPO has limited runway before this incentive also disappears.
-
:bar_chart: Analyst consensus remains cautious: Despite Goldman upgrade, consensus is Hold with 32% at Sell/Strong Sell ratings. Not everyone believes the bottom is in.
-
:roller_coaster: High volatility creates whipsaw risk: Implied vol of ~50-60% means ENPH can move $2-4 on no news. This beaten-down stock attracts short-sellers who can squeeze higher OR drive lower on any catalyst.
:dart: The Bottom Line
Real talk: Someone just bet $1.2 MILLION that ENPH rebounds into Q4 earnings on February 3rd. This is a CONTRARIAN bullish play on a stock that's been absolutely crushed (-48% in 2025). The timing - just two days after Goldman's upgrade to Buy with a $45 target - suggests this could be institutional money following analyst conviction.
What this trade tells us:
- :dart: Sophisticated player expects ENPH to rally at least 6.5% to reach the $43 strike
- :money_with_wings: They're confident enough to risk $1.2M on a beaten-down solar stock
- :balance_scale: The strike at $43 aligns with Goldman's $45 target - targeting the analyst thesis
- :bar_chart: Gamma positioning is FAVORABLE for bulls with strong $40 support and weak overhead resistance
- :clock3: February 20th expiration captures earnings reaction AND post-earnings momentum
This is a HIGH CONVICTION bullish bet on the "cycle trough" narrative proving accurate.
If you like ENPH:
- :white_check_mark: Consider waiting for post-earnings entry at $35-38 for better risk/reward
- :bar_chart: The Goldman upgrade provides institutional backing for the thesis
- :clock3: Q4 earnings on February 3rd is THE catalyst - position accordingly
- :dart: Target $45 (Goldman target) as upside, $35 as support
If you're skeptical:
- :clock3: Don't short into earnings - the stock is already down 48% and could squeeze
- :bar_chart: Post-earnings put spreads ($40/$35) offer defined-risk bearish plays if results disappoint
- :warning: Solar sector sentiment is terrible - contrarian plays have failed repeatedly
- :eyes: Watch for break below $35 for confirmation bears are winning
If you're watching from sidelines:
- :clock3: Tuesday February 3rd after close is the moment of truth - DO NOT enter before earnings
- :dart: Best entry: Post-earnings pullback to $35-38 on constructive guidance
- :bar_chart: Looking for: Revenue beat, margin stabilization, TPO traction, IQ9 demand signals
- :thinking: The CEO bought at $30.69 in November - management has skin in the game
Mark your calendar - Key dates:
- :calendar: February 3 (Tuesday) after market close - Q4 FY2025 earnings report (12 DAYS!)
- :calendar: February 4 (Wednesday) - Post-earnings price action and analyst reactions
- :calendar: February 20 - Monthly OPEX, expiration of this $1.2M call trade
- :calendar: Q1 2026 (April/May) - Q1 results will confirm or deny "cycle trough" thesis
- :calendar: H1 2026 - IQ9 residential shipments begin
Final verdict: ENPH is a HIGH RISK/HIGH REWARD play at current levels. The stock is down 48%, hated by the market, facing real structural headwinds from tax credit expiration. BUT - it's also the residential inverter leader with $1.48B cash, new GaN technology (IQ9), and a management team calling the bottom. The $1.2M call buy signals at least one institutional player believes the worst is priced in.
If management is right about Q1 2026 being the trough, this stock could rally 30-50% from here over the next 12 months. If they're wrong, it's going back to $25.
The call buyer is betting on the former. Are you?
Disclaimer: Options trading involves substantial risk of loss and is not suitable for all investors. This analysis is for educational purposes only and not financial advice. Past performance doesn't guarantee future results. The trade documented represents institutional positioning that may not be appropriate for retail traders. Solar stocks are highly volatile and subject to policy risks. Always do your own research and consider consulting a licensed financial advisor before trading. Earnings create binary event risk with potential for 10-15% gaps either direction.
About Enphase Energy: Enphase Energy is a global energy technology company that delivers smart, easy-to-use solutions managing solar generation, storage, and communication on one platform. With a market cap of $4.71 billion in the Semiconductors & Related Devices industry, Enphase is the leading residential inverter supplier with over 84.8 million microinverters shipped to 5+ million systems across 160+ countries.