🛡️ Massive $44M EXPE Covered Call: Institutions Lock in Gains After 55% Rally
🎯 Quick Take
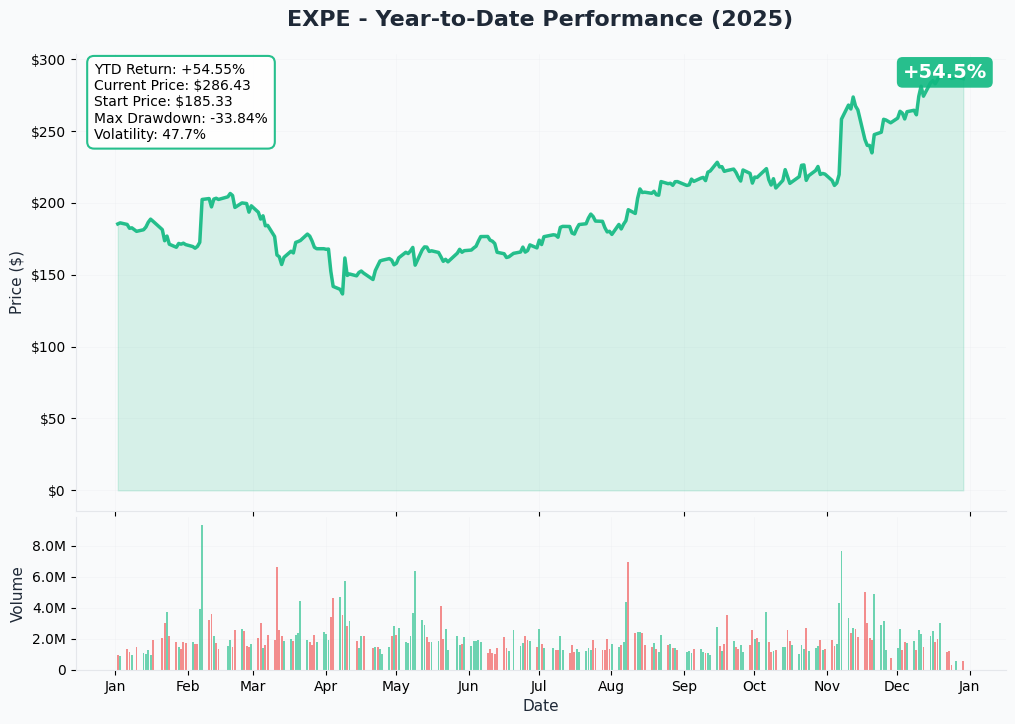
Someone just collected $44 million in premium by selling 5,100 EXPE January $200 calls with the stock trading at $286.21. This isn't panic selling—it's sophisticated profit-taking. With EXPE sitting just $6 below its all-time high after a spectacular 55% YTD run, and Q4 earnings not until February 5th (Nasdaq earnings calendar), a large institutional holder is using covered calls to lock in gains while maintaining downside protection to $199.81. Let's decode what this defensive positioning tells us about the next 25 days.
📊 Option Flow Breakdown
The Trade:
The Tape (December 29, 2025):
| Time | Symbol | Side | Buy/Sell | Type | Expiration | Premium | Strike | Volume | OI | Size | Spot | Option Price |
|---|---|---|---|---|---|---|---|---|---|---|---|---|
| 12:20:15 | EXPE | BID | SELL | CALL $200 | 2026-01-23 | $44M | $200 | 5,100 | 5,100 | 5,100 | $286.21 | $86.40 |
Trade Details:
| Field | Value |
|---|---|
| Date/Time | December 29, 2025 at 12:20:15 PM ET |
| Trade | 5,100 contracts SELL TO OPEN |
| Strike | $200 calls (30% below current price) |
| Expiration | January 23, 2026 (25 days out) |
| Premium | $44,064,000 ($86.40 per contract) |
| Current Spot | $286.21 |
| Intrinsic Value | $86.21 per share ($8,621,000 per contract) |
| Time Premium | $0.19 per contract (0.2% of total premium) |
| Strategy | Covered Call (neutral to bearish) or Naked Short Call (strongly bearish) |
What This Means: This is a deep in-the-money (ITM) call sale with just $0.19 of time value remaining. The most likely interpretation: an institutional holder owns 510,000 shares of EXPE (current value: $145.96M) and is selling covered calls to generate $44M in premium income while prepared to exit the position if assigned. This structure provides a 30% downside cushion while capping upside at current levels.
Why This Structure?
- Capital Efficiency: Reduces effective cost basis from $286.21 to $199.81 (30% protection)
- Income Generation: $44M premium = 30.2% return on underlying position value
- Pre-Earnings Positioning: Expires January 23, avoiding February 5 earnings risk
- Profit Taking: Locks in gains after 55% YTD rally with limited further upside expected
Breakeven at Expiration: The covered call holder breaks even down to $199.81 (current price minus premium collected). Above $286.40, they forgo additional gains but keep the shares. Below $199.81, premium protection is exhausted and stock losses begin.
📈 Technical Setup
Key Technical Levels:
- All-Time High: $292.42 (December 2025) (Yahoo Finance)
- Current Price: $286.21
- Distance from ATH: -2.1%
- 52-Week Low: $130.01 (+120% from lows)
- YTD Performance: +55.5% (Stock Analysis)
Recent Price Action: EXPE rallied from $240 to current levels following a comprehensive Q3 earnings beat on November 6, 2025. The company reported revenue of $4.41B (beating $4.28B estimates), adjusted EPS of $7.57 (vs. $6.98 consensus), and raised full-year guidance with gross bookings growth upgraded to ~7% (Business Wire Q3 results). B2B segment revenue surged 18% with bookings up 26%, marking the 17th consecutive quarter of double-digit B2B growth.
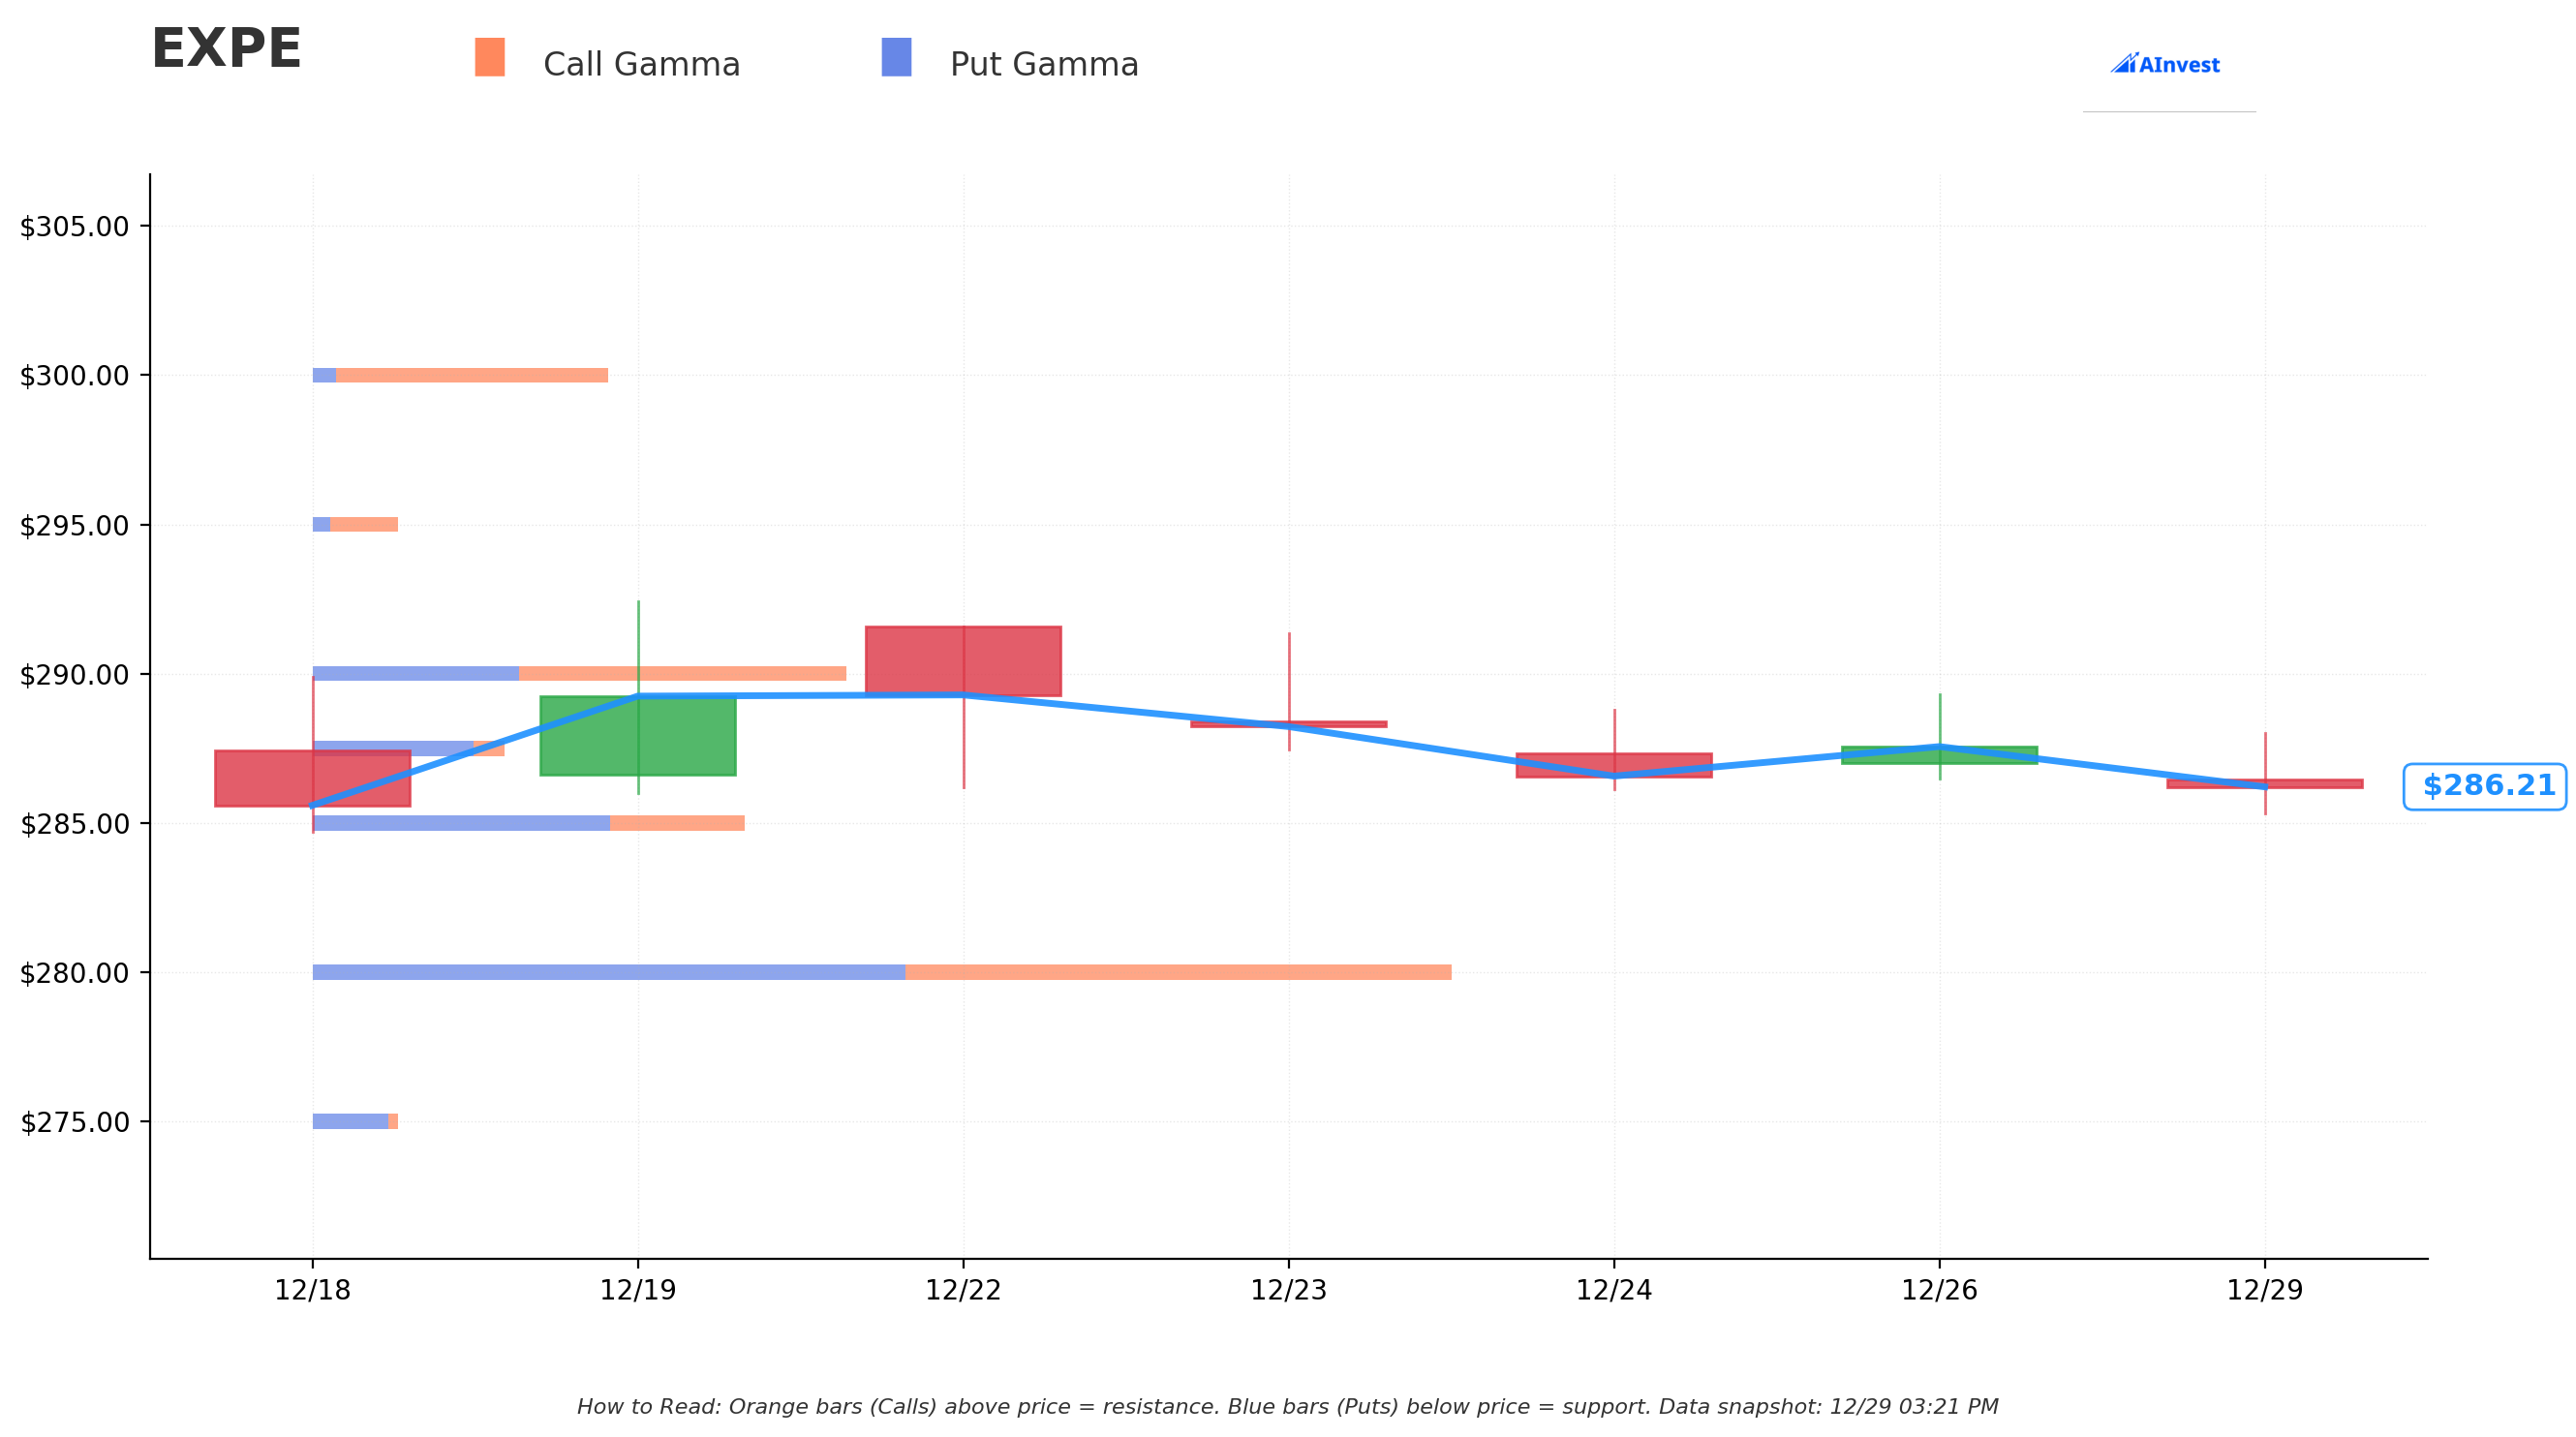
Gamma Exposure Analysis: Unlike mega-cap tech names, EXPE shows minimal dealer gamma positioning. The absence of major gamma walls or support/resistance levels suggests greater sensitivity to fundamental catalysts versus options-driven price action. Without gamma "speed bumps," EXPE could more easily push to $300+ on positive news or decline rapidly on negative catalysts.
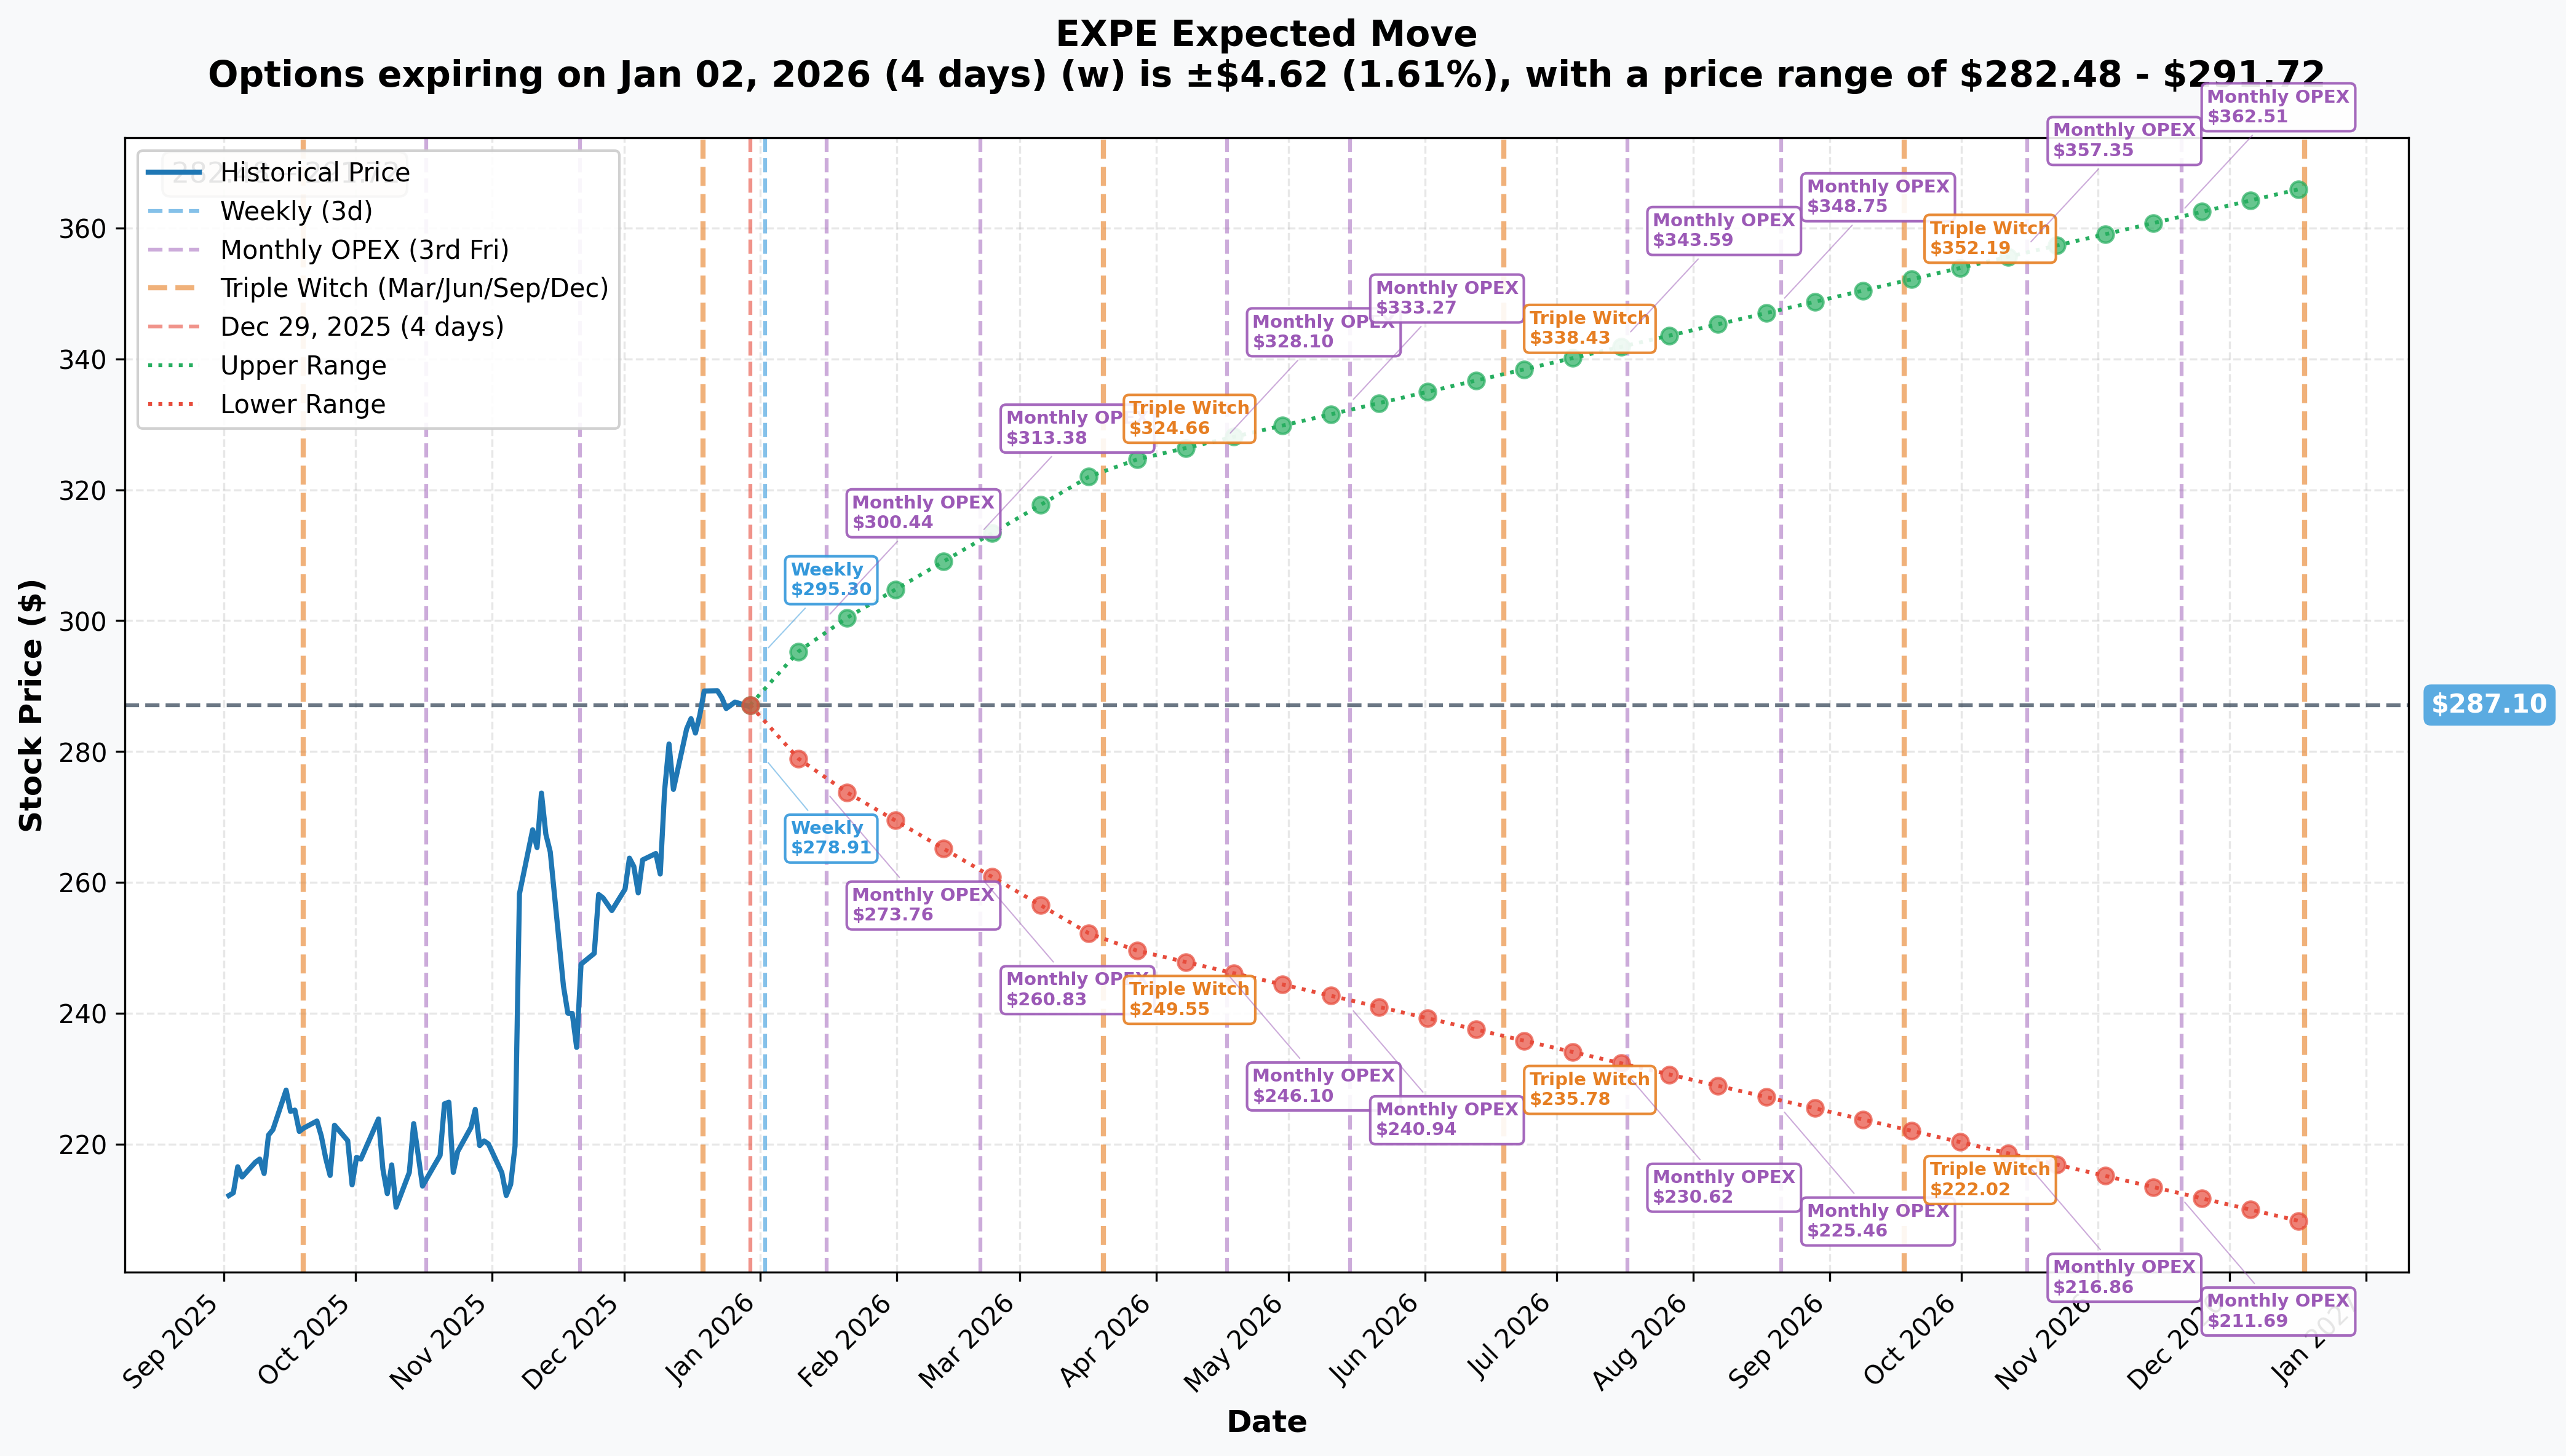
Implied Volatility & Expected Moves:
| Timeframe | Expiration | Implied Move | Price Range | Events |
|---|---|---|---|---|
| Weekly | Jan 2, 2026 | ±1.61% | $282.48 - $291.72 | New Year rollover |
| Monthly OPEX | Jan 16, 2026 | ±4.10% | $275.33 - $298.87 | Monthly options expiration |
| Trade Expiry | Jan 23, 2026 | ~±4.5% | ~$274 - ~$300 | 25 days out |
| Quarterly | Mar 20, 2026 | ±12.70% | $250.64 - $323.57 | Post-earnings move |
January 23 Expiration Math: The implied move suggests a $274-$300 range by expiration—the $200 strike is 37% below the lower bound, indicating the market prices less than 5% probability of EXPE trading below $200. This deep ITM positioning reflects defensive structuring rather than directional conviction in collapse.
🔥 Catalysts: What's Driving This Trade
✅ RECENT: Q3 2025 Earnings Blowout (November 6, 2025)
Record Quarter Performance:
Expedia delivered across all metrics according to TradingView/Zacks analysis:
| Metric | Actual | Estimate | Beat |
|---|---|---|---|
| Revenue | $4.41B | $4.28B | +3.0% |
| Adj. EPS | $7.57 | $6.98 | +8.5% |
| Gross Bookings | $30.7B | N/A | +12% YoY |
| Adj. EBITDA | $1.4B | N/A | +16% YoY |
| EBITDA Margin | 33% | N/A | +208 bps |
Key Drivers:
- B2B Dominance: Revenue +18%, bookings +26% in B2B segment (PYMNTS coverage)
- U.S. Acceleration: Room nights +11%, fastest U.S. growth in three years
- Margin Expansion: EBITDA margin grew 208 bps, doubling prior guidance
- Raised Guidance: Full-year gross bookings upgraded to ~7% (from 3-5%), margin expansion doubled to 200 bps (Yahoo Finance earnings highlights)
🎯 UPCOMING: Q4 2025 Earnings (February 5, 2026)
Confirmed Date: Wednesday, February 5, 2026 after market close (Nasdaq earnings calendar)
Consensus Estimates:
- EPS: $3.24
- Revenue Growth: 6-8% (per raised guidance)
- Gross Bookings Growth: 6-8%
- EBITDA Margin: +200 bps YoY expansion
Key Metrics to Watch:
- B2B Continuation: Can the 18th consecutive quarter of double-digit growth continue?
- Tiqets Integration: Progress on the December acquisition closing in Q1 2026 (Business Wire acquisition announcement)
- U.S. Demand Trends: Recovery from Q1 2025's revenue miss that triggered an 8% decline (AInvest analysis)
- Vrbo Positioning: Market share trajectory versus Airbnb (currently 9% vs. Airbnb's 44% in short-term rentals) (Skift rental market analysis)
- AI Product Traction: Adoption of Instagram Trip Matching and AI agents
Trade Timing Insight: This option expires January 23—13 days before earnings. The seller avoids earnings volatility entirely, suggesting this is risk management, not a bearish earnings bet.
🤖 AI TRANSFORMATION: Strategic Partnerships & Product Rollouts
Major AI Initiatives:
CEO Ariane Gorin has acknowledged AI as existential but transformative, per Fortune interview:
- OpenAI Operator Integration: AI agent for comprehensive trip planning
- Microsoft Copilot Actions: Seamless booking via Copilot interface
- Instagram Trip Matching: First-of-its-kind feature converting Instagram reels into personalized travel recommendations
- Hotels.com AI Agent: End-to-end booking assistance
Market Context: According to CNBC travel trends, 42% of travelers already use AI for trip planning in 2025. The risk: AI tools could enable travelers to bypass OTAs entirely. Gorin warned AI would be "very disruptive" without successful adaptation (Hospitality Net trends).
Strategic Response: Expedia invested heavily in partnerships to ensure brand visibility within AI booking flows. Success here could drive multiple expansion; failure could accelerate disintermediation.
💰 M&A EXPANSION: Tiqets Acquisition (December 10, 2025)
Deal Details:
Expedia announced acquisition of Tiqets, an Amsterdam-based activities/experiences platform (Skift coverage):
- Closing: Q1 2026 (before this option expires)
- Strategic Rationale: Expands into high-growth experiences segment across 60+ countries, 1,000+ cities
- B2B Integration: Strengthens Activities API for 60,000+ B2B partners (PhocusWire analysis)
Revenue Synergies: Activities/experiences represents one of the fastest-growing travel categories. Integration with B2B platform could accelerate cross-selling to existing partners.
📊 COMPETITIVE HEADWINDS: Market Share Losses
Vrbo Struggles:
Short-term rental market share trends show structural weakness (Skift rental data):
| Platform | 2019 Share | 2024 Share | Change |
|---|---|---|---|
| Airbnb | 28% | 44% | +16 pts |
| Booking.com | 14% | 18% | +4 pts |
| Vrbo (EXPE) | 11% | 9% | -2 pts |
Analysis: While B2B thrives, consumer-facing vacation rental platform is losing ground to both Airbnb and Booking Holdings—a key growth vertical showing structural weakness.
Valuation Gap Dynamics: EXPE still trades at significant discount to Booking Holdings (~40% on EV/EBITDA) per Seeking Alpha analysis. After the 55% rally, much of the "value gap" has been arbitraged, reducing margin of safety for further multiple expansion.
🌍 DEMAND CATALYST: 2026 North American Soccer Tournament
Major Event Catalyst:
According to Expedia's travel trends report:
- Tournament Dates: June 11 to July 19, 2026
- Search Activity: 125% surge in searches for travel to U.S., Canada, and Mexico
- Booking Window: Early activity already observed
Trade Implication: This catalyst occurs well after January 23 expiration, so irrelevant to option positioning but positive for long-term stock holders.
🎯 Price Targets & Probabilities
Analyst Consensus
Street Targets:
- Average Price Target: $267.68 (TipRanks)
- Implied Movement: -6.5% from current $286.21
- Range: $210 (bear case) to $350 (Evercore ISI bull case)
- Rating: 10 Buy, 19 Hold, 0 Sell (Moderate Buy)
Recent Changes:
- Evercore ISI: Raised target to $350 (highest on Street) - 22% upside
- Bank of America: $285 → $326 (December 19)
- Wedbush: $250 → $290 (December 19)
- B. Riley: $260 → $300 (November 7)
Key Observation: Median analyst target is below current price after the post-earnings rally, suggesting limited conviction in further near-term upside. This supports the covered call thesis.
Technical Price Targets (Based on Implied Move)
Bullish Scenario (25-30% probability):
- Near-Term Target: $295-300 (technical breakout above ATH)
- Catalyst Path: Sector momentum from Booking/Airbnb beats, M&A speculation, AI breakthrough
- Resistance: $292.42 (ATH), $300 (psychological)
Base Scenario (45-50% probability):
- Range: $280-290 (consolidation near highs)
- January OPEX: Gamma pin effects minimal given low options activity
- Catalyst Path: Holiday travel data in-line, await earnings clarity
Bearish Scenario (20-25% probability):
- Downside Target: $260-275 (prior consolidation zone)
- Support Levels: $282 (weekly lower bound), $275 (monthly lower bound), $260 (post-Q3 base)
- Catalyst Path: Competitive losses, guidance concerns, macro deterioration
January 23, 2026 Probabilities (Options-Implied)
Using implied volatility and delta approximations:
| Price Level | Probability | Outcome for Covered Call |
|---|---|---|
| Above $300 | ~10% | Opportunity cost (assigned at $200) |
| $286-$300 | ~25% | Optimal (keeps shares + premium) |
| $274-$286 | ~40% | Ideal (full premium retained) |
| $250-$274 | ~20% | Excellent (premium cushions decline) |
| Below $250 | ~5% | Premium protection eroding |
Covered Call Breakeven ($199.81): Less than 1% probability of reaching by expiration based on current IV—extremely low tail risk.
💡 Trading Ideas
🛡️ CONSERVATIVE: For EXPE Stock Holders
Replicate with OTM Covered Calls (January 23, 2026 expiration)
- Sell: 1x $290 call @ ~$8-10
- Net Credit: $800-1,000 per contract
- Max Profit: Premium collected + $3.79 stock appreciation to $290
- Downside Protection: Reduces cost basis by ~3%
- Upside Retained: Allows 1.3% appreciation before assignment
Why This Works:
- Elevated IV: Premium collection attractive at near-ATH levels
- Limited Catalysts: No major events before expiration (earnings Feb 5)
- Risk Management: Caps gains but provides income cushion for consolidation
- Earnings Avoidance: Expires before February 5 event risk
Ideal For: Income-focused investors willing to cap gains at $290 in exchange for 2-3% premium over 25 days.
⚖️ BALANCED: For Bearish-Leaning Traders
Bear Put Spread (January 23, 2026)
- Buy: 1x $285 put @ ~$12
- Sell: 1x $265 put @ ~$5
- Net Debit: $7 ($700 per spread)
- Max Profit: $13 ($1,300 per spread) if EXPE < $265 at expiration
- Max Loss: $700 (debit paid)
- Breakeven: $278
- Return on Risk: 186% if max profit achieved
Why This Works:
- Defined Risk: Capped downside unlike short stock
- Realistic Profit Zone: Only needs 4-7% decline to profit
- Valuation Support: Analyst consensus at $267.68 within profit range
- No Margin Requirement: Can trade in IRA/cash accounts
Ideal For: Traders who believe the 55% YTD rally is overextended and expect mean reversion toward $270-275 support.
🔥 AGGRESSIVE: High Conviction Bearish
Put Ratio Spread (January 23, 2026)
- Sell: 2x $280 puts @ $10 each
- Buy: 1x $290 put @ $14
- Net Credit: $6 ($600 per spread)
- Max Profit: $4 ($400) if EXPE = $280 at expiration
- Max Loss: Below $270 (defined but substantial)
- Profit Range: $274 - $286
- Breakeven: $286 (near current price)
Why This Works:
- Premium Collection: Net credit structure profits from time decay
- Consolidation Bet: Profits if EXPE stays in $274-286 range
- IV Crush Benefit: Short vega benefits from post-OPEX IV decline
- Flexibility: Can manage at monthly OPEX (Jan 16) if threatened
Ideal For: Experienced traders comfortable managing multi-leg spreads who expect EXPE to consolidate rather than crash.
📉 CONTRARIAN: Fade the Bearish Flow
Bull Call Spread (January 23, 2026)
- Buy: 1x $285 call @ $10
- Sell: 1x $300 call @ $4
- Net Debit: $6 ($600 per spread)
- Max Profit: $9 ($900 per spread) if EXPE ≥ $300 at expiration
- Max Loss: $600 (debit paid)
- Breakeven: $291
- Return on Risk: 150% if max profit achieved
Contrarian Thesis: If the large institutional call sale is simply profit-taking (not bearish conviction), and fundamentals remain strong, EXPE could break out above $292 ATH on:
- Sector momentum (Booking/Airbnb earnings beats)
- Positive holiday travel data
- M&A speculation (EXPE as potential acquisition target)
- Technical breakout triggering momentum buying
Ideal For: Traders who disagree with the defensive positioning and believe the B2B growth story justifies higher multiples.
⚠️ Risk Factors
🌍 Competitive & Market Share Risks
Vrbo Structural Decline: Market share erosion in short-term rentals represents a fundamental weakness (Skift data). Vrbo's decline from 11% to 9% share while Airbnb surged from 28% to 44% suggests brand preference challenges that revenue growth alone may not overcome.
Booking Holdings Outperformance: Despite Expedia's strong Q3, Booking Holdings maintains higher margins and faster growth in key segments. The valuation discount may be justified by execution gaps rather than mispricing.
Google Direct Booking: Google's expansion of travel offerings poses disintermediation risk, particularly for price-sensitive consumers who prefer direct supplier relationships.
🤖 AI Disruption Threat
Existential Technology Risk:
CEO Gorin's acknowledgment that AI would be "very disruptive" without adaptation (Fortune interview) highlights the risk that emerging AI tools enable travelers to bypass OTAs entirely.
Investment vs. Returns Uncertainty: Heavy AI partnership investments (OpenAI, Microsoft) are defensive moves, but ROI remains uncertain. If consumers adopt AI booking agents that commoditize OTA brands, margins could compress permanently.
📉 Valuation & Momentum Risks
Mean Reversion After 55% Rally: Technical exhaustion signals:
- Trading within 2% of all-time highs
- No meaningful pullback (>10%) since June consolidation
- RSI likely elevated (70+) suggesting overbought conditions
- Forward P/E of 14.98x approaching full value for single-digit revenue growth
Analyst Skepticism: Median price target below current price post-rally suggests Street consensus views $286 as fair-to-rich, not a launching pad for further appreciation.
📊 Execution & Operational Risks
One Key Program Challenges: May 2025 modifications excluding Blue tier members from Vrbo rewards (Skift coverage) risk customer frustration. Balancing cost control with loyalty engagement remains delicate.
Tiqets Integration Risk: M&A execution is never guaranteed. Integration challenges, cultural misalignment, or customer retention issues could dilute expected synergies.
U.S. Demand Fragility: Q1 2025's revenue miss triggered an 8% decline, demonstrating sensitivity to softness. If lower-income travelers continue delaying trips, revenue growth could disappoint despite strong B2B performance.
📆 Theta Decay & Volatility Dynamics
Minimal Time Value: With only $0.19 of time premium, theta decay is negligible (~$0.01/day). This trade is overwhelmingly a delta play, not a volatility or time decay bet.
IV Crush Post-OPEX: January 16 monthly OPEX will likely see IV decline, benefiting the short call seller (vega-negative position). However, with minimal extrinsic value, the impact is marginal.
🎯 Bottom Line
What This Trade Signals: This $44M covered call position represents sophisticated profit-taking and risk management after EXPE's exceptional 55% YTD rally. The deep ITM strike ($200 vs. $286 spot) with minimal time value ($0.19) is the hallmark of institutional portfolio management—not speculative bearishness.
Most Likely Strategy (85% confidence): Covered call by a large holder (hedge fund, pension, index fund) owning 510,000 shares. They're collecting $44M in premium to reduce cost basis to $199.81, providing 30% downside protection while willing to exit at $200 if assigned.
The Bull Case: If EXPE consolidates in the $280-290 range through January 23, the covered call holder achieves optimal outcome: retains shares, keeps full premium, can re-establish calls at higher strikes. Strong B2B momentum (17 consecutive quarters of double-digit growth), Tiqets acquisition, and 2026 soccer tournament demand support long-term bullish view.
The Bear Case: If EXPE breaks down below $275 support on competitive losses, AI disruption fears, or macro deterioration, the premium provides cushion down to $199.81 (30% decline). Vrbo market share losses, analyst targets below current price, and technical exhaustion after the vertical rally suggest limited near-term upside.
Retail Takeaway: You don't need $146M to express a similar view. The $290 covered call generates 3% income with minimal risk for stock holders. The $285/$265 bear put spread offers 186% ROI for $700 risk if you're bearish. The put ratio spread collects premium and profits from consolidation.
Final Verdict: This trade is not a bearish capitulation—it's prudent profit-taking after an extraordinary run. The smart money isn't betting on a crash, but they're not betting on continued euphoria either. With no catalysts before expiration (earnings Feb 5 is post-expiry) and analyst consensus below current price, the path of least resistance is consolidation in the $280-290 range—exactly where covered calls and short premium strategies thrive.
The 25-day window to January 23 expiration avoids earnings volatility while capturing any mean reversion or profit-taking pressure. Whether this signals the end of EXPE's bull run or just a healthy pause, the message is clear: institutions are de-risking at current levels, and retail traders should consider the same.
Risk Disclosure: Options trading involves substantial risk and is not suitable for all investors. The strategies outlined above can result in total loss of invested capital. This analysis is for informational purposes only and does not constitute investment advice. Past performance of similar trades is not indicative of future results. Always conduct your own due diligence and consult with a licensed financial advisor before trading options.
🔗 Additional Resources
Option Analysis: Chart Analysis - $200 Strike, Jan 2026 Expiry
Full Stock Analysis: EXPE Deep Dive
Data Sources:
- Trade Data: Proprietary options flow scanner
- Gamma Exposure: Real-time GEX aggregation from OPRA feed
- Implied Volatility: Options chain data from exchange APIs
- Catalyst Research: EXPE_catalysts.md with inline source citations
- Technical Data: Yahoo Finance, Stock Analysis
- Analyst Data: TipRanks, MarketBeat, Stock Analysis consensus
Analysis completed: December 29, 2025 | EXPE Spot: $286.21 | Market Cap: $35.24B