FCX $1.9M Bearish Put Bet - Smart Money Buys Downside Protection Ahead of Grasberg Restart Uncertainty!
January 7, 2026 | Unusual Activity Detected
The Quick Take
Someone just dropped $1.9 MILLION on FCX puts at 10:13:55! This institutional trade bought 15,500 contracts of the $50 strike put expiring February 20th - betting on downside protection just 21 days before Q4 earnings on January 28th and 5 days before the January 12th securities class action lead plaintiff deadline. With FCX trading at $54.26 near 52-week highs ($57.12) despite the Grasberg Block Cave disaster slashing 35% of Indonesian copper production, smart money is buying insurance against execution risk. Translation: Institutions are protecting against a potential pullback to $50 as Grasberg restart timelines remain uncertain!
Company Overview
Freeport-McMoRan (FCX) is the world's largest publicly traded copper producer:
- Market Cap: ~$79.16 billion
- Industry: Copper and Gold Mining
- Current Price: $54.26 (near 52-week high of $57.12)
- Primary Business: Copper mining with operations in Americas (Morenci, Cerro Verde) and Indonesia (Grasberg - world's 2nd largest copper mine)
- P/E Ratio: 38.25x
The Option Flow Breakdown
The Tape (January 7, 2026 @ 10:13:55):
| Time | Symbol | Side | Buy/Sell | Type | Expiration | Premium | Strike | Volume | OI | Size | Spot | Option Price |
|---|---|---|---|---|---|---|---|---|---|---|---|---|
| 10:13:55 | FCX | ASK | BUY | PUT $50 | 2026-02-20 | $1.9M | $50 | 16K | 3.6K | 15,500 | $54.26 | $1.24 |
What This Actually Means
This is a BEARISH directional hedge protecting against downside into critical catalysts! Here's what went down:
- Huge premium paid: $1.9M ($1.24 per contract x 15,500 contracts)
- Protection strike: $50 provides 7.9% downside cushion below current price
- Strategic timing: 44 days to expiration captures Q4 earnings (Jan 28), lead plaintiff deadline (Jan 12), and initial Grasberg restart uncertainty
- Size matters: 15,500 contracts represents 1.55 million shares worth ~$84M notional exposure
- Volume vs OI: Volume of 16,000 is 4.4x the open interest of 3,600 - this is a NEW position, not rolling!
What's really happening here:
This trader is positioning for potential downside into a trifecta of risk events. According to FCX's October 2025 investor update, the Grasberg Block Cave phased restart isn't expected until Q2 2026 - well after this put expires. If the January 28th earnings report delivers disappointing 2026 guidance or reveals restart delays, the $50 strike could come into play quickly. The securities class action with January 12th deadline adds headline risk right before earnings.
Unusual Score: ELEVATED - Volume at 4.4x open interest signals strong conviction. This isn't typical hedging - it's a directional bet on downside.
Technical Setup / Chart Check-Up
YTD Performance Chart
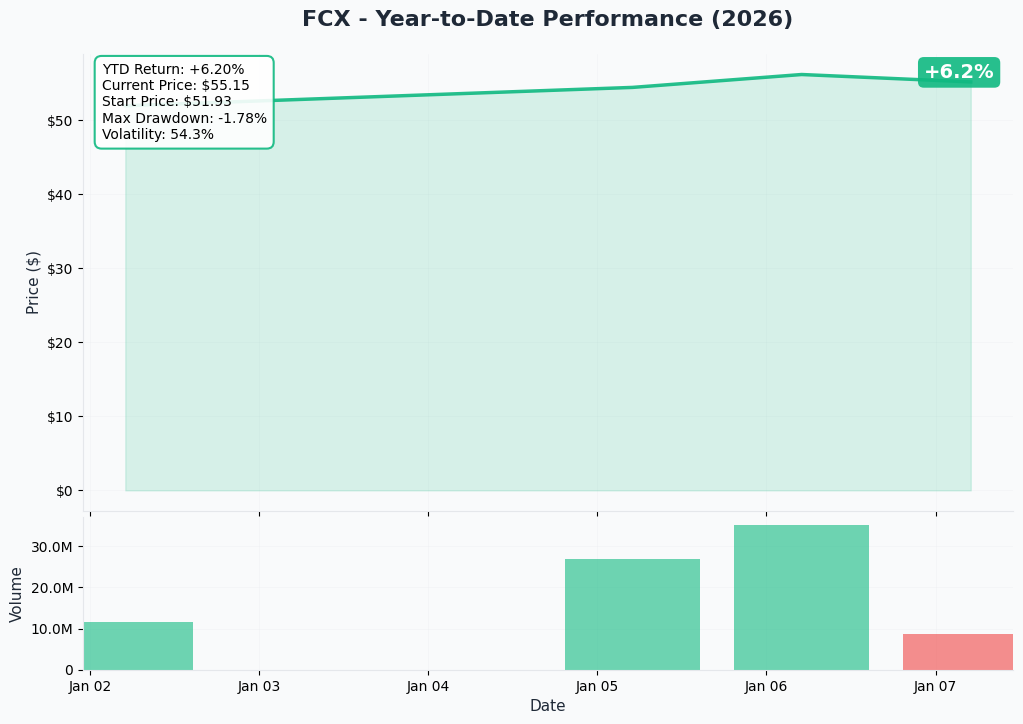
FCX has had a volatile year - currently trading at $54.26 after hitting a fresh 52-week high of $57.12 on January 6th. The chart tells a tale of two halves:
Key observations:
- September 2025 Crash: Stock fell 20.4% in a single day following the Grasberg mud rush disaster, dropping from $46.66 to $43.89 according to Yahoo Finance
- Recovery Rally: Strong rebound from September lows (~$38) to current $54+ levels (+42% from bottom)
- 52-Week Range: $27.66 - $57.12 - currently trading near the top of the range
- Recent Momentum: +8.54% over the last 2 weeks per StockInvest.us
- Volume Spike: 33.3M shares traded January 6th - 39% above average according to Benzinga
Gamma-Based Support & Resistance Analysis
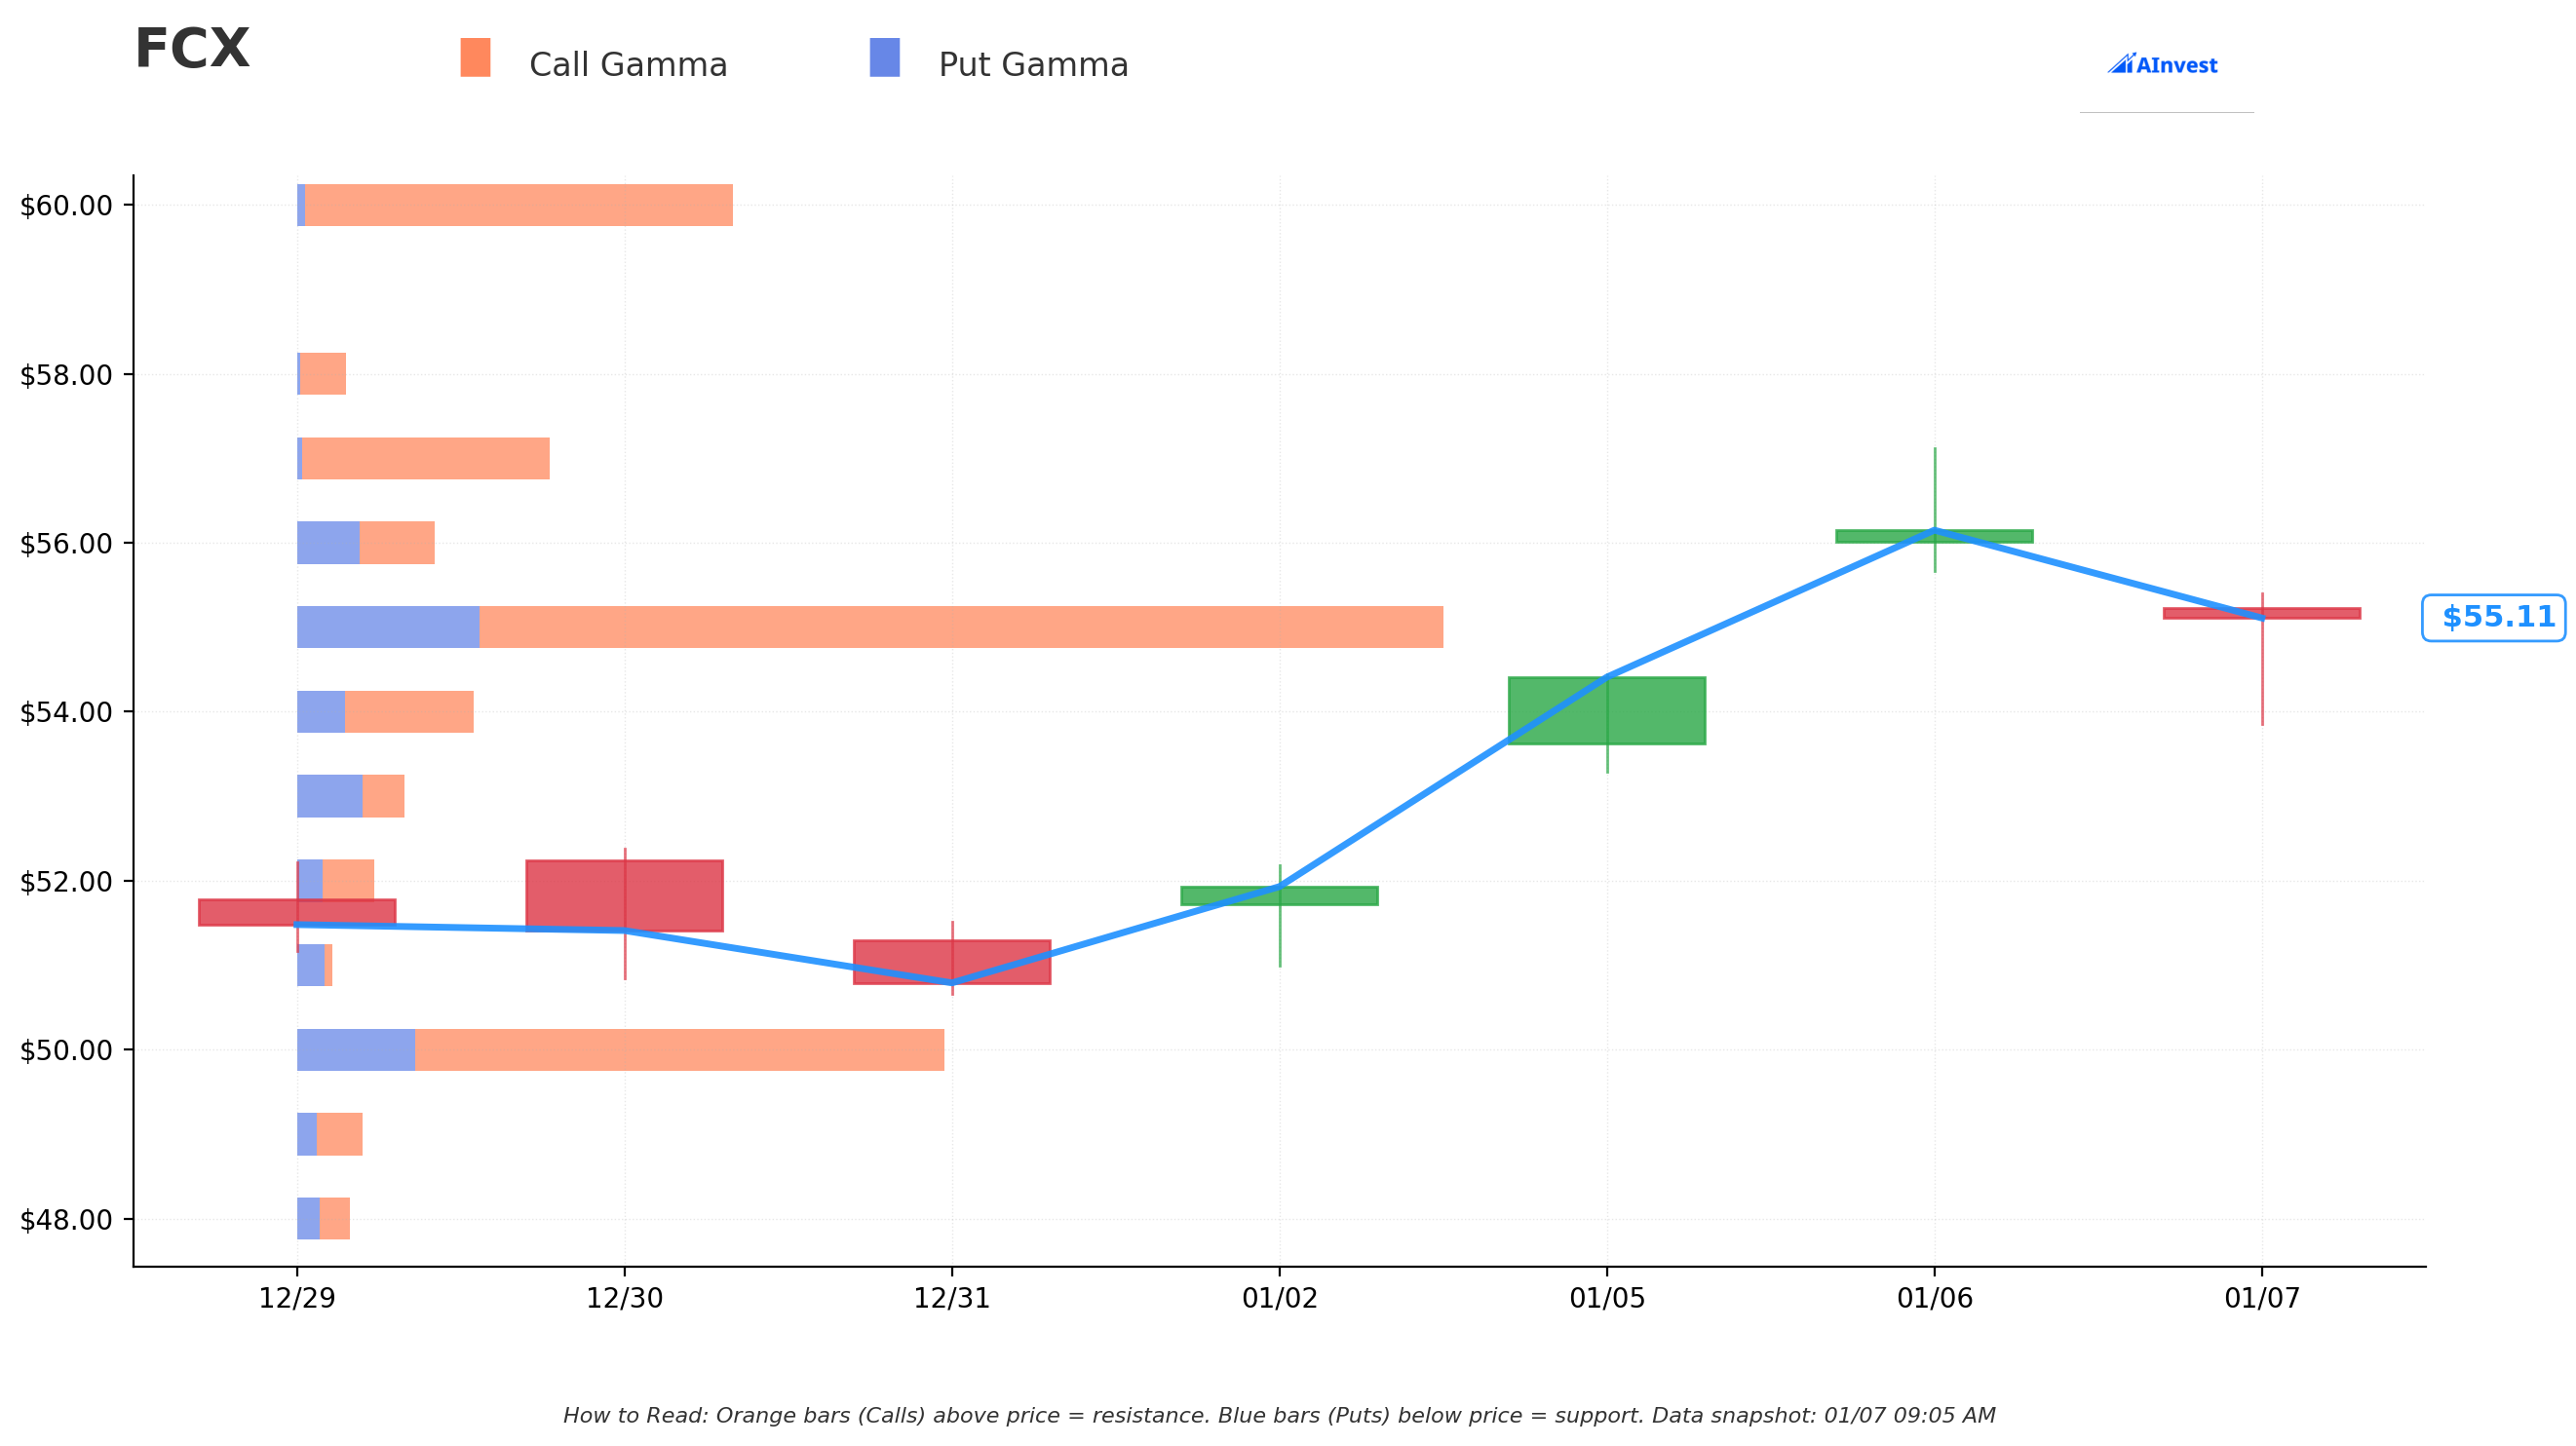
Current Price: $54.26
The gamma exposure map reveals critical price levels that will govern near-term price action:
Support Levels (Put Gamma Below Price):
- $54 - Immediate support (nearby gamma floor)
- $52.50 - Secondary support level with solid put gamma
- $50 - MAJOR support and THIS PUT'S STRIKE - psychological level aligning with September 2025 post-disaster trading range
Resistance Levels (Call Gamma Above Price):
- $55 - Immediate ceiling (dealers will sell into rallies)
- $57.50 - Secondary resistance near 52-week highs
- $60 - Extended upside target (significant overhead resistance)
What this means for traders:
FCX is trading in a range between $54 support and $57.50 resistance. The put buyer struck EXACTLY at $50 - the major gamma support level that also represents psychological support from the September-October 2025 trading range. If FCX breaks below $54, the next stop is $52.50, then $50. The gamma data suggests $50 is THE LINE IN THE SAND for this stock.
Implied Move Analysis
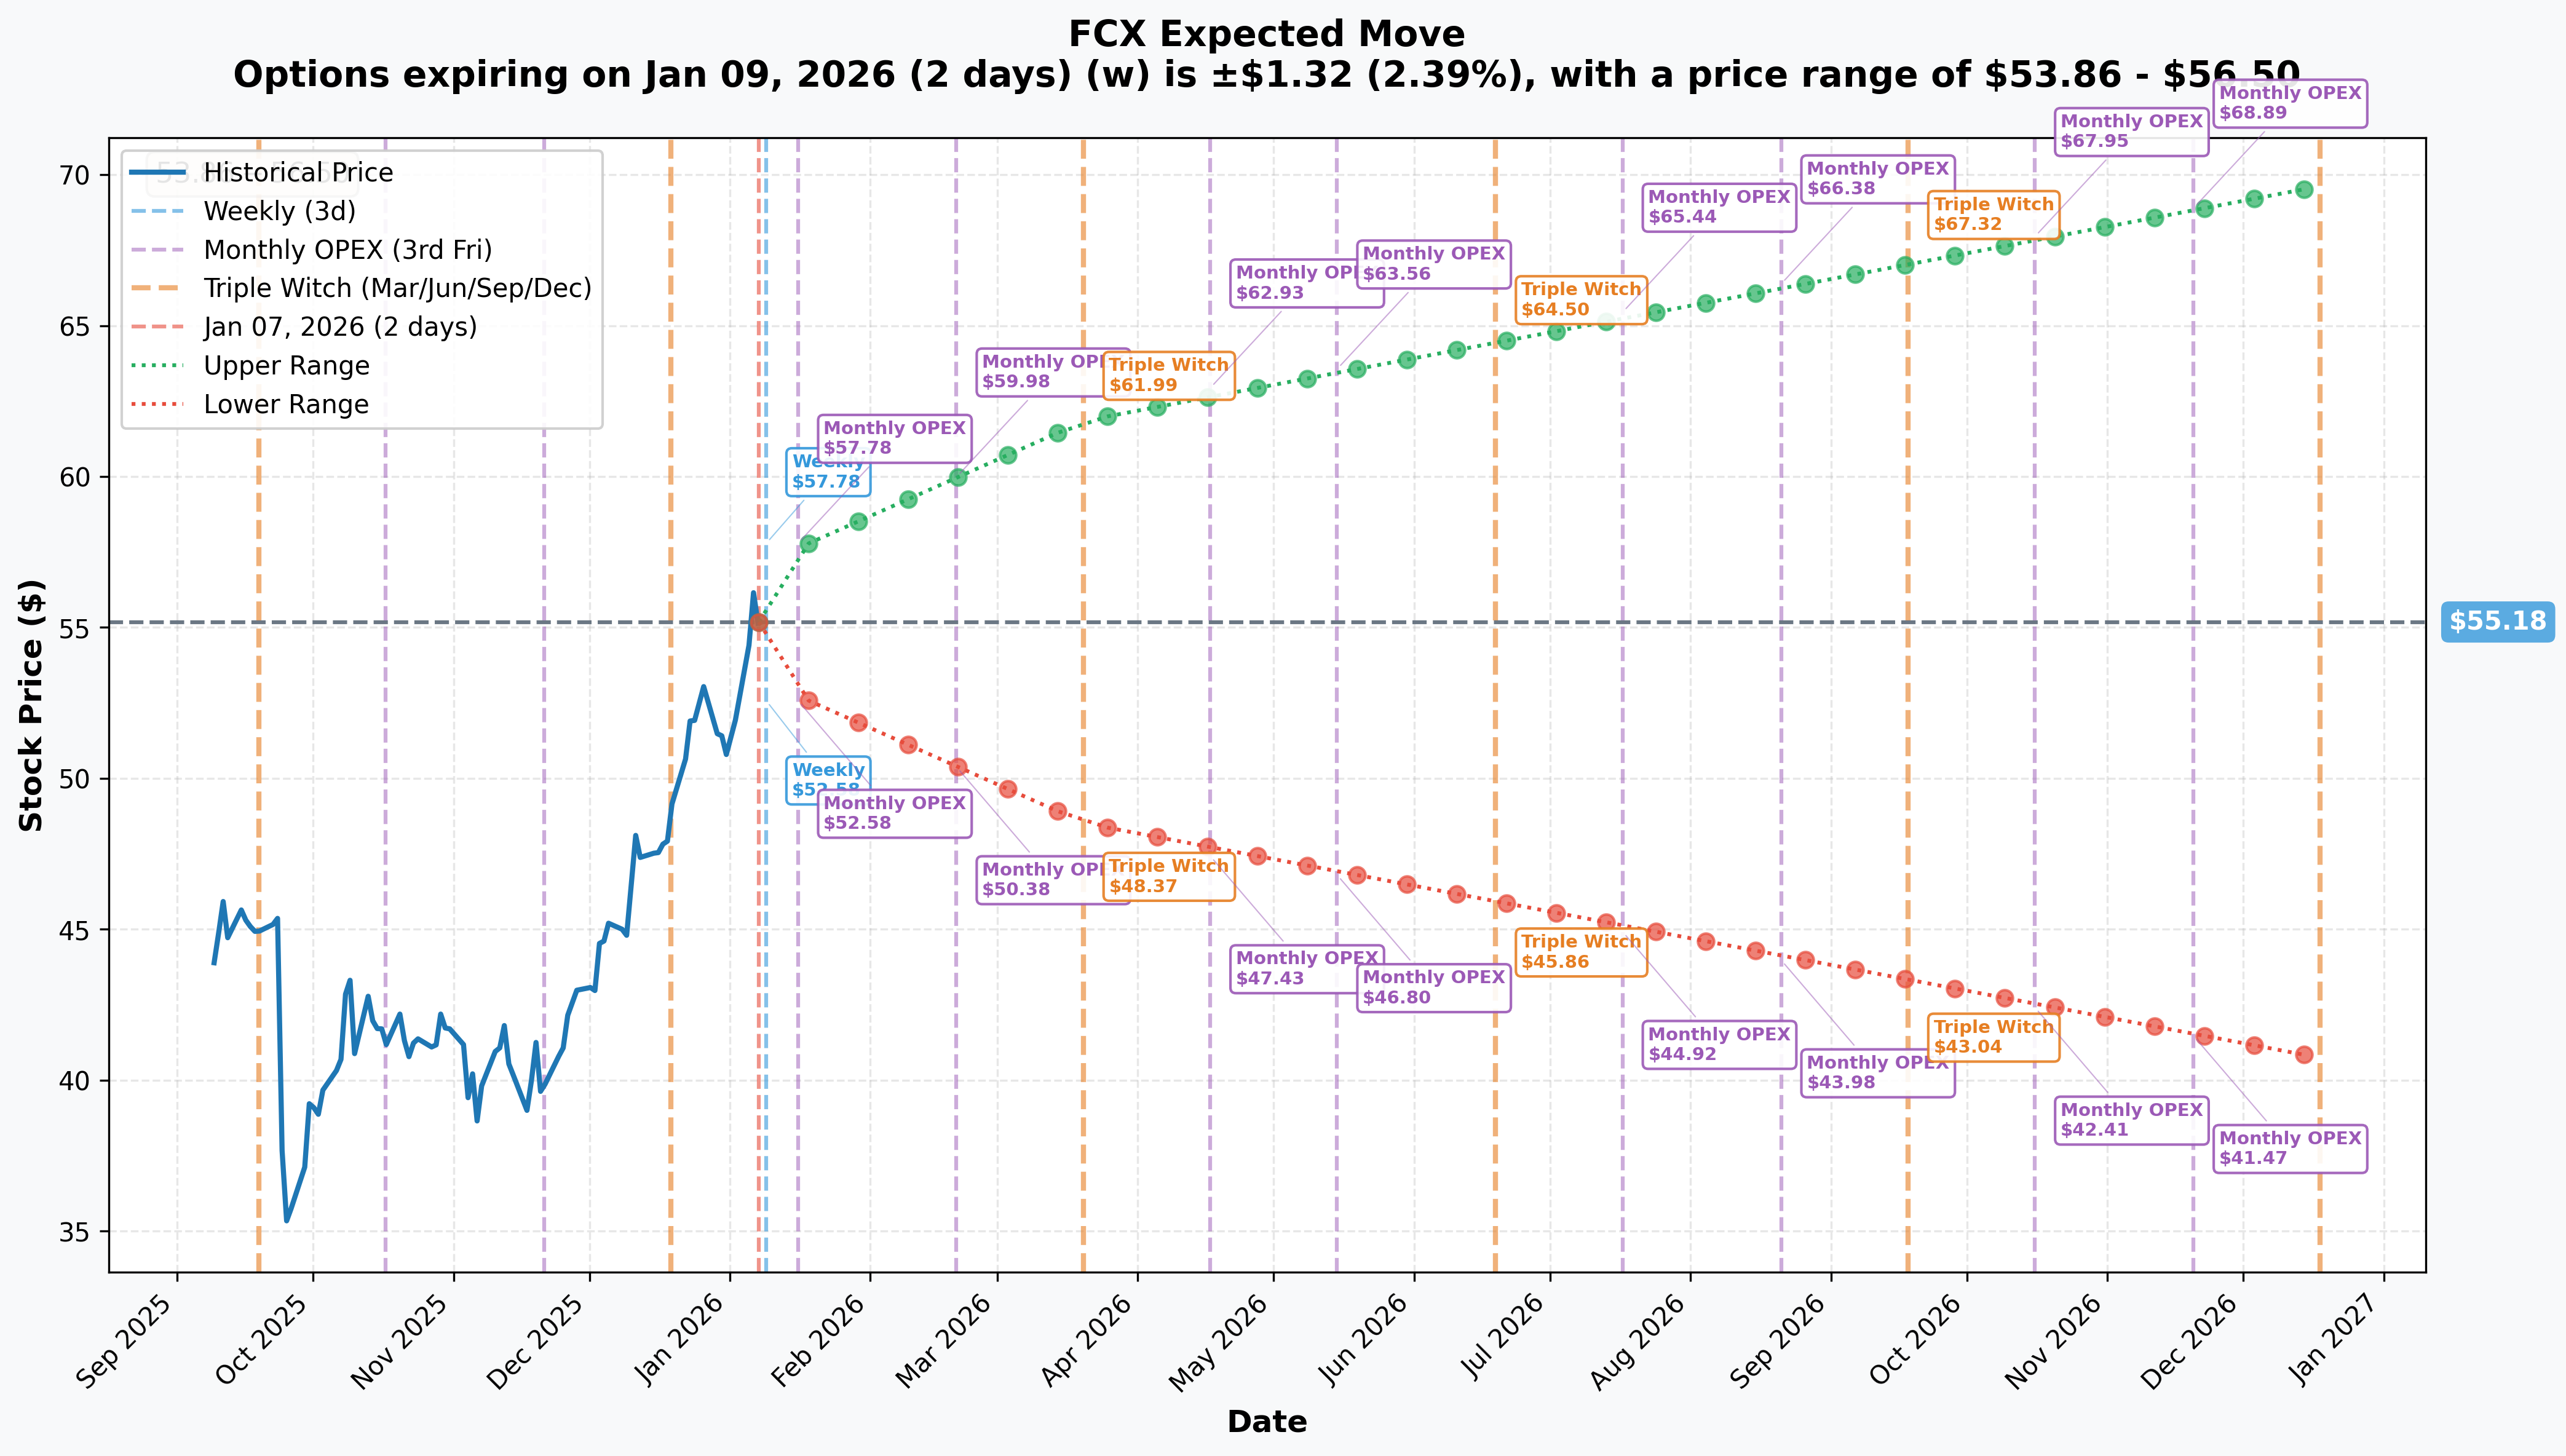
Options market pricing for upcoming expirations:
- Weekly (Jan 9 - 2 days): +/- $1.32 (+/-2.39%) -> Range: $53.86 - $56.50
- Monthly OPEX (Jan 16 - 9 days): +/- $2.47 (+/-4.47%) -> Range: $52.71 - $57.65
- February OPEX (Feb 20 - THIS TRADE!): +/- ~$4.80 (+/-8.7%) -> Range: $50.38 - $59.98
- Quarterly Triple Witch (Mar 20 - 72 days): +/- $6.67 (+/-12.09%) -> Range: $48.51 - $61.85
Translation for regular folks:
Options traders are pricing in a 4.5% move ($2.47) through January monthly OPEX which captures the January 28th earnings report. For the February 20th expiration when this $1.9M trade expires, the implied move range extends to $50.38 - $59.98 - notice how the lower bound sits RIGHT at the $50 strike! The market sees $50 as a realistic downside scenario by mid-February.
Key insight: The put buyer is paying $1.24 for $50 strike puts - a 7.9% out-of-the-money bet. Given the implied move lower bound of $50.38, this trade is positioned just inside the expected range. Smart positioning for a bearish thesis without paying up for at-the-money premium.
Catalysts
Immediate Catalysts (Next 30 Days)
Securities Class Action Lead Plaintiff Deadline - January 12, 2026 (5 DAYS AWAY!)
According to Rosen Law Firm's press release:
- Class period covers February 15, 2022 - September 24, 2025
- Allegations: FCX failed to adequately ensure safety at Grasberg Block Cave mine
- Multiple law firms involved including Levi & Korsinsky, Gross Law Firm, and Kirby McInerney per Globe Newswire
Why it matters: Lead plaintiff deadline establishes class parameters and generates headlines. While mining class actions rarely result in material settlements, this creates headline risk right before earnings.
Q4 2025 Earnings Report - January 28, 2026 (21 DAYS AWAY!)
Per Nasdaq earnings calendar and MarketBeat:
- Date: January 28, 2026 (Before Market Open)
- Revenue Consensus: $5.16B (DOWN from Q3's $6.97B due to Grasberg shutdown)
- Context: This is the FIRST full quarter reflecting Grasberg shutdown impact
Key items to watch:
- Grasberg restart timeline and cost estimates
- 2026 production guidance specifics (currently expected ~35% lower than pre-incident)
- Americas operations performance (Morenci, Cerro Verde momentum)
- Indonesian smelter utilization and export tax elimination
Ex-Dividend Date - January 15, 2026
According to FCX investor relations:
- Amount: $0.15/share ($0.075 base + $0.075 variable)
- Payment Date: February 2, 2026
- Annual Yield: 1.18%
Near-Term Catalysts (Q1-Q2 2026)
Grasberg Block Cave Phased Restart - Q2 2026
Per FCX's November 2025 investor update:
- Remediation activities ongoing through Q1 2026
- Phased restart expected to begin mid-2026
- 2026 Indonesian copper production guidance: ~1.0B lbs (down from ~1.5B pre-incident = -35%)
- Return to pre-incident rates potentially achievable in 2027
Why this matters for the put: The February 20th expiration occurs BEFORE any meaningful Grasberg restart. If January 28th earnings reveals further delays or cost overruns, the stock could pull back toward $50 quickly.
Past Catalysts (Already Happened)
Grasberg Block Cave Disaster - September 8, 2025
According to FCX's September investor update and Argus Media:
- 800,000 tonnes of wet material entered Grasberg Block Cave
- Two workers confirmed fatally injured
- PT Freeport Indonesia declared force majeure on all commercial contracts
- Stock fell 20.4% immediately following the incident
Q3 2025 Earnings Beat - October 23, 2025
Per Investing.com earnings analysis and Zacks:
- EPS: $0.50 vs $0.41 consensus (+21.95% beat)
- Revenue: $6.97B vs $6.70B consensus (+4.03% beat)
- Higher copper prices ($4.68/lb vs $4.30 YoY) offset production declines
- Americas operations outperformed: Morenci doubled to $396M, Cerro Verde +28%
U.S. Copper Tariffs - July 30, 2025
According to White House announcement and CNBC/Morgan Stanley analysis:
- 50% tariff on semi-finished copper products (effective August 1, 2025)
- FCX is dominant U.S. producer (~70% of 1.1M MT annual U.S. output)
- Morgan Stanley predicts FCX can raise copper rod pricing 40% from Q1 2026 to Q4 2028
Price Targets & Probabilities
Using gamma levels, implied move data, and upcoming catalysts, here are the scenarios through February 20th expiration:
Bull Case (25% probability)
Target: $58-$62
How we get there:
- Q4 earnings surprise to upside with strong Americas performance offsetting Grasberg
- 2026 guidance better than feared (Grasberg restart timeline accelerated to early Q2)
- Copper prices remain elevated at $12,000+/ton per J.P. Morgan's Q2 2026 forecast
- Securities class action dismissed or deemed immaterial
- Break above $57.50 gamma resistance triggers technical rally to $60+
Key metrics needed:
- Revenue guidance above $22B for 2026
- Grasberg restart begins Q1 2026 (ahead of current Q2 timeline)
- Copper prices maintain above $11,000/ton
Probability assessment: Only 25% because Grasberg restart realistically won't begin until Q2 2026 at earliest, limiting positive surprise potential. Stock already trading near 52-week highs prices in significant optimism.
Base Case (50% probability)
Target: $52-$56 range (CONSOLIDATION)
Most likely scenario:
- Q4 earnings meet low expectations ($5.16B revenue)
- 2026 guidance confirms ~35% lower Indonesian production vs pre-incident
- Copper prices remain supportive but don't spike ($10,500-$11,500/ton range per Goldman Sachs forecast)
- Securities class action generates headlines but no material impact
- Stock trades within implied move range, consolidating gains
- Volatility crush post-earnings
This is the put buyer's WORST scenario: Stock stays elevated, puts expire worthless or with minimal value, $1.9M insurance premium lost. BUT they protected against tail risk through uncertain catalyst period.
Why 50% probability: Stock at technical inflection point with mixed signals - strong Q3 beat but operational uncertainty, elevated valuation (38x P/E) but tariff tailwinds. Most likely outcome is sideways chop.
Bear Case (25% probability)
Target: $48-$50 (PUT STRIKE IN PLAY!)
What could go wrong:
- Q4 earnings disappoint on weaker Americas performance or higher costs
- 2026 guidance worse than expected (Grasberg restart pushed to H2 2026)
- China copper demand weakness continues (-8% YoY in Q4 2025 per Goldman)
- Securities class action gains traction with strong lead plaintiff
- Copper prices correct toward Goldman's $10,000/ton target
- Break below $54 triggers cascade to $52.50, then $50
Critical support levels:
- $54: Immediate gamma floor - first line of defense
- $52.50: Secondary support - must hold or momentum shifts bearish
- $50: Major psychological floor + THIS PUT STRIKE - the line in the sand
Probability assessment: 25% because it requires multiple negative catalysts to align. However, the combination of earnings risk, litigation headline risk, and execution uncertainty on Grasberg creates real downside potential.
Put P&L in Bear Case:
- Stock at $50 on Feb 20: Puts worth $0 (at-the-money), loss = -$1.24/share x 15,500 = -$1.9M (100% loss)
- Stock at $48 on Feb 20: Puts worth $2.00, profit = $0.76/share x 15,500 = $1.18M gain (61% ROI)
- Stock at $45 on Feb 20: Puts worth $5.00, profit = $3.76/share x 15,500 = $5.83M gain (307% ROI!)
Trading Ideas
Conservative: Wait for Post-Earnings Clarity
Play: Stay on sidelines until after January 28th earnings settles
Why this works:
- Earnings in 21 days creates binary event risk - too dangerous to enter now
- Securities class action deadline (Jan 12) could generate unexpected headlines
- Stock at 52-week highs with 38x P/E - zero margin of safety at current levels
- Better entry likely post-earnings if stock pulls back to $50-52 support
- The $1.9M institutional put buy signals smart money is WORRIED - why fight the tape?
Action plan:
- Watch January 28th earnings closely for: 2026 production guidance, Grasberg restart timeline, Americas performance
- Look for pullback to $50-52 gamma support post-earnings for stock entry with 5-10% margin of safety
- Monitor unusual options activity - if institutions add MORE puts, stay defensive
Risk level: Minimal (cash position) | Skill level: Beginner-friendly
Balanced: Post-Earnings Put Spread (Defined Risk Bearish)
Play: After earnings, buy put spread if stock rallies but you remain skeptical
Structure: Buy $52.50 puts, Sell $50 puts (March 20 expiration)
Why this works:
- IV crush after earnings makes put spreads cheaper - buy AFTER volatility drops
- Defined risk spread ($2.50 wide = $250 max risk per spread)
- Targets gamma support zone at $50-$52.50 where institutions are positioned
- March expiration gives time for any Grasberg restart delays to materialize
- Copies institutional positioning at better prices post-IV crush
Estimated P&L (adjust after seeing post-earnings IV):
- Pay ~$0.80-$1.00 net debit per spread post-earnings
- Max profit: $150-170 if FCX below $50 at March expiration
- Max loss: $80-100 if FCX above $52.50 (defined and limited)
- Breakeven: ~$51.50-52
Risk level: Moderate (defined risk, bearish directional) | Skill level: Intermediate
Aggressive: Earnings Strangle - Bet on MOVEMENT
Play: Buy strangle betting on post-earnings volatility exceeding implied move
Structure: Buy $57.50 calls + Buy $50 puts (February 20 expiration)
Why this could work:
- Implied move only 8.7% for February but FCX moved 20%+ in September on Grasberg news
- Binary earnings risk with potential 2026 guidance surprise either direction
- If Grasberg timeline improves OR worsens significantly, stock could gap 10%+
- Maximum leverage on volatility expansion
Why this could blow up:
- EXPENSIVE: Strangle costs ~$2.50-3.00 ($250-300 per strangle)
- IV CRUSH: Even if stock moves 6-7%, IV collapse could result in LOSS
- Need big move: Requires ~10%+ move to profit after IV crush
- Stock could consolidate in $52-57 range and you lose entire premium
Risk level: EXTREME (can lose 100% of premium) | Skill level: Advanced only
Risk Factors
Don't get caught by these potential landmines:
-
Grasberg restart execution risk: The Grasberg Block Cave represents 70% of PTFI's forecast copper/gold production through 2029. Any delays beyond Q2 2026 restart timeline materially impacts 2026/2027 earnings. The put buyer is positioning for this exact scenario.
-
Earnings binary event in 21 days: Q4 results January 28th will show FIRST full quarter of Grasberg shutdown impact. Revenue expected down ~26% QoQ to $5.16B. Guidance for 2026 is THE critical item - any negative surprise on production outlook could trigger sharp selloff.
-
Securities litigation headline risk: Multiple law firms competing for lead plaintiff role with January 12th deadline. Class action covering February 2022 - September 2025 alleges material misstatements regarding operational risks. Even if ultimately dismissed, creates negative headlines through 2026.
-
China demand weakness: Chinese demand for refined copper fell -8% YoY in Q4 2025 according to Goldman Sachs. Real estate sector weakness persists. If China stimulus disappoints, copper prices could correct 10-15%.
-
Valuation stretched at 52-week highs: Trading at 38.25x forward P/E at 52-week highs despite 35% production cuts. Average analyst target of $51.05 implies -9% downside from current levels. The put buyer clearly agrees valuation is extended.
-
Copper price correction risk: Goldman Sachs forecasts copper declining to $10,000-$11,000/ton in 2026 from current ~$12,000 levels. Every $0.25/lb decrease in copper = ~$1B less annual operating cash flow for FCX.
The Bottom Line
Real talk: Someone just spent $1.9 MILLION buying downside protection on FCX 21 days before earnings with the stock sitting at 52-week highs. This is a BEARISH directional bet, not portfolio hedging. The put buyer sees:
- Execution Risk: Grasberg restart not until Q2 2026 at earliest - first meaningful production recovery is 4-6 months away
- Earnings Risk: January 28th Q4 results will be ugly ($5.16B revenue vs $6.97B in Q3)
- Litigation Risk: January 12th lead plaintiff deadline could generate negative headlines
- Valuation Risk: 38x P/E at 52-week highs with analysts targeting $51 (9% lower)
The $50 strike is NOT random - it represents:
- Major gamma support level
- Psychological round number
- September-October 2025 post-disaster trading range
- The implied move lower bound for February expiration (~$50.38)
If you own FCX:
- Consider trimming 20-30% at current levels (lock in rally gains from September lows)
- Set mental stop at $52.50 (secondary gamma support) to protect remaining position
- Don't get greedy - stock up 42% from September lows is a GREAT win
If you're watching from sidelines:
- January 28th earnings is the moment of truth - DO NOT enter before
- Post-earnings pullback to $50-52 would be EXCELLENT entry (at analyst targets with gamma support)
- Looking for confirmation of: Grasberg restart on track for Q2, Americas operations momentum, copper price stability above $10,500
If you're bearish:
- The put buyer agrees with you - institutional money is betting on $50
- Post-earnings put spreads ($52.50/$50 March expiration) offer defined-risk downside play
- Watch for break below $54 - that's the trigger for cascade to $52.50, then $50
Mark your calendar - Key dates:
- January 12 (Sunday) - Securities class action lead plaintiff deadline
- January 15 (Wednesday) - Ex-dividend date ($0.15/share)
- January 16 (Thursday) - Monthly OPEX
- January 28 (Wednesday) - Q4 2025 earnings report (Before Market Open)
- February 2 (Monday) - Dividend payment date
- February 20 (Friday) - Monthly OPEX, expiration of this $1.9M put trade
- Q2 2026 - Grasberg Block Cave phased restart expected
Final verdict: FCX's long-term copper thesis remains intact - structural supply deficit (150-400K MT in 2026 per J.P. Morgan and BMI), U.S. tariff tailwinds (40% pricing power increase per Morgan Stanley), and eventual Grasberg recovery. BUT at 38x P/E near 52-week highs with Grasberg restart 4-6 months away and earnings risk imminent, the risk/reward is UNFAVORABLE for aggressive new positioning.
The $1.9M institutional put buy at $50 is a CLEAR signal: smart money sees downside risk to the strike through February. Don't fight the tape.
Be patient. Let earnings clear. Look for better entry at $50-52. The copper supercycle will still be here in 2-3 months, and you'll sleep better paying $51 instead of $54.
Disclaimer: Options trading involves substantial risk of loss and is not suitable for all investors. This analysis is for educational purposes only and not financial advice. Past performance doesn't guarantee future results. The volume-to-OI ratio of 4.4x reflects this specific trade's unusual nature - it does not imply the trade will be profitable or that you should follow it. Always do your own research and consider consulting a licensed financial advisor before trading. Earnings create binary event risk with potential for 10-15% gaps either direction.
About Freeport-McMoRan: Freeport-McMoRan is the world's largest publicly traded copper producer, operating major mines including Grasberg in Indonesia (world's 2nd largest copper mine) and Morenci in Arizona. The company has a market cap of ~$79.16 billion in the Copper and Gold Mining industry.