🌊 FUTU Mixed Signals Tsunami - $5.5M Institutional Chess Match! 💰
📅 October 2, 2025 | 🔥 Unusual Activity Detected
🎯 The Quick Take
Someone just executed $5.5M in mixed option trades on FUTU at 13:24:23 today! Big money bought $4.4M worth of November calls while simultaneously selling $1.1M in puts at the same $150 strike. With FUTU trading at $167, this is a sophisticated bullish play betting on continued strength through their crypto expansion and international growth story. Translation: Institutional money is positioning for upside with downside protection!
📊 Company Overview
Futu Holdings Limited (FUTU) is a leading technology-driven digital brokerage and wealth management platform with:
- Market Cap: $24.6 Billion
- Industry: Digital Brokerage & Wealth Management
- Primary Business: Online investing services through Futubull and moomoo platforms
- Key Markets: Hong Kong, Singapore, Malaysia, Japan, Australia, and expanding in the U.S.
💰 The Option Flow Breakdown
📊 The Tape (October 2, 2025 @ 13:24:23)
| Time | Symbol | Buy/Sell | Call/Put | Expiration | Premium | Strike | Volume | OI | Size | Spot Price | Option Price |
|---|---|---|---|---|---|---|---|---|---|---|---|
| 13:24:23 | FUTU | BUY | CALL | 2025-11-21 | $4.4M | $150 | 1,750 | 283 | 1,750 | $167.10 | $24.95 |
| 13:24:23 | FUTU | SELL | PUT | 2025-11-21 | $1.1M | $150 | 1,750 | 501 | 1,750 | $167.10 | $6.05 |
🤓 What This Actually Means
This is a synthetic long position with income generation - a sophisticated institutional play! The trader:
- Bought deep ITM calls ($150 strike vs $167 spot) for bullish exposure
- Sold puts at same strike to collect premium and reduce net cost
- Net debit: $18.90 per contract = $3.3M total outlay
- Breakeven: $168.90 (just 1% above current price)
- Maximum loss: Limited to net premium paid if FUTU crashes below $150
Real talk: This trader is essentially buying FUTU stock with leverage while collecting $1.1M in put premium to offset the cost!
Unusual Score: EXTREME (1,354x average size) - This happens maybe once a year for FUTU!
📈 Technical Setup / Chart Check-Up
YTD Performance Chart
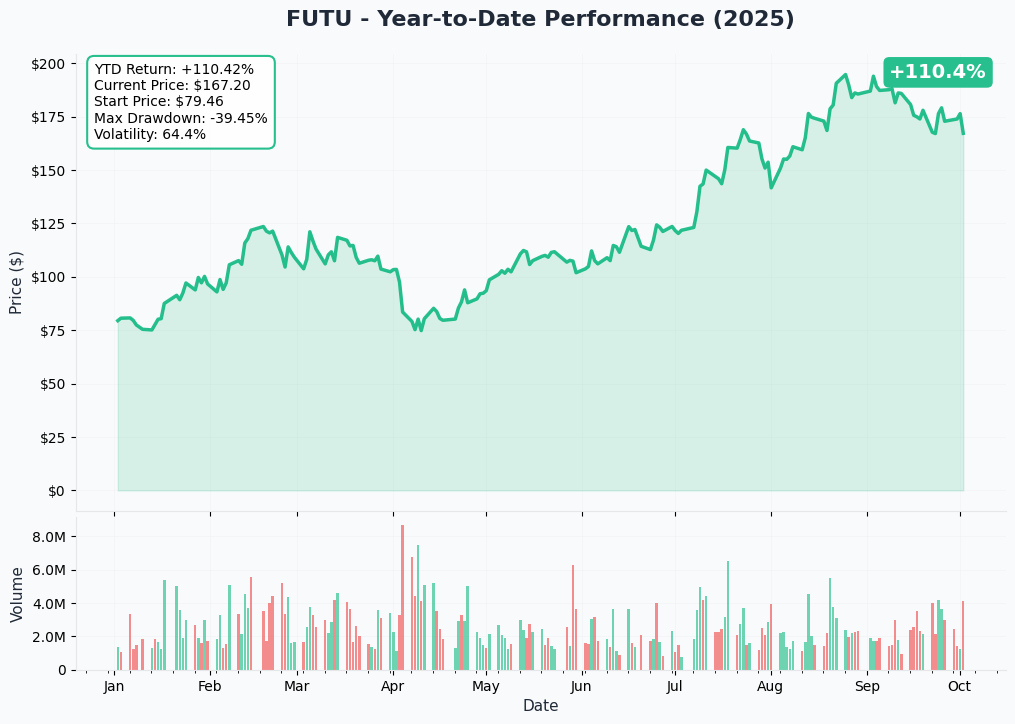
FUTU's having an incredible year! The stock has exploded 221.8% year-over-year, making it one of the hottest fintech plays in the market. After bottoming around $55 in late 2024, FUTU has been on an absolute tear - climbing steadily to current levels around $167.
Key observations:
- Parabolic move: Stock has tripled from 2024 lows
- Strong momentum: Consistent higher highs and higher lows pattern
- Recent consolidation: Trading sideways around $165-170 range
- Volume patterns: Increased institutional accumulation recently
Gamma-Based Support & Resistance Analysis
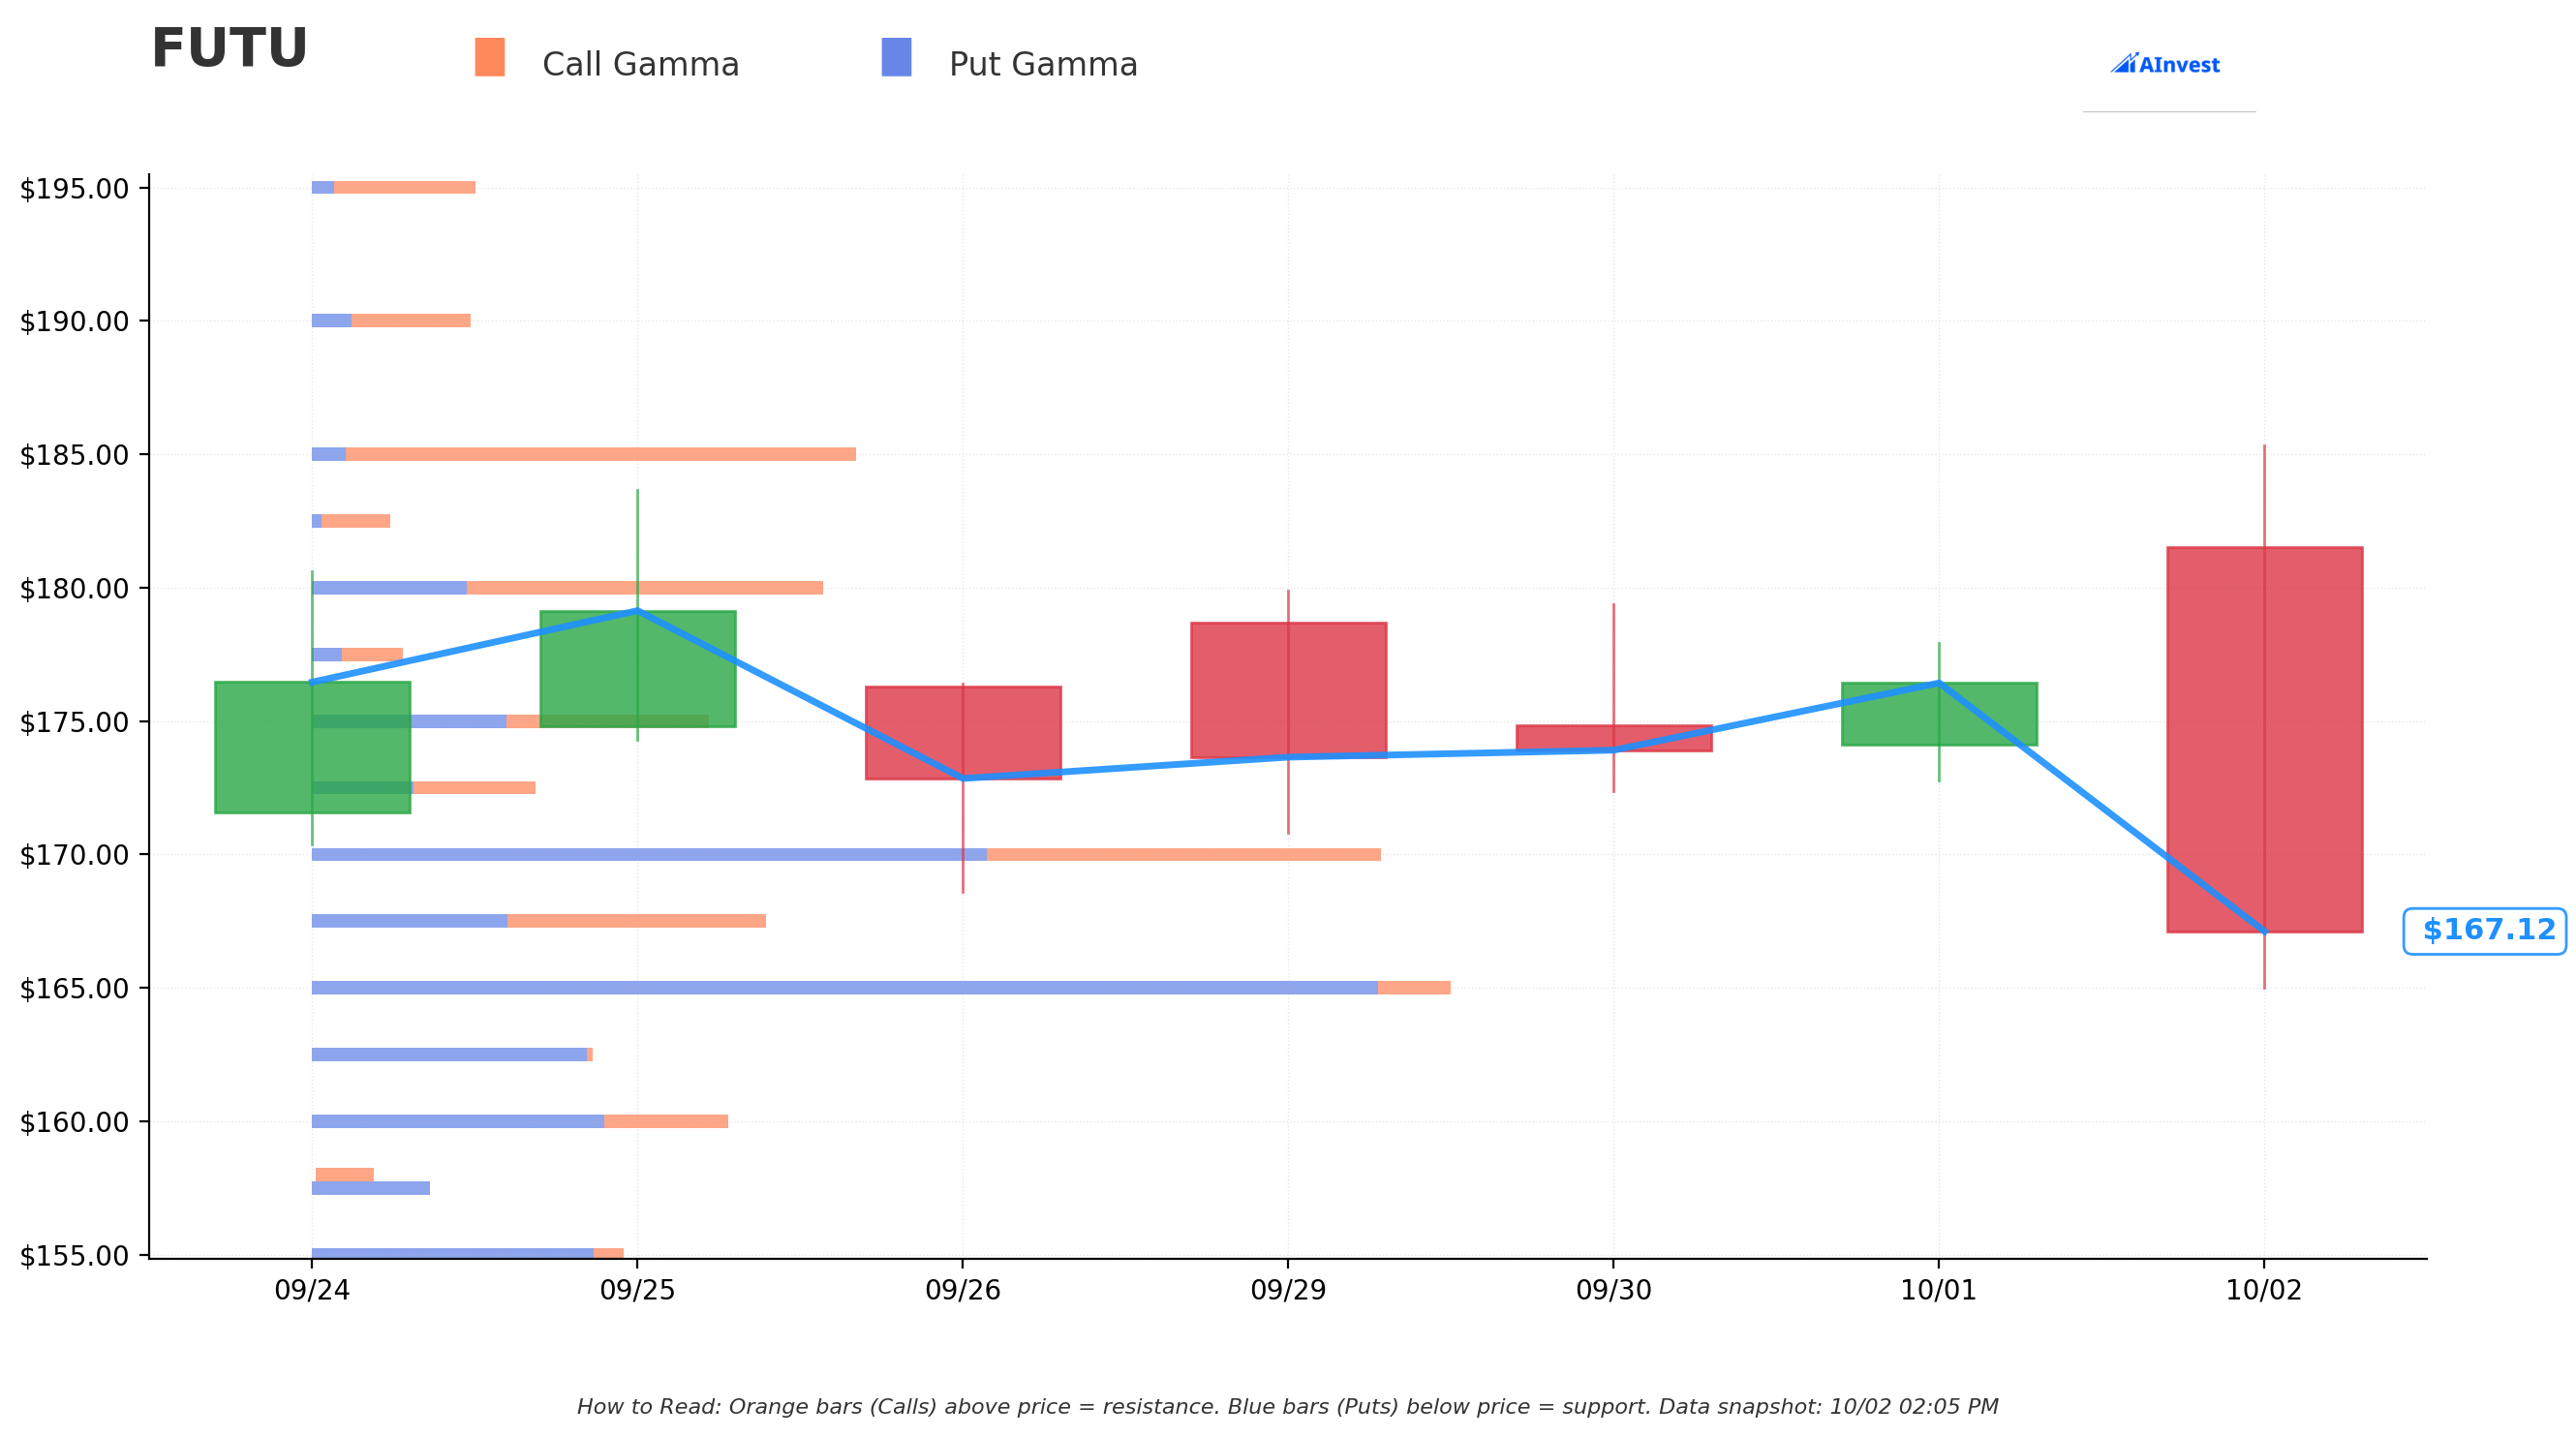
Current Price: $167.15
The gamma chart reveals critical levels that explain this massive trade:
🛡️ Support Levels (Blue Bars - Put Gamma):
- $165 - MASSIVE support wall (strongest level) - just 1.3% below
- $162.50 - Secondary support at 2.8% below
- $160 - Next major floor at 4.3% below
- $155 - Deep support at 7.3% below
- $145 - Ultimate floor at 13.3% below
🎯 Resistance Levels (Orange Bars - Call Gamma):
- $167.50 - Immediate resistance (0.2% above)
- $170 - Major resistance wall at 1.7% above
- $175 - Next ceiling at 4.7% above
- $180 - Strong resistance at 7.7% above
- $185 - Ultimate target at 10.7% above
Translation: The $150 strike chosen for both legs sits perfectly below all major support levels, providing excellent downside protection. Meanwhile, the stock faces its first real test at $170!
⚡ Catalysts
Upcoming Events
Q3 2025 Earnings - November 18, 2025 (3 days before option expiration!)
- Wall Street expects continued momentum from crypto trading launch
- Focus on Malaysia expansion reaching 1M users
- Wealth management AUM surpassing $10B
Crypto Trading Expansion
- U.S. crypto trading across most states supporting 30+ cryptocurrencies
- Hong Kong BTC, ETH, and USDT deposit services launch
International Growth Milestones
- Singapore hitting 1.5M users (1 in 2 residents aged 20-70)
- 20% Malaysia market share target over 2-3 years
Recently Completed
Q2 2025 Results - August 20, 2025
Strategic Partnerships
🎲 Price Targets & Probabilities
Based on gamma levels, catalysts, and the upcoming earnings:
🚀 Bull Case (35% chance)
Target: $180-185
- Break above $170 resistance triggers gamma squeeze
- Crypto trading beats expectations
- Malaysia/Singapore growth accelerates
- Earnings surprise to upside on November 18
😐 Base Case (50% chance)
Target: $165-175
- Consolidation continues in current range
- Stock gravitates toward high gamma zone at $170
- Steady execution on international expansion
- In-line earnings maintain momentum
😰 Bear Case (15% chance)
Target: $155-160
- Regulatory concerns in key markets emerge
- Competition intensifies from traditional brokers
- Market volatility hurts trading volumes
- Strong support at $165 likely holds initially
💡 Trading Ideas
🛡️ Conservative: "Sleep Well Strategy"
Buy FUTU shares outright
- Current price: $167
- Stop loss: $160 (below gamma support)
- Target: $180 (next resistance)
- Risk/Reward: 1:2
⚖️ Balanced: "Follow the Smart Money"
Replicate the institutional trade (smaller size)
- Buy 1x Nov 21 $150 Call @ $25
- Sell 1x Nov 21 $150 Put @ $6
- Net cost: $19 per contract ($1,900)
- Max profit: Unlimited above $169
- Max loss: $1,900 if below $150
🚀 Aggressive: "Gamma Squeeze Play"
- Premium: ~$8 per contract
- Targets $170 resistance break
- Position for earnings catalyst
- Risk entire premium, potential 3x+ return
⚠️ Risk Factors
Real talk - here's what could go wrong:
- Regulatory hammer drops: China or U.S. could change rules overnight
- Crypto volatility: If crypto crashes, could hurt sentiment
- Competition heats up: Robinhood, Schwab fighting for same customers
- Earnings disappointment: High expectations = high risk
- Market correction: Tech/fintech particularly vulnerable
🎯 The Bottom Line
Here's the deal: Someone just placed a $5.5M bet that FUTU continues its monster run through November expiration. With earnings coming 3 days before expiry and multiple growth catalysts converging (crypto launch, international expansion, wealth management growth), this institutional trader is positioning for upside while protecting downside.
Action Plan:
- If you own it: Hold through earnings with stop at $160
- If you're watching: Wait for break above $170 for confirmation
- If you're bearish: That $165 support better break or shorts will get squeezed
Mark your calendar for November 18th earnings - that's when this trade gets decided! With the stock up 222% in a year, picking direction here is gambling, but the gamma levels give us clear battle lines. The smart money just showed their cards - they're betting on continued strength! 💪
Options involve risk and are not suitable for all investors. Past performance doesn't guarantee future results. This analysis is for educational purposes only and not investment advice.