🐻 FXI $11.8M Put Positions - Smart Money Hedging China Rally Before Policy Pivot! 🛡️
📅 December 5, 2025 | 🔥 Unusual Activity Detected
🎯 The Quick Take
Institutions just loaded $11.8 MILLION worth of FXI puts this morning at 11:23:59! Three massive trades totaling 63,000 put contracts (March and June 2026 expirations) at the $39 strike represent sophisticated bearish positioning on China large-cap equities just as Beijing announces its most aggressive policy pivot in 14 years. With FXI at $39.87 after a 9% YTD gain and China's Central Economic Work Conference signaling "moderately loose" monetary policy, smart money is buying downside insurance at the peak. Translation: Institutions are betting policy stimulus won't fix China's structural problems (property crisis, deflation, youth unemployment)!
📊 ETF Overview
iShares China Large-Cap ETF (FXI) provides concentrated exposure to China's largest companies trading on the Hong Kong Stock Exchange:
- Assets Under Management: $6.60 Billion (as of November 27, 2025)
- Inception Date: December 6, 2007
- Exchange: NYSE Arca
- Expense Ratio: 0.74%
- Top Holdings: Alibaba (9.48%), Tencent (8.89%), China Construction Bank (7.25%), ICBC (4.98%), Xiaomi (6.42%)
- Sector Breakdown: Financials 31.81%, Consumer Cyclical 30.06%, Communication Services 18.36%
💰 The Option Flow Breakdown
The Tape (December 5, 2025 @ 11:23:59):
| Time | Symbol | Side | Buy/Sell | Type | Expiration | Premium | Strike | Volume | OI | Size | Spot | Option Price |
|---|---|---|---|---|---|---|---|---|---|---|---|---|
| 11:23:59 | FXI | ASK | BUY | PUT $39 | 2026-06-18 | $7.1M | $39 | 31K | 27K | 31,000 | $39.87 | $2.28 |
| 11:23:59 | FXI | ASK | BUY | PUT $39 | 2026-03-20 | $2.3M | $39 | 16K | 23K | 15,500 | $39.87 | $1.51 |
| 11:23:59 | FXI | ASK | BUY | PUT $39 | 2026-03-20 | $2.4M | $39 | 32K | 23K | 15,500 | $39.87 | $1.52 |
🤓 What This Actually Means
This is a coordinated bearish hedge on China exposure! Here's the breakdown:
- 💸 Total premium deployed: $11.8M across three simultaneous trades
- 🎯 Unified strike: All three at $39 (essentially at-the-money with spot at $39.87)
- 📆 Two timeframes: 31,000 contracts June expiration (195 days) + 31,000 contracts March expiration (105 days)
- 📊 Massive size: 63,000 total contracts representing 6.3 MILLION shares worth ~$251M
- 🔥 Extreme unusualness: Z-scores of 17.46, 12.84, and 6.17 - this is 6-17x more unusual than normal activity!
What's really happening here: These traders are executing a TIME-SPREAD bearish strategy, buying puts at two different expirations to protect against China downside over different timeframes. The March puts ($1.51-1.52) cover near-term risks (China's 15th Five-Year Plan unveiling, Q1 2026 economic data, property crisis developments), while the June puts ($2.28) extend protection through the full stimulus deployment and MI325X/MI350 product launches that could impact Alibaba/Tencent holdings.
Why $39 strike? This is BARELY below current price - they're not betting on a crash, but rather protecting against the inability of China's "moderately loose" monetary policy to overcome structural headwinds (property sector death spiral, deflationary pressures, youth unemployment at 17.3%). If FXI can't hold $39 support despite massive stimulus, it signals fundamental problems can't be papered over.
Unusual Score Analysis:
- June $39 Put (31,000 contracts): Z-score 17.46 = EXTREMELY UNUSUAL - this is 17.46 standard deviations above average, happens maybe 2-3 times per year
- March $39 Put Trade #1 (15,500 contracts): Z-score 12.84 = EXTREMELY UNUSUAL - roughly 13x above normal activity
- March $39 Put Trade #2 (15,500 contracts): Z-score 6.17 = EXTREMELY UNUSUAL - roughly 6x above normal activity
Classification insight: One March trade classified as "BTC" (Buy to Close) with Z-score 6.17 suggests this might be ROLLING existing positions forward - closing shorter-dated puts and opening March/June positions. This shows dynamic hedging, not panic selling.
📈 Technical Setup / Chart Check-Up
YTD Performance Chart
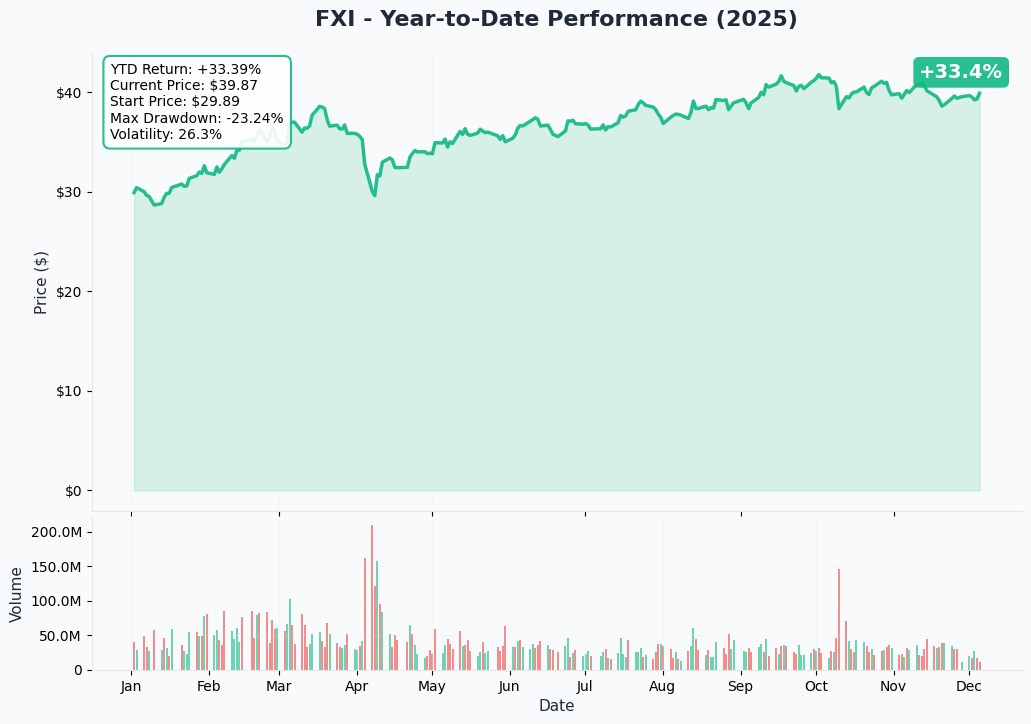
FXI is showing a +9% YTD gain at $39.87 (started year around $36.50), but the chart reveals a volatile, whipsaw journey rather than steady appreciation. The ETF touched a 52-week low of $28.41 in April (crushing -39% drawdown) before recovering to current levels.
Key observations:
- 🎢 Wild volatility: Massive rally from $28.41 to $42.00 (48% surge) in late September on stimulus hopes, then sharp pullback to current $39.87
- 📉 Bearish crossover: 10-day moving average crossed below 50-day MA on November 7, 2025 - technical sell signal
- ⬇️ Downtrend confirmed: Aroon indicator entered downward trend December 3, 2025 (just 2 days ago!)
- 💸 Sustained outflows: -$2.36 billion in net outflows over past year despite positive price performance - investors don't believe the rally
- 📊 Recent weakness: Down from October highs near $42 to $39.87 (-5%) as policy optimism fades
- ⚠️ Trade war residue: YTD performance masks earlier collapse - still 5% below all-time highs despite stimulus announcements
The chart pattern shows a "dead cat bounce" - sharp recovery from crisis lows, but failing to sustain momentum as fundamental problems persist.
Gamma-Based Support & Resistance Analysis
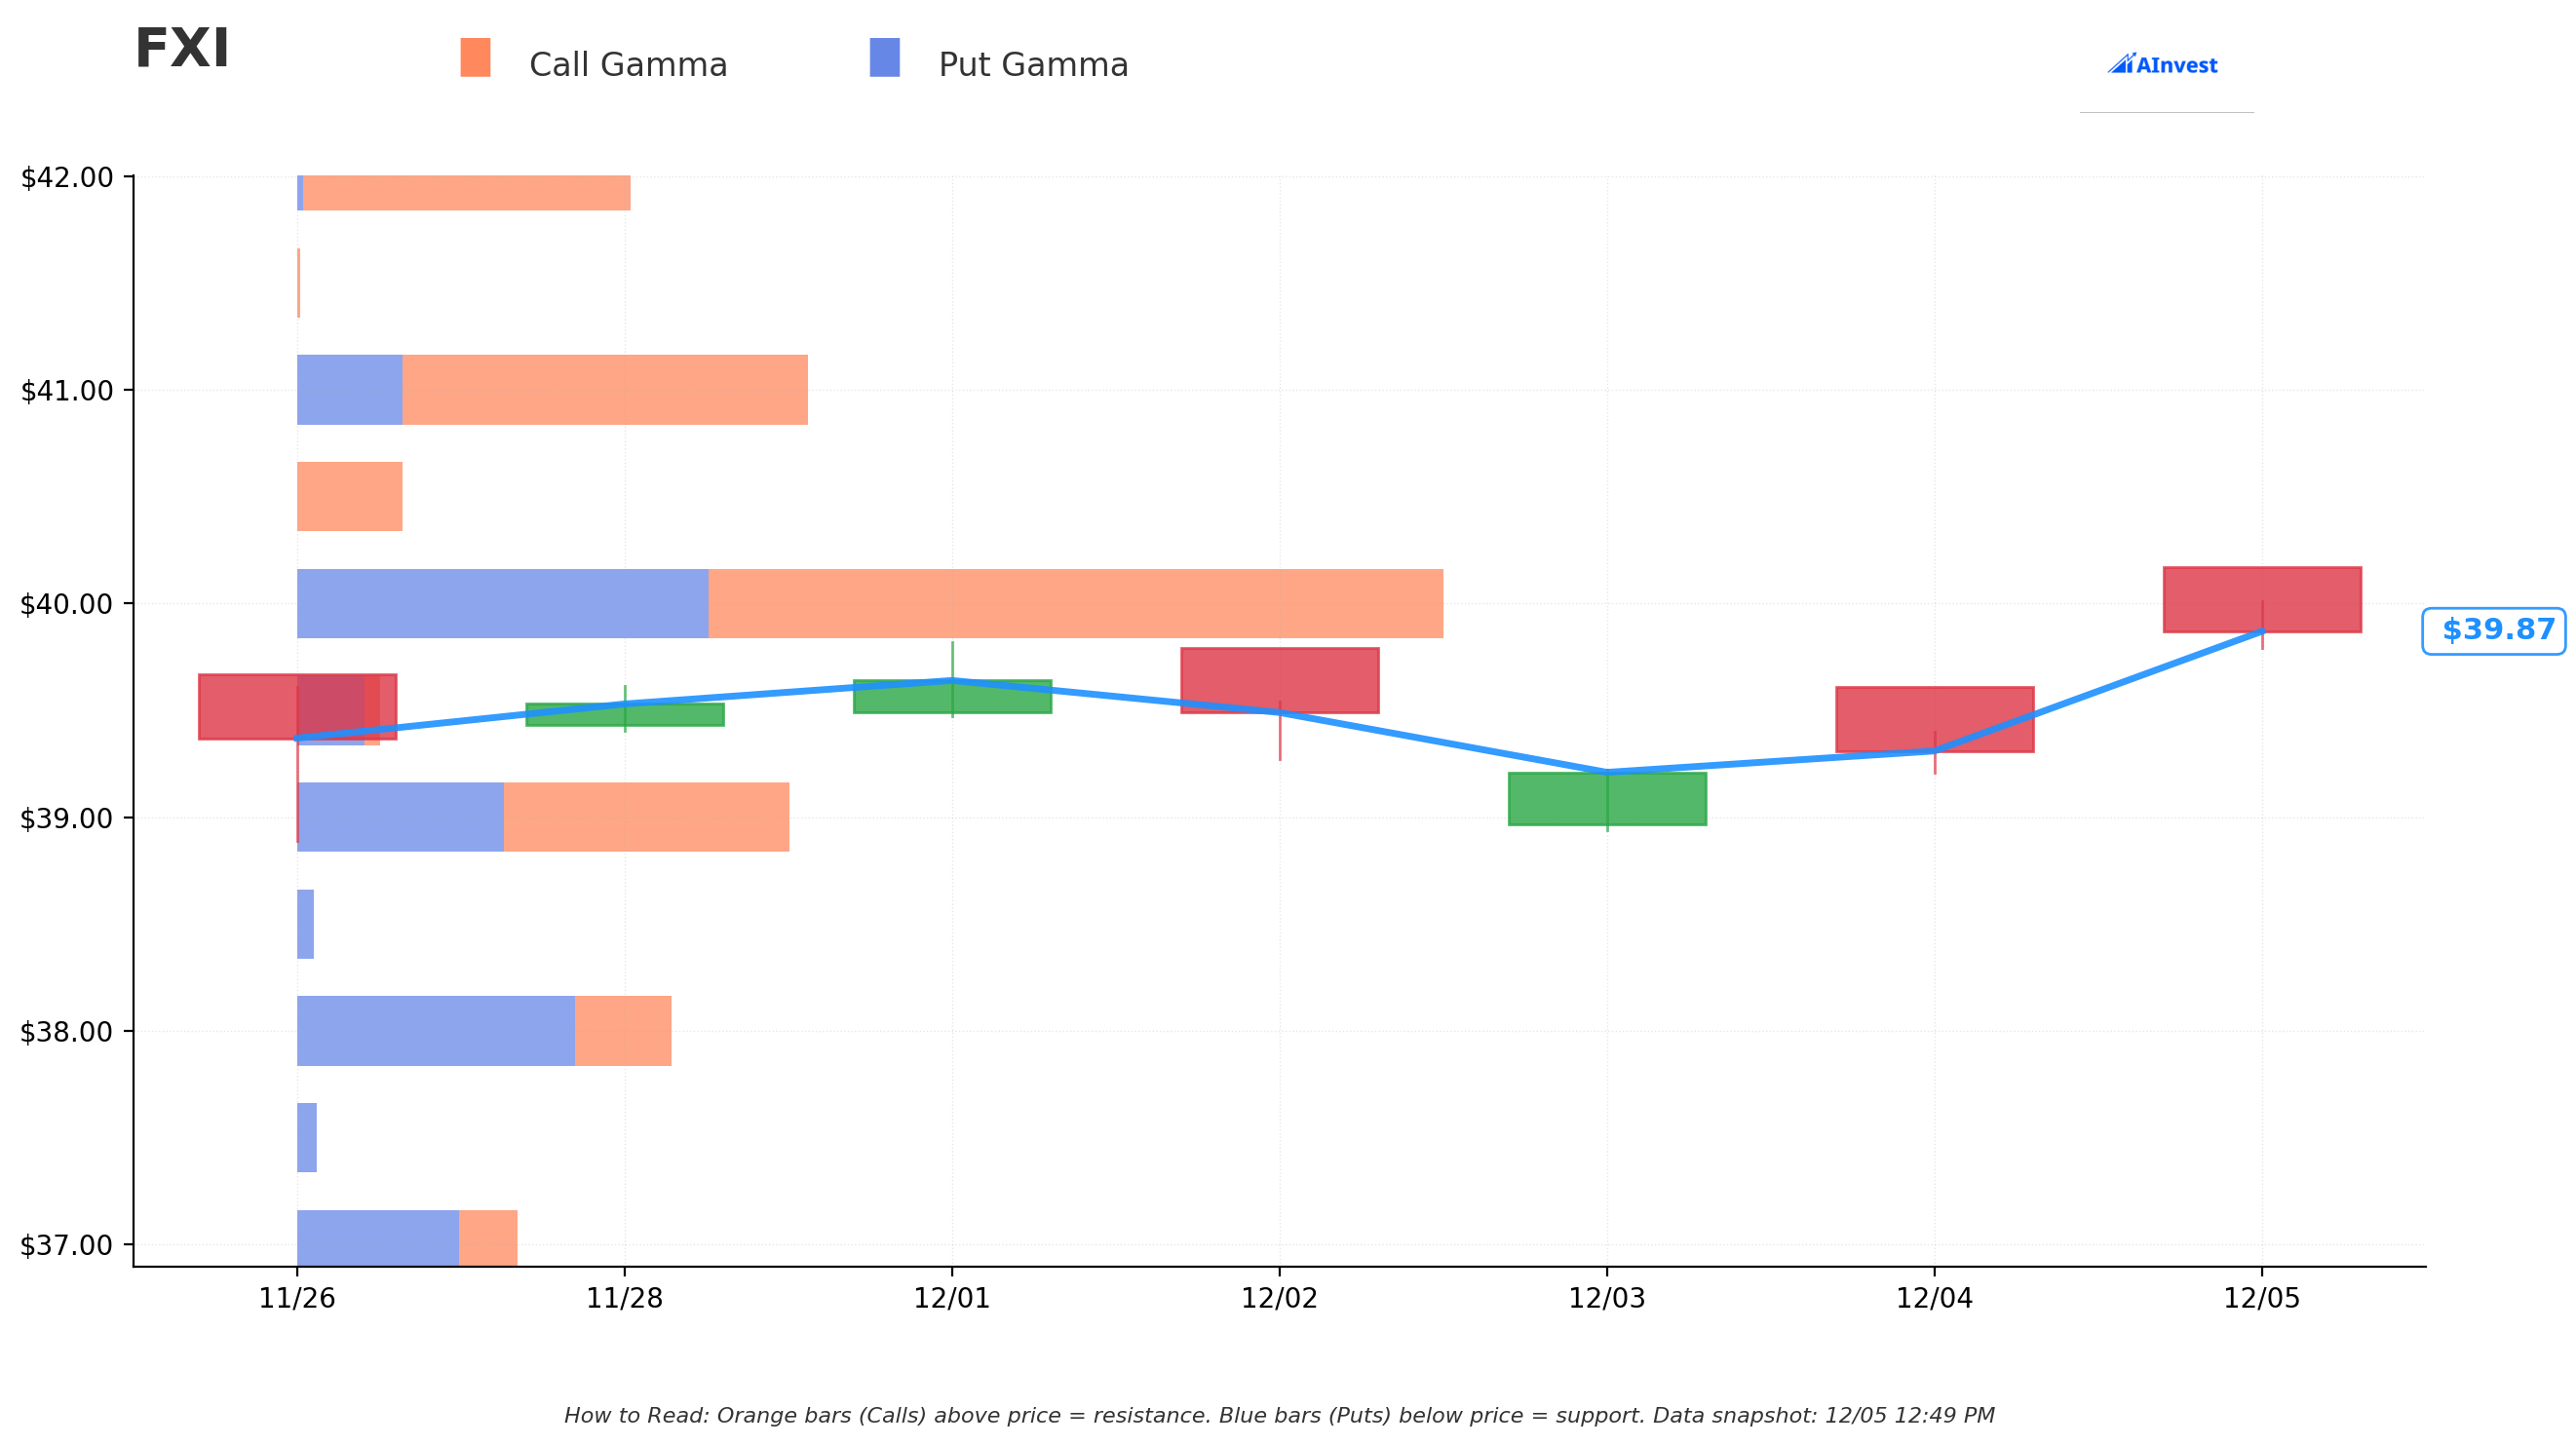
Current Price: $39.87
The gamma exposure map reveals critical battle lines that will determine near-term price action:
🔵 Support Levels (Put Gamma Below Price):
- $39.00 - MAJOR SUPPORT with 170.6M total gamma (28.3M net bullish) - THIS IS WHERE THE PUTS ARE STRUCK! Not coincidental
- $38.00 - Secondary support at 128.7M gamma (62.6M net bearish - dealers will hedge by selling into weakness)
- $37.00 - Deeper support zone with 72.8M gamma (39.1M net bearish)
- $36.00 - Extended floor at 44.5M gamma (35.8M net bearish) - disaster scenario
🟠 Resistance Levels (Call Gamma Above Price):
- $40.00 - IMMEDIATE CEILING with 402.3M gamma (119.1M net bullish - STRONGEST RESISTANCE LEVEL!)
- $40.50 - Minor resistance at 37.0M gamma (37.0M net bullish)
- $41.00 - Secondary ceiling with 177.5M gamma (104.8M net bullish)
- $42.00 - Major resistance at 116.0M gamma (111.7M net bullish) - October high
- $43.00 - Extended upside target at 42.1M gamma (28.6M net bullish)
- $44.00 - Distant ceiling at 53.4M gamma (52.7M net bullish)
What this means for traders: FXI is trading in a NARROW $0.87 range between $39 support (170.6M gamma) and $40 resistance (402.3M gamma - the SINGLE LARGEST LEVEL). The massive gamma wall at $40 creates natural selling pressure as price approaches - market makers will systematically sell to hedge their positions. This is a classic "consolidation box" setup where price gets pinned between two major gamma levels.
Notice the put strike placement? The traders struck $39 puts EXACTLY at the major support level with 170.6M total gamma. They're betting that if FXI breaks below $39 support, there's significant air pockets down to $38 (128.7M) and then $37 (72.8M). The net bearish gamma at $38 and $37 levels means dealer hedging will ACCELERATE downside moves if $39 breaks.
Net GEX Bias: Bullish (852M call gamma vs 555M put gamma = 297M net bullish) - Overall positioning leans bullish, but immediate price action severely constrained by overhead $40 resistance. This creates asymmetric risk: limited upside (+$0.13 to $40), but significant downside (-$0.87 to $39 support, then -$2 to $37).
Implied Move Analysis
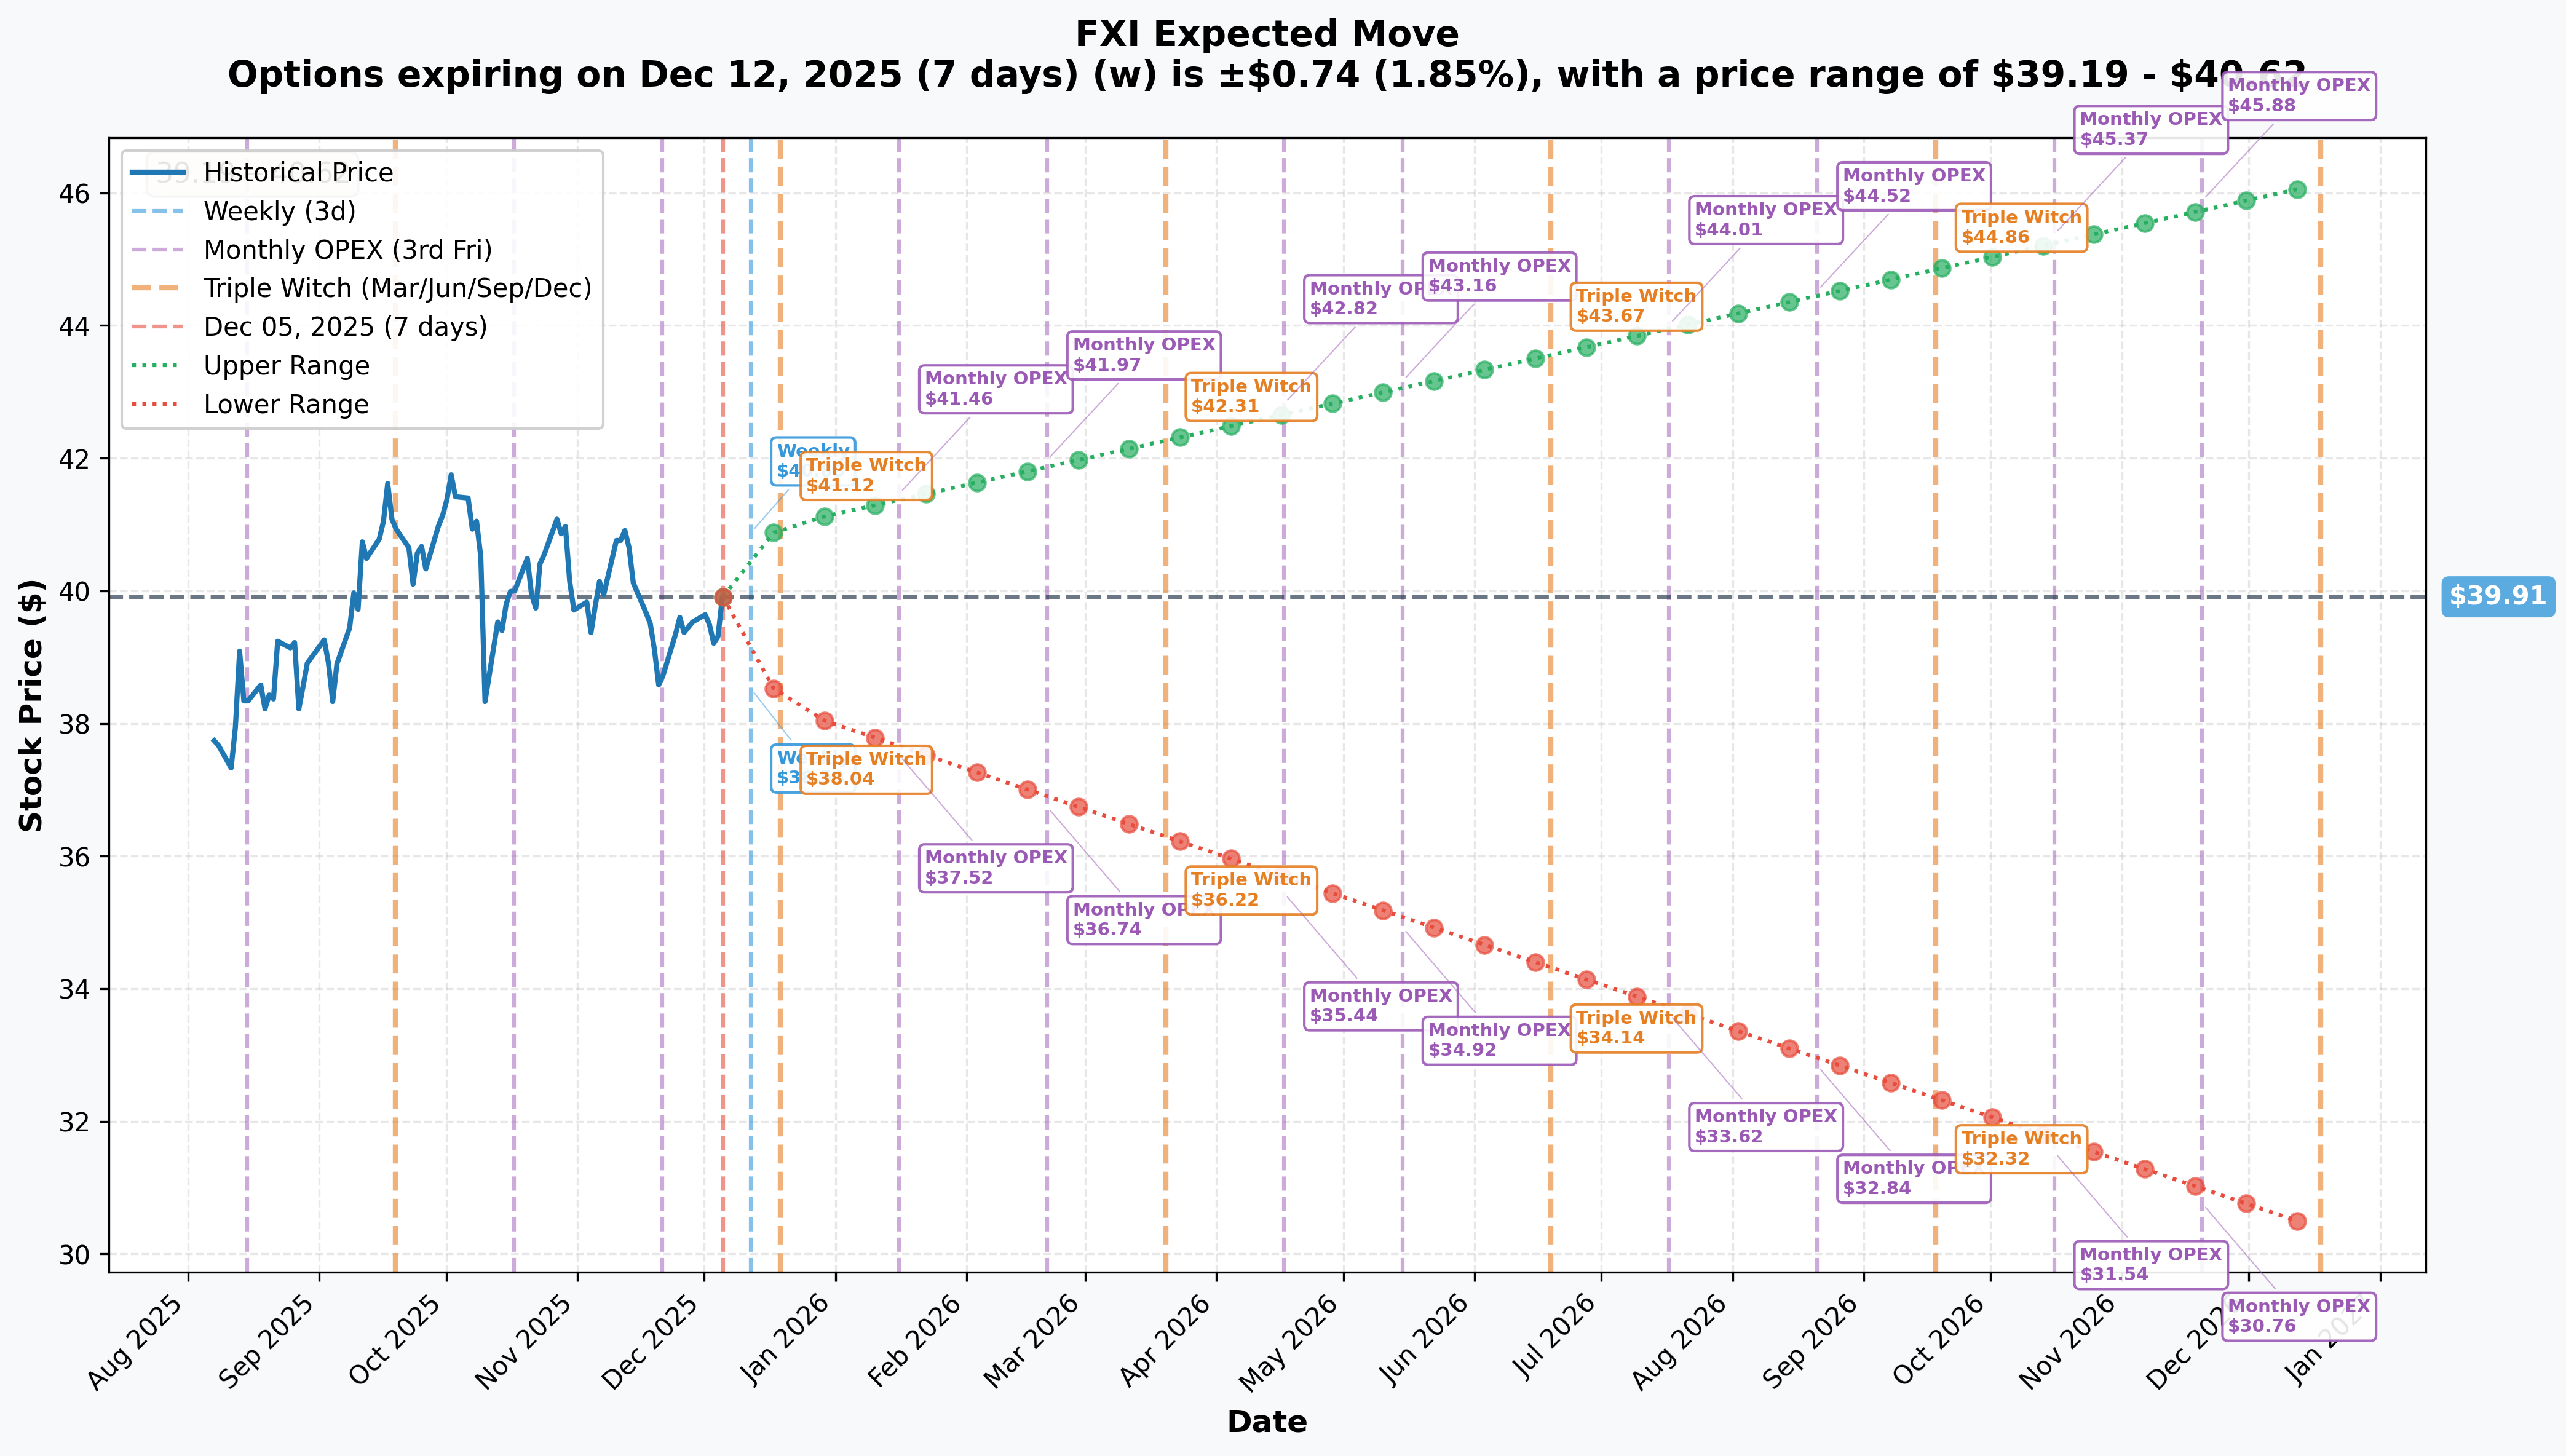
Options market pricing for upcoming expirations:
- 📅 Weekly (Dec 12 - 7 days): ±$0.74 (±1.85%) → Range: $39.19 - $40.62
- 📅 Monthly OPEX (Dec 19 - 14 days): ±$1.27 (±3.17%) → Range: $38.26 - $40.98
- 📅 Quarterly Triple Witch (Dec 19 - same): ±$1.27 (±3.17%) → Range: $38.26 - $40.98
- 📅 March OPEX (Mar 20 - 105 days - THESE TRADES!): Approximately ±$2.09 (±5.2%) → Range: $37.22 - $42.20
- 📅 June OPEX (Jun 18 - 195 days - THIS TRADE!): Approximately ±$3.46 (±8.7%) → Range: $35.84 - $44.57
- 📅 Yearly LEAPS (Dec 18, 2026 - 378 days): ±$6.93 (±17.36%) → Range: $30.37 - $46.14
Translation for regular folks: Options traders are pricing in a modest 1.85% move ($0.74) by next Friday for weekly expiration, expanding to 3.17% ($1.27) through December triple witch. The market expects relatively LOW volatility near-term despite China policy announcements.
However, the March expiration (where one set of puts expires) shows a lower range of $37.22 - meaning the market thinks there's a real possibility FXI could trade 6.6% lower over the next 3.5 months. The June expiration extends downside to $35.84 (10% below current) - aligning with the put buyers' thesis that stimulus effectiveness is questionable.
Key insight: The relatively LOW implied volatility (3.17% for monthly) compared to historical 39.6% drawdowns suggests options are UNDERPRICING China risk. The put buyers may be exploiting cheap volatility to get downside protection at attractive prices before catalysts hit.
Catalyst alignment: The March 20 expiration captures China's 15th Five-Year Plan unveiling in March 2026, Q1 2026 economic data, and Alibaba's Q4 FY2025 earnings on February 19, 2026. The June expiration extends through full fiscal stimulus deployment and MI325X/MI350 ramp affecting tech holdings.
🎪 Catalysts
🔥 Past Catalysts (Already Happened - Baked Into Price)
China's Monetary Policy Pivot - December 11-12, 2025 (JUST ANNOUNCED!) 🏦
China's Central Economic Work Conference delivered the most significant monetary policy shift in 14 years, moving from "prudent" to "moderately loose" stance - first change since 2011:
- 💰 Fiscal deficit target raised to 4% of GDP for 2025 (up from 3% in 2024)
- 📉 PBOC signaled 50-100 basis point RRR cuts and 30 basis point loan prime rate reductions
- 💸 1.2 trillion yuan ($165 billion) liquidity injection through RRR cuts
- 🏠 Mortgage rate cuts to 2.6% for first-time buyers (from 2.85%), down payments lowered to 15%
- 🚧 1 trillion yuan infrastructure funds targeting transportation and public services
Market reaction: Hang Seng Index rose to 25,936 on December 4 (+0.7%), but FXI remains stuck at $39.87 - well below October highs of $42. Muted response suggests skepticism about policy effectiveness.
Why this matters for puts: BlackRock assessed the stimulus as "not yet enough to address drags on economic growth". If China's BIGGEST policy bazooka in 14 years can't move the needle on growth, what will? The put buyers are betting the answer is "nothing" - structural problems (property crisis, deflation, youth unemployment) can't be solved with monetary easing alone.
Q3 2025 GDP Deceleration - October 2025 📊
China's economy continued slowing in Q3 2025:
- 📉 Q3 GDP: +4.8% YoY (down from 5.2% in Q2) - slowest pace since Q3 2024
- 📊 Q4 2025 forecast: Deceleration to below 4.5% according to OCBC Bank
- 📈 First 9 months 2025: +5.2% YoY, on track to meet ~5% annual target but losing momentum
- 💸 Fixed-asset investment fell 11.4% in October YoY - worst since early 2020
Manufacturing PMI Weakness - November 2025 🏭
Manufacturing data showed persistent contraction despite stimulus announcements:
- 📉 Official PMI: 49.2 (up 0.2 from October, but still below expansion threshold of 50)
- 📊 Private survey PMI (S&P Global): 49.9 (missed expectations of 50.5)
- 🚫 Non-manufacturing PMI: 49.5 (first contraction since December 2022)
Retail Sales Disappointment - October 2025 🛍️
Consumer spending remained weak despite government stimulus programs:
- 📉 Retail sales up 2.9% YoY (vs 3.0% in September) - weakest since August 2024
- 💰 Household savings surged to RMB 17.94 trillion in H1 2025 (vs 11.46 trillion in H1 2024) - stimulus NOT reaching consumption!
- 😰 Consumer confidence near historic lows despite policy support
- ❄️ Four consecutive months of declining consumer prices through October 2025 - deflationary spiral
Top Holdings Earnings (Mixed Results) 📊
Alibaba (9.48% of FXI):
- ✅ Q4 FY2025: Revenue $32.6B (+7% YoY), non-GAAP EPS $1.73 (beat by 16.89%)
- 🤖 Cloud Intelligence Group revenue +18% YoY to $4.15B, AI revenue up triple-digits for 7th consecutive quarter
- 📉 Stock reaction: Fell 8% post-earnings despite beat - revenue miss vs expectations
- 📅 Next earnings: February 19, 2026
Tencent Holdings (8.89% of FXI):
- 💰 Q3 2025: Revenue +14% YoY to RMB 557.4B (9 months), net profit +17% to RMB 166.6B
- 📈 Non-IFRS net profit: RMB 70.6B (+18% YoY) for Q3
- 💵 Free cash flow stable at RMB 58.5B; net cash position +37% QoQ to RMB 102.4B
- 📊 Current price: HKD 611.00 (-0.97%)
Banking Holdings (CCB 7.25%, ICBC 4.98% of FXI):
- 📉 Q1 2025: ICBC net income fell 3.99% to RMB 84.2B; CCB posted similar decline
- ⚠️ Net interest margins at record lows for banking sector due to rate cuts
- 📊 2024 full year: Operating income for large banks down 0.27% YoY
US-China Trade Truce - October 2025 🤝
Trump-Xi Summit delivered temporary détente:
- 📉 One-year trade truce agreed, with US tariffs lowered to ~47% (from peak of 145%)
- 🌾 China agreed to purchase 12M metric tons of US soybeans late 2025, plus 25M tons annually 2026-2028
- ⛏️ Rare earth export control suspension for one year (through November 10, 2026)
- ⚠️ Current average US tariffs on China: 47.5%; Chinese tariffs on US: 31.9% - still elevated!
🚀 Upcoming Catalysts (Next 6 Months - Within Put Expiration Windows)
December 2025 Catalysts:
December 9-10: China CPI/PPI Data for November 📊
- 📉 October CPI: +0.2% YoY (first increase since June, but still anemic)
- 🎯 CEWC explicitly prioritized "reasonable rebound in prices" for 2025 - watching for deflation reversal
- ⚠️ Risk: Continued deflation would signal stimulus failure, validating bearish thesis
December 16: USTR Public Hearing on Section 301 Investigation 🇺🇸
- 🚨 Public hearing on China's Phase One agreement implementation
- ⚖️ Could trigger new tariff considerations despite October truce
- 💸 Potential negative catalyst if U.S. signals dissatisfaction with China compliance
December 31: China Manufacturing PMI for December 🏭
- 📊 November PMI at 49.2 (below expansion threshold) - need >50 to signal recovery
- 🎯 Market watching whether monetary easing translates to manufacturing activity
- 📉 Risk: Another sub-50 reading would suggest policy ineffectiveness
January 2026 Catalysts:
Early January: China CPI/PPI for December
- 🎯 Critical test of whether stimulus reversing deflation trend
- 📊 Market expects policy transmission to begin showing in price data
Mid-January: Q4 2025 GDP Release 📊
- 📉 Consensus: Deceleration to 4.5% or below (from 4.8% in Q3)
- 🎯 Full-year 2025 likely misses ~5% target if Q4 disappoints
- ⚠️ Critical for puts: If GDP decelerates despite massive stimulus, validates structural problem thesis
February-March 2026 Catalysts (March Put Expiration Window):
February 19, 2026: Alibaba Q4 FY2025 Earnings 📱
- 🤖 Market watching for AI revenue growth acceleration and cloud momentum
- 💰 Guidance for FY2026 critical - needs to show sustained growth story
- ⚠️ Risk: Stock fell 8% on last earnings despite beat - high expectations, execution matters
March 2026: 15th Five-Year Plan Unveiling (2026-2030) 🏛️
- 📊 China's National People's Congress to unveil strategic roadmap
- 🎯 Expected ~5% annual growth target (implying 4.5% real growth)
- 🔬 Focus areas: Scientific/technological self-reliance, advanced manufacturing, environmental goals
- 📈 Goldman Sachs forecasts 5-6% annual export growth, raising 2026-2027 GDP forecasts above consensus
- ⚠️ Critical for March put expiration: If plan disappoints on growth targets or structural reform ambition, validates downside scenario
Q1 2026 Monetary Easing Acceleration:
- 📉 Expected RRR cuts of 50-100 basis points
- 💰 Loan prime rate reductions of 30 basis points anticipated
- 💸 Additional liquidity injections through PBOC facilities
- ⚠️ Two-way risk: Success = bullish for FXI, but further easing WITHOUT growth response = bearish confirmation
April-June 2026 Catalysts (June Put Expiration Window):
AI Sector Catalyst - DeepSeek Ecosystem Expansion 🤖
- 🚀 DeepSeek-R1 sparked AI renaissance with government backing
- 💰 Goldman Sachs estimates 20-30 basis point GDP boost by 2030 from AI adoption
- 🏢 Alibaba pledged $53B investment in cloud/AI infrastructure over next 3 years
- 🎯 Baidu, Alibaba, Tencent racing to launch competing LLMs
- ⚠️ Risk for puts: Successful AI monetization could boost Alibaba/Tencent (18% of FXI), offsetting macro weakness
Property Sector Stabilization Efforts 🏗️
- 💰 1 trillion yuan infrastructure funds deployed
- 🏠 Down payment reductions and mortgage rate cuts implemented
- 🚨 Major risk: Vanke (first state-backed developer) requesting debt restructuring signals crisis deepening
- 📉 Real estate investment down 14.7% in first 10 months of 2025
- ⚠️ Critical for puts: Property sector still 25% of GDP - if stabilization fails by June 2026, bearish case strengthens dramatically
Fiscal Stimulus Deployment (Q1-Q2 2026) 💰
- 💵 Increased issuance of ultra-long special treasury bonds
- 🏛️ Local government special-purpose bond expansion
- 📊 Fiscal impulse estimated at 1.6% of GDP in 2025-2026
- 🎯 Key metric: Watch credit growth, consumption data, property stabilization for evidence of policy transmission
⚠️ Risk Catalysts (Negative - Supporting Put Thesis)
Taiwan Conflict Escalation (Extreme Impact, Low-Medium Probability) 🇨🇳🇹🇼
- 🚨 China deployed largest naval presence to date (100+ vessels) across East Asian waters
- ⚖️ Japan-China diplomatic crisis erupted after Japanese PM stated Taiwan conflict would be "survival-threatening"
- 💰 Taiwan approved additional $40B defense spending; China increased defense budget 7.2% to $245B
- 💥 Any military action would crater FXI 30-50% instantly - ultimate tail risk
Trade War Re-escalation (High Impact, Medium Probability) 🇺🇸
- ⏰ One-year trade truce expires October 2026 (within June put timeframe) - no permanent resolution
- 🚨 December 16, 2025 USTR hearing could trigger new tariff considerations
- 📊 Current 47.5% average US tariffs remain elevated vs historical norms
- 💻 Semiconductor export controls continue despite rare earth détente
🎲 Price Targets & Probabilities
Using gamma levels, implied move data, and catalyst timeline, here are the scenarios through June 18, 2026 expiration:
📈 Bull Case (20% probability)
Target: $44-$47
How we get there:
- 💪 Monetary easing WORKS - Q1 2026 GDP accelerates to 5%+, manufacturing PMI breaks above 52
- 🏠 Property sector stabilizes - Vanke crisis resolved, home sales inflect positive
- 🤖 AI revenue boom - Alibaba/Tencent cloud growth accelerates to 25%+ on DeepSeek ecosystem
- 📊 15th Five-Year Plan surprises bullish - aggressive 6% growth target with structural reforms
- 🇺🇸 US-China tensions de-escalate further - tariffs reduced below 40%, tech export controls eased
- 💰 CPI turns positive +1-2% range - deflation reversed, consumer confidence rebounds
- 📈 Breakout above $40 gamma resistance triggers technical rally to $42, then $44-47 range
- 🌍 Goldman Sachs 5-6% export growth thesis materializes
Key metrics needed:
- Credit growth acceleration (>10% YoY loan growth)
- Retail sales inflect to 5%+ growth
- Property investment stabilizes (stops declining)
- Youth unemployment drops below 15%
Probability assessment: Only 20% because it requires PERFECT policy execution overcoming MASSIVE structural headwinds (property crisis, deflation, demographic decline). BlackRock already assessed stimulus as "not yet enough". History shows China stimulus multipliers declining over time.
Put P&L in Bull Case:
- FXI at $45 on June 18: Puts expire worthless, loss = -$2.28/share × 31,000 = -$7.1M (100% loss on June puts)
- Total loss on all three trades: -$11.8M (100% loss)
🎯 Base Case (55% probability)
Target: $36-$42 range (CHOPPY CONSOLIDATION)
Most likely scenario:
- ⚖️ Stimulus shows MIXED results - some green shoots but no dramatic inflection
- 📊 Q1 2026 GDP at 4.5-5.0% (meets targets but doesn't accelerate)
- 🏠 Property sector bleeds slowly - no catastrophic collapse but no recovery either
- 💰 CPI edges positive to 0.5-1.0% range - modest improvement from deflation
- 🤖 AI revenue solid at Alibaba/Tencent but not enough to carry entire FXI
- 🇺🇸 US-China trade truce holds but tensions simmer
- 🔄 Trading within gamma support ($37-$39) and resistance ($40-$42) bands for months
- 📉 Continued fund outflows despite stability - investors still skeptical
- 💤 Volatility remains moderate - no crisis, no euphoria
This is the put sellers' NIGHTMARE scenario: FXI drifts sideways to slightly lower, puts decay slowly but never get deep in-the-money for major profits. The $11.8M serves its hedging purpose (protects against downside), but doesn't generate significant P&L.
Why 55% probability: Most realistic outcome given China's track record. Authorities competent at preventing disasters but struggle to generate sustained growth. Structural problems (demographics, debt, property oversupply) can't be quickly solved. FXI likely trapped in range until macro catalyst emerges.
Put P&L in Base Case:
- FXI at $37-38 on June 18: June puts worth $1-2, loss = -$0.28 to +$1.72/share × 31,000 = -$8.7M to +$5.3M (-73% to +45% ROI)
- FXI at $39-40 on June 18: Puts expire worthless to minimal value = -$7M to -$11M loss (-60% to -93% ROI)
📉 Bear Case (25% probability)
Target: $32-$36 (TEST MAJOR SUPPORT!)
What could go wrong:
- 😰 Stimulus proves INEFFECTIVE - Q1 2026 GDP decelerates to 4% or below despite easing
- 🏚️ Property crisis DEEPENS - Vanke bankruptcy triggers contagion, more state-backed developers default
- 📉 Deflation PERSISTS - CPI remains negative through Q1 2026, consumer confidence collapses further
- 👥 Youth unemployment spikes above 20% - social instability concerns
- 💸 Banking sector stress - Net interest margins compress further, NPL recognition accelerates (hurts 31.81% financial holdings)
- 🇹🇼 Taiwan tensions escalate - military incidents or blockade threats
- 🇺🇸 Trade war resumes - new tariffs imposed post-USTR hearing or after October 2026 truce expiration
- 📊 15th Five-Year Plan disappoints - conservative targets acknowledge structural growth limits
- 🤖 Tech crackdown resumes - New Anti-Unfair Competition Law enforcement intensifies, hits Alibaba/Tencent profitability
- 🔨 Break below $39 gamma support triggers cascade to $37, then $36, then $32
Critical support levels:
- 🛡️ $39: Major gamma floor (170.6M) + put strike - MUST HOLD or momentum shifts bearish
- 🛡️ $37: Deep support (72.8M gamma) - break here signals serious trouble
- 🛡️ $36: Extended floor (44.5M gamma) - disaster scenario
- 🛡️ $32-33: 52-week lows from April 2025 - ultimate retest zone
Probability assessment: 25% because it requires multiple negative catalysts aligning. China authorities have proven ability to prevent systemic crises. However, structural problems ARE real - property sector down 14.7%, 4 months of deflation, youth unemployment 17.3%. The put buyers clearly think this scenario has >25% odds or they wouldn't deploy $11.8M.
Put P&L in Bear Case:
- FXI at $35 on June 18: June puts worth $4, profit = $1.72/share × 31,000 = $5.3M gain (75% ROI on June puts)
- FXI at $33 on June 18: June puts worth $6, profit = $3.72/share × 31,000 = $11.5M gain (162% ROI!)
- FXI at $30 on June 18: June puts worth $9, profit = $6.72/share × 31,000 = $20.8M gain (293% ROI!!)
💡 Trading Ideas
🛡️ Conservative: Avoid China Exposure Until Clarity
Play: Stay on sidelines or REDUCE existing FXI positions until policy effectiveness proven
Why this works:
- ⏰ Too many binary catalysts over next 6 months (15th Five-Year Plan, Q1 GDP, property crisis, Taiwan tensions)
- 💸 Institutional outflows of -$2.36B over past year despite +9% YTD - smart money exiting
- 📊 BlackRock assessment: "Not yet enough to address drags on economic growth"
- 🎯 Better opportunities in U.S. equities without geopolitical tail risks
- 📉 The $11.8M institutional put purchase signals sophisticated players are WORRIED
- 🤔 If policy pivot in 14 years can't move FXI above $42, what will?
Action plan:
- 👀 Watch Q1 2026 GDP data (mid-January) for acceleration vs deceleration
- 🎯 Monitor March 15th Five-Year Plan unveiling for growth targets and reform ambition
- ✅ Need to see: Credit growth >10%, retail sales >5%, property investment stabilization
- 📊 Look for gamma support break below $39 as SELL signal
- ⏰ Revisit after June 2026 if fiscal stimulus shows concrete results
Risk level: Minimal (cash/alternative allocation) | Skill level: Beginner-friendly
Expected outcome: Avoid potential -10-20% drawdown if structural problems persist. Maintain optionality to re-enter if growth inflects. Better sleep at night.
⚖️ Balanced: Post-Catalyst Put Spreads (Copy The Smart Money)
Play: After 15th Five-Year Plan unveiling (March 2026), consider put spread if plan disappoints
Structure: Buy $39 puts, Sell $36 puts (June 18 expiration - SAME as institutional trade)
Why this works:
- 📊 Defined risk spread ($3 wide = $300 max risk per spread)
- 🎯 Targets gamma support breakdown zone ($39 → $37 → $36)
- 🤝 Mimics institutional positioning at likely better entry prices (after vol spike on Five-Year Plan)
- ⏰ June expiration captures full fiscal stimulus deployment period
- 🛡️ Protects against property crisis contagion, deflation persistence, trade war escalation
- 💰 Limited capital at risk vs. naked puts
Estimated P&L (depends on entry timing):
- 💸 Pay ~$1.00-1.50 net debit per spread after Five-Year Plan (if FXI still near $39-40)
- 📈 Max profit: $150-200 if FXI below $36 at June expiration
- 📉 Max loss: $100-150 if FXI above $39 (defined and limited)
- 🎯 Breakeven: ~$37.50-38.00
- 📊 Risk/Reward: ~1:1.3 which is acceptable for directional bearish play
Entry criteria:
- ⏰ ONLY enter if 15th Five-Year Plan shows conservative targets (<5% growth) or lacks structural reform
- 🎯 Need FXI trading $38-41 range (gives room to work)
- ❌ Skip if FXI already below $37 (too late) or above $42 (stimulus working)
- 📊 Look for confirmation: Q1 GDP disappointment, continued deflation, property stress
Position sizing: Risk only 2-5% of portfolio (this is directional China bearish bet)
Risk level: Moderate (defined risk, bearish directional) | Skill level: Intermediate
🚀 Aggressive: Long Volatility Straddle on Catalysts (ADVANCED ONLY!)
Play: Buy straddle into major catalyst events (15th Five-Year Plan, Alibaba earnings) betting on volatility explosion
Structure: Buy $40 calls + Buy $40 puts (March 20 expiration for Five-Year Plan trade)
Why this could work:
- 💥 Current implied vol only 3.17% for monthly - seems TOO LOW given catalyst density
- 🎰 Betting FXI makes 6-8%+ move on Five-Year Plan announcement (either bullish surprise or bearish disappointment)
- 📊 Historical 39.6% max drawdown shows FXI can MOVE violently on macro shifts
- ⚡ Binary nature of catalysts (stimulus works vs doesn't work) creates fat-tail outcomes
- 🌏 Geopolitical tail risks (Taiwan conflict, trade war) could trigger 10-15% gap overnight
Why this could blow up (SERIOUS RISKS):
- 💸 CAPITAL INTENSIVE: Straddle costs ~$2.50-3.00 ($250-300 per straddle)
- ⏰ TIME DECAY BRUTAL: Theta burns -$10-15/day approaching catalyst
- 😱 VOL CRUSH RISK: Even if FXI moves 4-5%, IV collapse could still cause loss on both legs
- 📊 Range-bound hell: FXI could stay $38-42 for months while straddle decays
- 🎢 Need 7%+ move to breakeven after accounting for premium paid
- ⚠️ Five-Year Plan could be "as expected" - FXI moves 2-3% and straddle loses 40-60%
Estimated P&L:
- 💰 Cost: ~$2.50-3.00 per straddle
- 📈 Profit scenario: FXI moves to $43+ or $37- (7%+ move) = $1-2 gain (30-70% ROI)
- 🚀 Home run: FXI moves to $45 or $35 (12%+ move) = $4-5 gain (150-200% ROI)
- 📉 Loss scenario: FXI ends $38-42 range = lose $1.50-2.50 (50-80% loss)
- 💀 Total loss: FXI flat at $40 = lose entire $2.50-3.00 (100% loss)
Breakeven points:
- 📈 Upside breakeven: ~$42.50-43.00 (need 6-7% rally)
- 📉 Downside breakeven: ~$37.00-37.50 (need 6-7% drop)
CRITICAL WARNING - DO NOT attempt unless you:
- ✅ Understand IV crush mechanics and Greeks (Vega, Theta, Gamma)
- ✅ Can afford to lose ENTIRE premium
- ✅ Have traded through Chinese macro catalysts before
- ✅ Can monitor position real-time during catalyst window
- ✅ Plan to close within 24-48 hours post-announcement (don't hold to expiration)
- ⏰ Accept that "as expected" outcome = significant loss even if directionally correct
Risk level: EXTREME (can lose 100% of premium) | Skill level: Advanced only
Probability of profit: ~35% (lower than implied 50% due to IV crush and range-bound base case)
⚠️ Risk Factors
Don't get caught by these potential landmines:
-
🏚️ Property sector death spiral: Real estate investment down 14.7%, Vanke (state-backed developer) requesting debt restructuring signals contagion risk. Sector still 25% of GDP - if stabilization fails, takes entire economy down. 600M permanent buildings creating structural oversupply that can't be absorbed. Banking holdings (31.81% of FXI) face NPL recognition wave.
-
❄️ Deflationary trap deepening: Four consecutive months of declining prices, CPI only +0.2% YoY in October (first increase since June but still anemic). Consumer confidence near historic lows despite stimulus. Household savings SURGED to RMB 17.94T in H1 2025 vs 11.46T in H1 2024 - money NOT flowing to consumption! Classic liquidity trap where monetary easing ineffective.
-
👥 Youth unemployment crisis: 17.3% in October (16-24 excluding students), record 12.22M graduates entering market in 2025, job postings down 22% in H1 while seekers rose 8%. Creates social stability risk and consumption headwind as young cohort delays major purchases (property, cars, marriage).
-
🇹🇼 Taiwan conflict tail risk: China's largest naval deployment ever (100+ vessels), Japan-China diplomatic crisis, US Defense Secretary warned attack "could be imminent". Any military action = instant -30-50% FXI collapse, global financial crisis. Low probability but CATASTROPHIC impact.
-
🇺🇸 Trade war resumption risk: One-year truce expires October 2026 (within June put timeframe), current 47.5% US tariffs still elevated, December 16 USTR hearing could trigger new measures. Semiconductor export controls continuing despite rare earth détente - hurts tech holdings (Alibaba, Tencent = 18% of FXI).
-
💰 Stimulus effectiveness uncertainty: BlackRock: "Not yet enough to address drags". Fiscal impulse only 1.6% of GDP insufficient to offset property collapse (25% of economy). Previous equipment upgrade programs showed limited multiplier effects. Monetary easing hits limits when problem is solvency, not liquidity.
-
🏦 Banking sector margin compression: Net interest margins at record lows across sector, Q1 2025 ICBC/CCB profits down ~4%. Further 30bps rate cuts in 2026 will pressure profitability of 31.81% FXI financial holdings. NPL recognition from property sector exposure delayed but inevitable.
-
🐋 Smart money exiting at peak: $11.8M institutional put purchase signals sophisticated players hedging/reducing China exposure. -$2.36B ETF outflows over past year despite +9% price - investors selling into rally. When institutions buy THIS much downside protection AFTER policy pivot announcement, it's major red flag.
-
📊 Gamma ceiling at $40 creates resistance: Massive 402.3M gamma at $40 (119.1M net bullish - STRONGEST LEVEL) means dealers will systematically SELL into rallies. FXI stuck $0.13 below this ceiling - can't break through without sustained buying. Asymmetric risk: +$0.13 upside vs -$0.87 to $39 support.
-
🎢 Historical volatility warning: 39.6% max drawdown in April 2025 (from $42 to $28.41 in weeks) shows how fast FXI can collapse when sentiment shifts. Current 3.17% implied vol for monthly seems WILDLY optimistic given catalyst density and structural risks. Market may be underpricing downside scenarios.
-
📉 15th Five-Year Plan expectation mismatch: Market hopes for aggressive 6% growth targets + structural reforms. Reality likely conservative 4.5-5% targets acknowledging demographic/debt constraints. Disappointment could trigger -5-8% gap down in March 2026 (within put expiration window).
🎯 The Bottom Line
Real talk: Institutions just deployed $11.8 MILLION betting that China's "moderately loose" monetary policy WON'T fix structural problems over the next 3-6 months. This isn't a directional crash bet - it's sophisticated hedging by players who've ridden the rally from $28 to $40 and don't want to give it back.
What this trade tells us:
- 🎯 Smart money expects DOWNSIDE RISK through mid-2026 despite "biggest policy pivot in 14 years"
- 💰 They're worried enough about $40→$37-$36 scenario to pay $1.51-$2.28/share for insurance
- ⚖️ The $39 strike placement shows they expect IF FXI breaks support, it goes QUICKLY (gamma dynamics accelerate moves)
- ⏰ Two timeframes (March + June) capture: 15th Five-Year Plan, Q1 GDP, Alibaba earnings, fiscal stimulus deployment, property crisis evolution
- 📊 Z-scores of 17.46, 12.84, 6.17 = this is 6-17x MORE unusual than normal FXI activity - happens few times per year!
This is NOT a "sell China now" signal - it's a "structural problems can't be fixed with rate cuts" warning.
If you own FXI:
- ✅ Consider trimming 30-50% at $39-40 levels (lock in YTD gains, reduce risk)
- 📊 If holding, set MENTAL STOP at $38.50 (just below $39 gamma support) to protect position
- ⏰ Don't overstay the welcome - already up 9% YTD is good! Protecting profits matters more than squeezing last dollar
- 🎯 If Q1 GDP accelerates AND property stabilizes, could re-enter trimmed shares on confirmation
- 🛡️ Consider buying protective puts 1-2 per 100 shares if holding large position
If you're considering China exposure:
- ⏰ WAIT for confirmation - don't catch falling knife based on "cheap valuation" or "policy support"
- 🎯 Looking for: Q1 GDP >5%, CPI positive, retail sales >5%, property investment stabilization
- 📈 Key dates: Mid-January (Q4 GDP), February 19 (Alibaba earnings), March 2026 (15th Five-Year Plan)
- 🚀 IF stimulus works (20% probability), FXI to $44-47 is real possibility
- ⚠️ But current setup (39.6% historical drawdown, property crisis, deflation, youth unemployment) requires PROOF before commitment
If you're bearish on China:
- 🎯 The $39 puts March/June offer defined-risk way to express view
- 📊 Key support: $39 (170.6M gamma), deeper support $37 (72.8M), disaster floor $36 (44.5M)
- ⚠️ Watch for break below $38.50 - triggers cascade toward $37-36 range
- 📉 Put spreads ($39/$36) offer better risk/reward than naked puts for retail traders
- ⏰ Timing matters: Wait for catalyst confirmation (disappointing Five-Year Plan, weak Q1 GDP, property stress)
Mark your calendar - Key catalyst dates:
- 📅 December 9-10 - China CPI/PPI data (watching for deflation reversal)
- 📅 December 16 - USTR hearing on China trade compliance
- 📅 December 31 - December Manufacturing PMI
- 📅 Mid-January 2026 - Q4 2025 GDP release (consensus: deceleration to 4.5% or below)
- 📅 February 19, 2026 - Alibaba Q4 FY2025 earnings
- 📅 March 2026 - 15th Five-Year Plan unveiling (MAJOR CATALYST!)
- 📅 March 20, 2026 - March OPEX, expiration of $4.7M in puts
- 📅 June 18, 2026 - June OPEX, expiration of $7.1M in puts
Final verdict: China's structural problems (property crisis consuming 25% of GDP, deflationary trap despite stimulus, youth unemployment 17.3%, demographic decline) cannot be solved with "moderately loose" monetary policy alone. The $11.8M institutional put purchase reflects sophisticated understanding that fiscal impulse of 1.6% GDP is INSUFFICIENT to offset property collapse and consumption weakness.
FXI's risk/reward at $39.87 is UNFAVORABLE: +$0.13 upside to $40 gamma resistance vs -$3-6 downside to $37-36 if support breaks. The 55% base case (sideways chop $36-42) offers limited alpha. The 20% bull case requires PERFECT execution overcoming MASSIVE headwinds. The 25% bear case has BlackRock's "not yet enough" assessment supporting it.
Be patient. Wait for evidence. The China opportunity will still exist in 6-12 months if fundamentals improve, and you'll sleep better avoiding potential -15-25% drawdown if they don't.
This is about capital preservation, not missing out. 💪
Disclaimer: Options trading involves substantial risk of loss and is not suitable for all investors. This analysis is for educational purposes only and not financial advice. China investments carry additional risks including geopolitical tensions, regulatory changes, currency fluctuations, and limited transparency. The unusual Z-scores (17.46, 12.84, 6.17) reflect these specific trades' size relative to recent FXI history - they do not imply the trades will be profitable or that you should follow them. Always do your own research and consider consulting a licensed financial advisor before trading. Major catalysts (15th Five-Year Plan, Q1 GDP, Taiwan tensions, trade policy) create binary event risk with potential for 5-15% gaps either direction.
About iShares China Large-Cap ETF: The iShares China Large-Cap ETF provides concentrated exposure to 50 of the largest Chinese companies trading on the Hong Kong Stock Exchange, with $6.60 billion in assets under management. Top holdings include Alibaba, Tencent, China Construction Bank, and ICBC, with heavy sector allocations to Financials (31.81%), Consumer Cyclical (30.06%), and Communication Services (18.36%).