🇨🇳 Someone Just COVERED $1.8M in FXI Short Calls - Is China About to Rip?
Quick Take 🎯
Someone just bought to close 12,000 FXI June $42 calls for $1.8M - that's COVERING a short position, not opening a new one. When you see a massive BTC order like this, it means a trader who was betting against China's rally is now scrambling to close their bearish bet. With FXI trading at $38.88 and these calls over 8% out-of-the-money, this looks like either profit-taking on a successful short call position OR - more interestingly - a defensive cover ahead of potential upside catalysts. The timing is crucial: we're heading into Q1 2026 when China typically announces major policy moves.
Option Flow Breakdown 📊
Here's what crossed the tape:
| Field | Value |
|---|---|
| Trade Type | BUY TO CLOSE (closing a short call position) |
| Contracts | 12,000 FXI Jun 18 2026 $42 calls |
| Premium | $1.8M total notional |
| Underlying Price | $38.88 |
| Strike Distance | +8% OTM |
| Time to Expiration | 174 days (6 months) |
| Strategy | Close Short Call |
What This Means: Someone originally sold these calls (bearish bet or covered call strategy) and is now buying them back to close the position. The question is WHY now? Two scenarios:
- Profit-taking: They sold at higher IV or FXI was lower, now covering cheaply
- Risk management: They're worried about upcoming catalysts and want to eliminate upside risk
The $1.8M premium on a BTC suggests this was a sophisticated institutional player managing a larger position. At 12,000 contracts, this controls $50.4M worth of FXI shares at the $42 strike - not exactly retail size.
Technical Setup 📈
YTD Performance: The China Rally Is Real
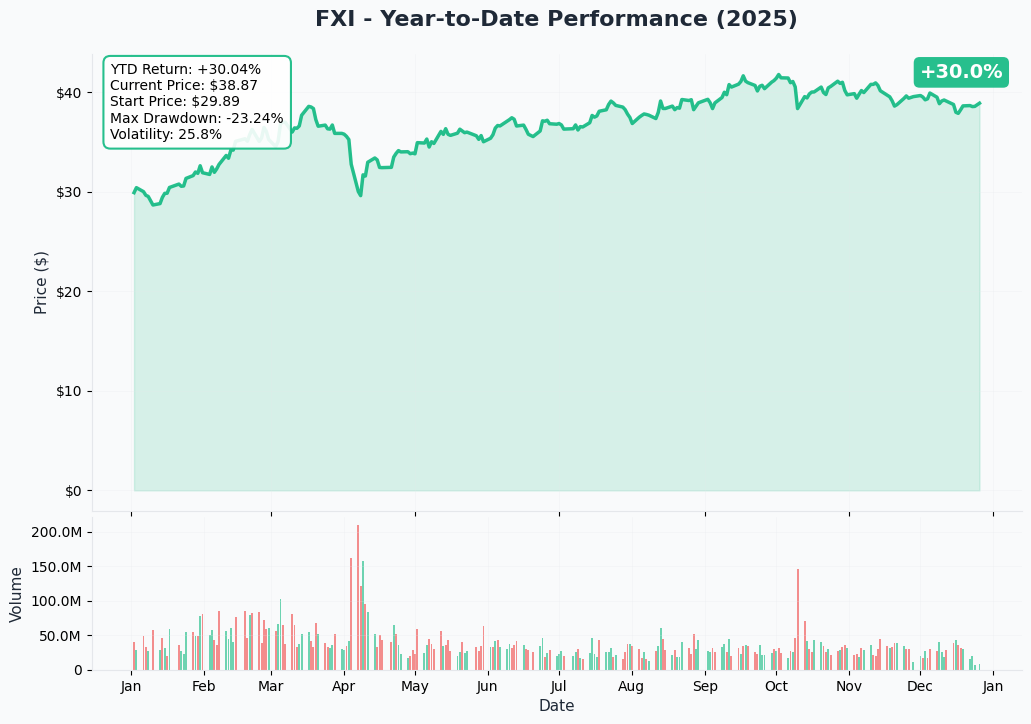
FXI has crushed it in 2024-2025, up 26.33% YTD despite all the doom and gloom about Chinese markets (Yahoo Finance, Dec 24, 2025). The chart shows a clean recovery from the $28-30 lows in early 2024 to the current $38-39 range, with a 52-week high at $42 - exactly where these calls are struck.
Key observation: The fact that someone is covering short $42 calls when FXI is sitting at $38.88 suggests they're not willing to risk the stock testing those highs again. We've seen $42 before, and with China stimulus ramping up, it's not crazy to think we could revisit it.
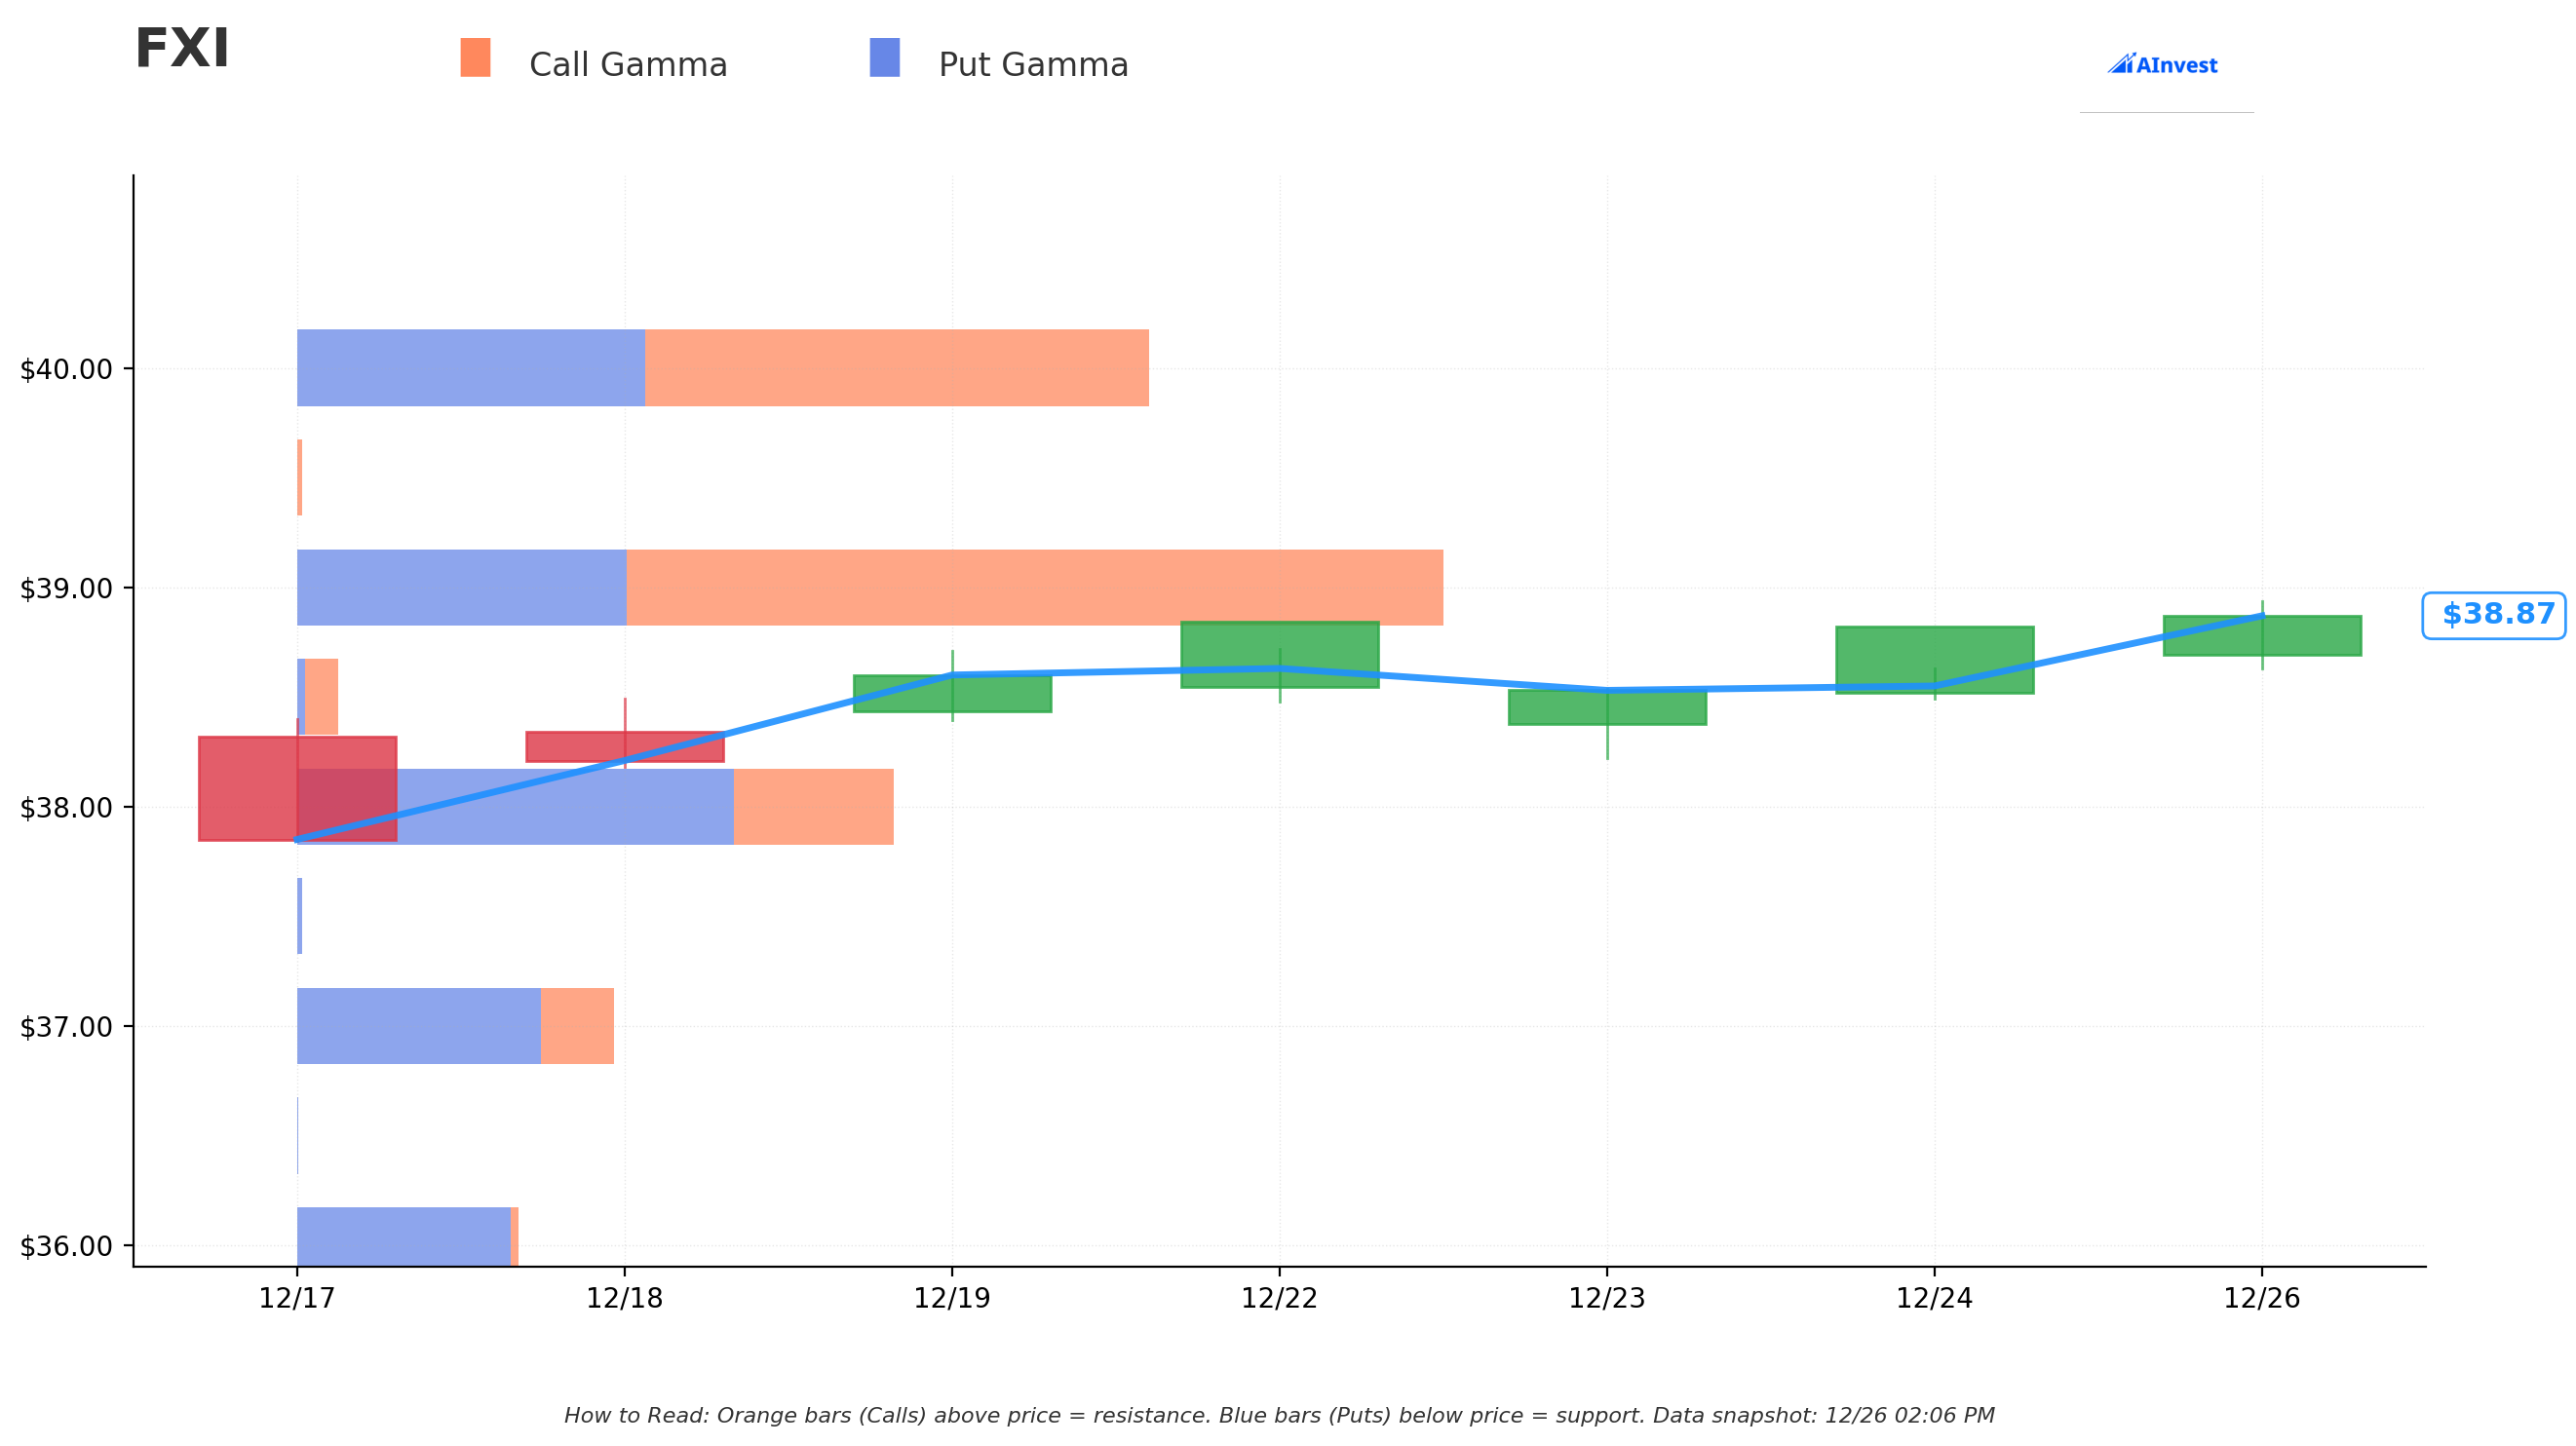
Gamma Analysis: The $39 Magnet
The gamma exposure data reveals FXI's key battlegrounds:
Call Gamma (Resistance):
- $39.00 (total gamma: 9.17) - THE major level, twice the size of anything else
- $38.00 (total gamma: 5.18) - just defended this week
- $40.00 (total gamma: 4.72) - psychological barrier and round number
Put Gamma (Support):
- $37.00 (total gamma: 3.25) - downside protection level
- $39.50 (total gamma: 3.01) - interesting, this is actually a put-heavy level
- $36.00 (total gamma: 2.44) - last line of defense
The Setup: We're trapped between massive gamma at $38 (support) and $39 (resistance). The $39 strike has nearly 10 points of total gamma, making it a gravity well. Dealers are likely short gamma here, meaning if we break above $39, they'll need to buy stock to hedge, creating potential acceleration toward $40-$42.
This BTC at the $42 strike makes sense - that's where the next gamma cluster sits, and someone doesn't want to be short calls if we squeeze through $39-$40.
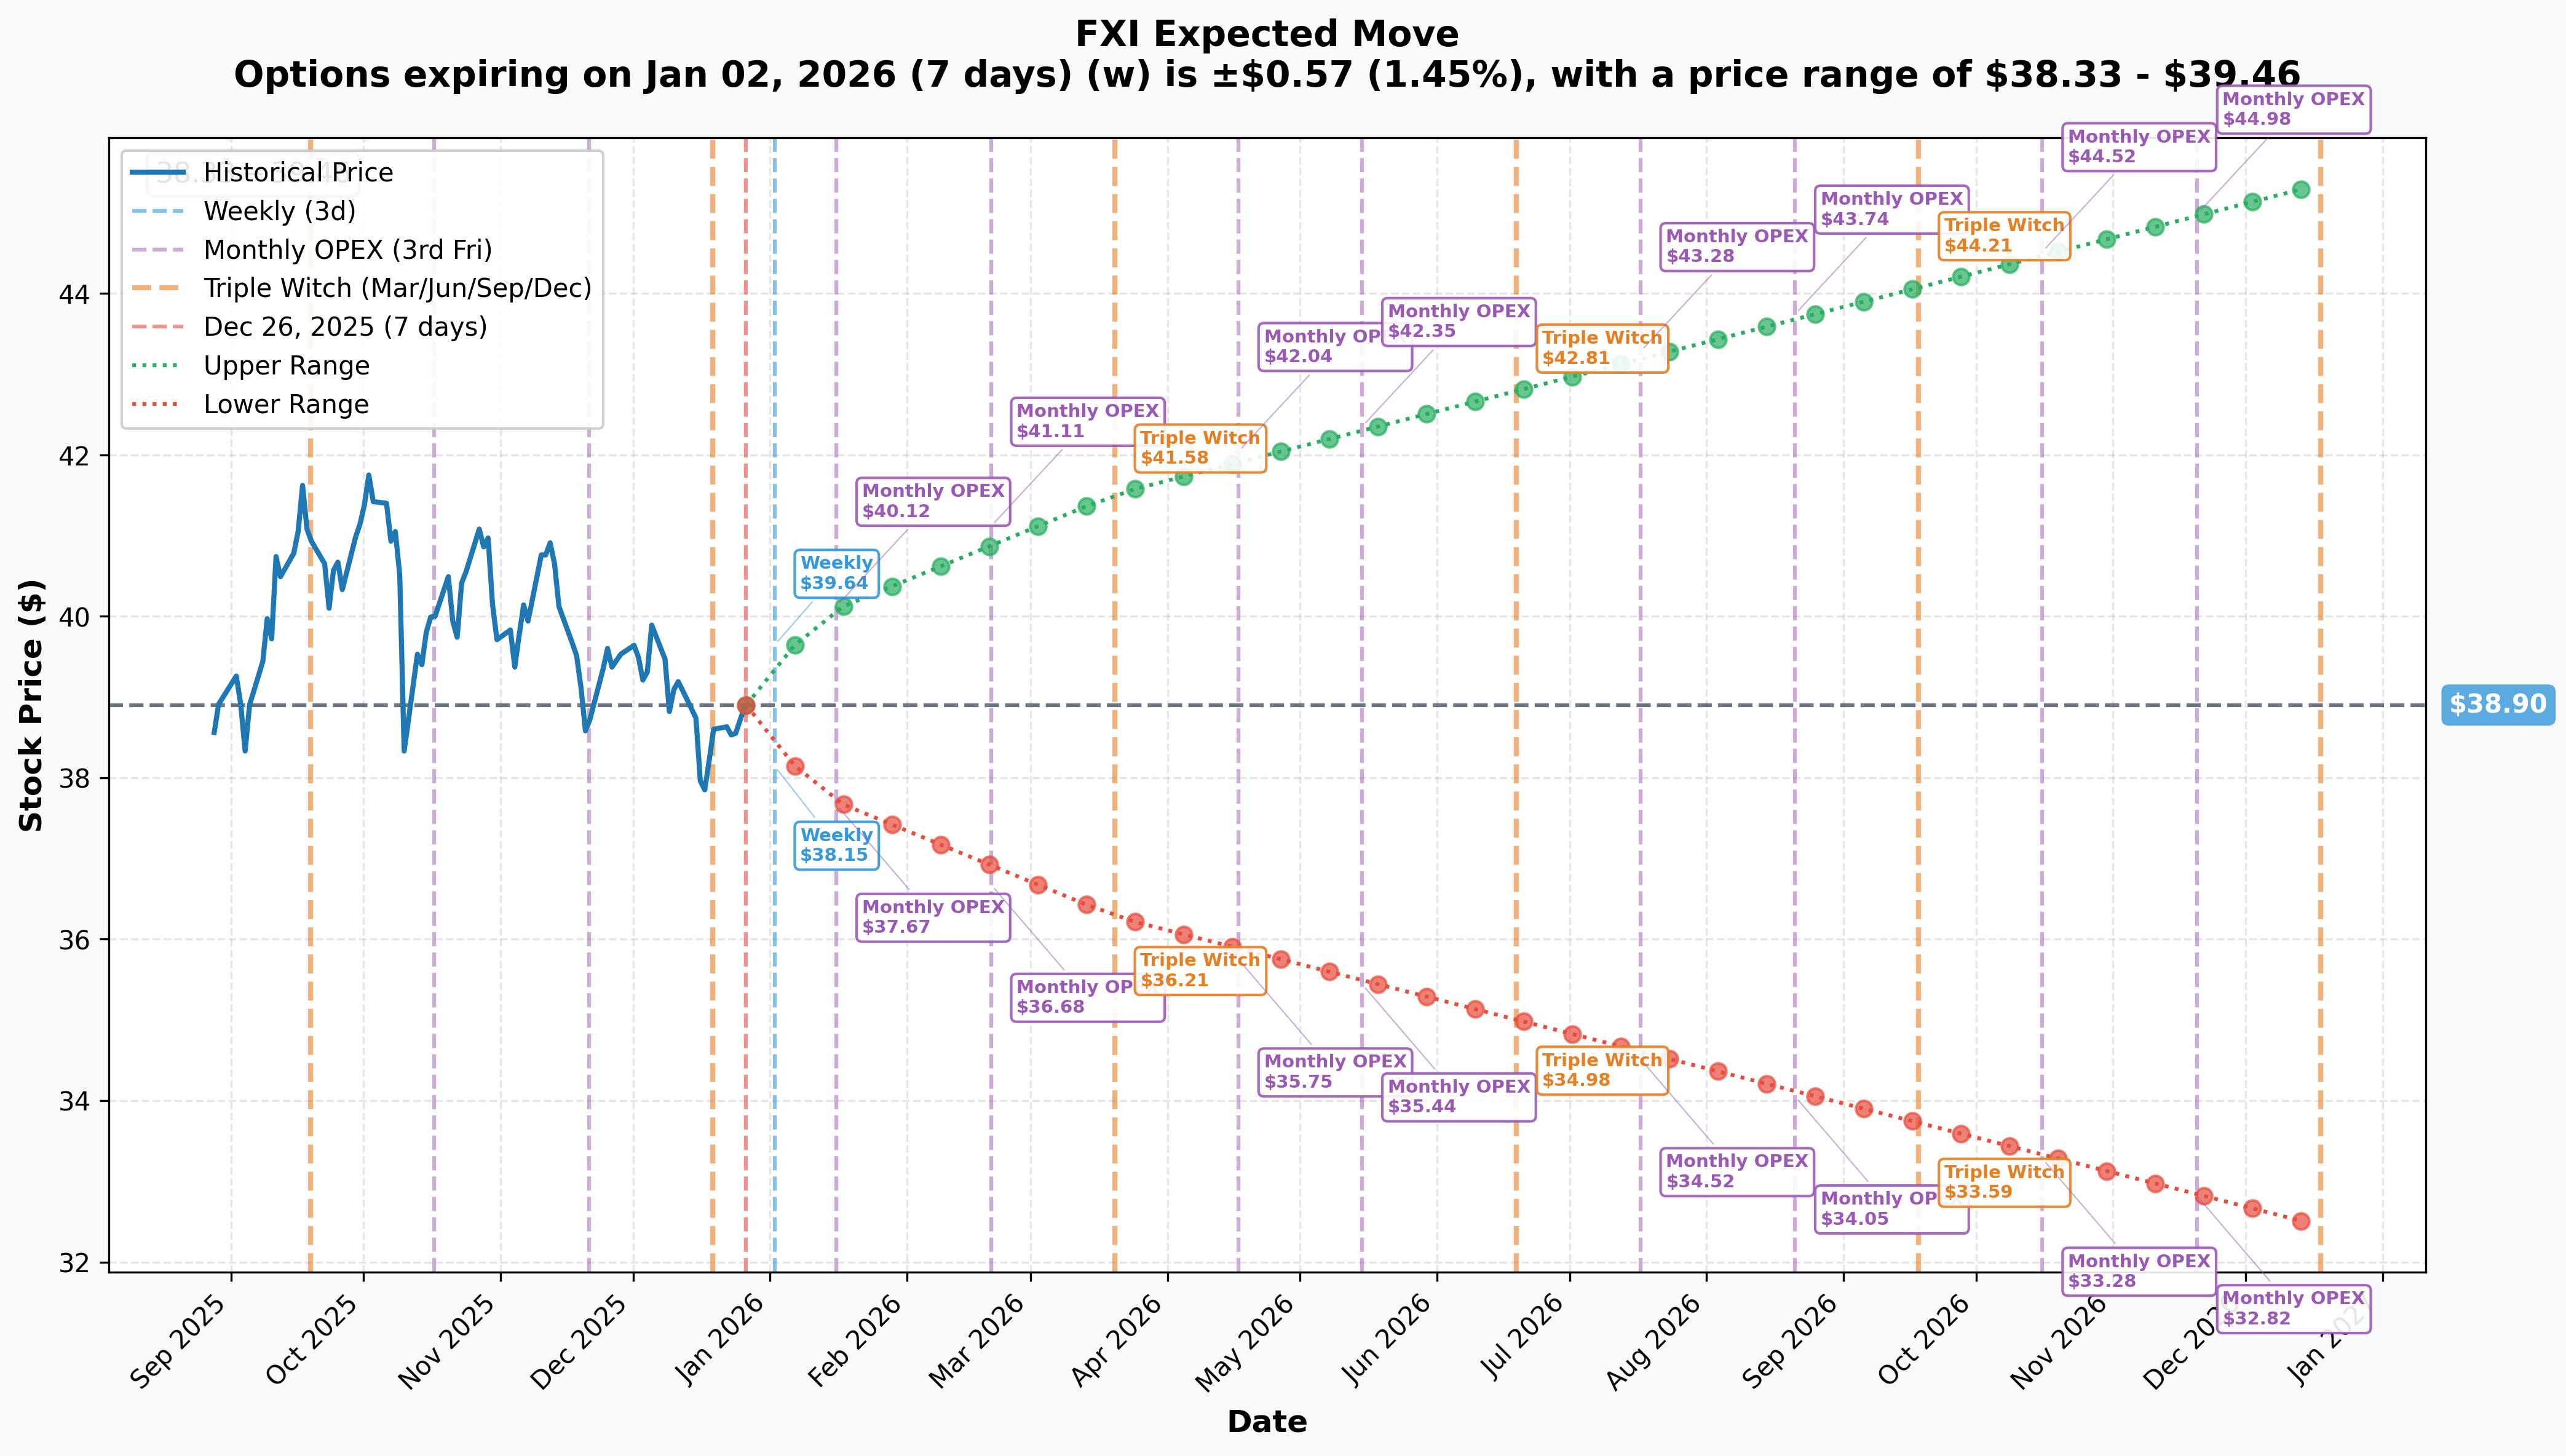
Implied Move: What Options Are Pricing
The options market is telling us where FXI is expected to move by key dates:
- Weekly (Jan 2): ±1.45% ($38.33 - $39.46) - encompasses our gamma resistance
- Monthly OPEX (Jan 16): ±3.09% ($37.69 - $40.10) - this is when Two Sessions announcements typically drop hints
- Quarterly Triple Witch (Mar 20): ±6.75% ($36.27 - $41.52) - RIGHT after Two Sessions (early March)
- Through June expiry: ±16.61% yearly ($32.44 - $45.36) - our $42 calls fit within normal expectations
Critical insight: The March quarterly expiry implies a move to $41.52 on the high end - just shy of the $42 strike. If this trader thought FXI was stuck below $40, they wouldn't bother covering. The fact they're closing this position with 6 months to go suggests they're not comfortable holding through the Q1 2026 catalyst gauntlet.
Catalysts 🚀
Recent Tailwinds (Why China Pumped 26% This Year)
1. Beijing's Historic Policy Pivot (December 11-12, 2024) China announced "moderately loose" monetary policy for the first time in 14 years - this is HUGE. The Central Economic Work Conference (CEWC) raised the fiscal deficit target to 4% of GDP (from 3%) and doubled ultra-long-term special government bonds to RMB 2 trillion ($275B). Translation: Beijing is DONE playing around with incremental measures.
2. DeepSeek AI Breakthrough (January 2025) Chinese AI startup DeepSeek revealed its R1 model operating at $5.6M vs. hundreds of millions for US competitors, triggering a global reassessment of Chinese tech. Alibaba (10.32% of FXI) surged 70% YTD, Tencent (9.08% of FXI) up 30%. Morgan Stanley noted investors are "starting to reassess China's investability" in AI/tech.
3. Alibaba's Regulatory Freedom (August 30, 2024) SAMR announced Alibaba completed its three-year rectification, ending the government crackdown that started with the 2021 RMB 18.2B fine. Q3 2024 earnings: revenue +8% YoY, net profit surged 339%, cloud AI revenue hit triple-digit growth for the 6th straight quarter.
4. Manufacturing Strength December PMI hit 50.1 (third consecutive month of expansion), with Q4 averaging 50.2 vs Q3's 49.4. November Caixin PMI reached 51.5 (highest since June), driven by pre-tariff export orders.
5. Yuan Strength CNY/USD at 7.0059 (15-month high), up 4.17% YTD. Stronger yuan = easier monetary policy = supports equity valuations.
Upcoming Catalysts (Next 3-6 Months)
January-March 2026: PBOC Rate Cuts Expected Goldman Sachs forecasts two 20bp rate cuts and two 50bp RRR cuts in 2025. PBOC reiterated rates will be cut "at appropriate time" in January statement. If cuts come in Q1, FXI could rally hard.
January 20, 2025: Country Garden Liquidation Hearing $205B debt, postponed from July. Resolution could remove a major overhang on Chinese financials (28% of FXI is banks).
March 2026: Two Sessions Policy Announcements This is THE major annual policy event. 2025 Two Sessions set 5% GDP target and 4% fiscal deficit. Expect announcements on stimulus expansion, trade-in programs, and AI initiatives. Markets typically rally into and through this event.
Ongoing: Alibaba's $53B AI Investment $53B deployment over three years in AI/cloud infrastructure. As the top FXI holding (10.32%), this directly impacts ETF performance.
Risk Factors (The Bear Case) ⚠️
1. Deflation Persists December CPI at just 0.1% YoY, producer prices fell 2.3%. This is the fourth consecutive monthly CPI decline - stimulus hasn't fixed demand weakness yet.
2. Property Crisis Ongoing Evergrande delisted (owing >$300B), Vanke posted record RMB 49.5B loss for 2024, national housing sales down 14.1% YoY. Property is still 25% of GDP.
3. Tariff Uncertainty Current US tariffs at 47.5% despite May 2025 truce. Trump 2.0 could restart escalation, especially with chip restrictions still in place.
4. Fund Outflows Despite +26% YTD gains, FXI saw $2.36B in net outflows over 12 months. Institutional skepticism remains high.
Price Targets & Probabilities 🎲
Based on gamma levels and implied move analysis:
Bull Case (30% probability):
- Target: $42.00 (the covered strike)
- Timeframe: By March 20, 2026 Triple Witch
- Rationale: PBOC rate cuts + Two Sessions stimulus + gamma squeeze above $39
- Resistance path: $39 (massive gamma) → $40 (psychological) → $42 (52-week high)
Base Case (50% probability):
- Target: $39.50 - $40.50
- Timeframe: Next 3 months
- Rationale: Gradual grind higher on improving sentiment, stuck below major $42 resistance
- Matches: Monthly OPEX implied move upper range ($40.10)
Bear Case (20% probability):
- Target: $36.00 - $37.00
- Timeframe: If deflation worsens or tariffs escalate
- Rationale: Property crisis contagion, stimulus disappoints
- Support: Put gamma at $37 should provide a floor
What The BTC Tells Us: Someone managing serious size just eliminated their upside risk. They're either booking profits OR - more tellingly - they see enough risk of a move above $40 that holding short calls isn't worth the premium anymore. This wasn't a routine adjustment.
Trading Ideas 💡
Conservative: Defined Risk Bullish Spread
Setup: Buy FXI Jan 16 $39/$41 call spread
- Cost: ~$0.60-0.70 debit per spread
- Max Gain: $1.30-1.40 (185% return if FXI > $41 by Jan OPEX)
- Max Loss: Premium paid
- Breakeven: ~$39.65
- Rationale: Positioned for a grind to $40 through Two Sessions hints. Limited risk, aligned with monthly implied move upper range ($40.10).
Balanced: March Quarterly Calls
Setup: Buy FXI Mar 20 $40 calls
- Cost: ~$0.90-1.10 per contract
- Target: $42-43 by March Triple Witch
- Breakeven: ~$41.00
- Rationale: Gives you exposure through Two Sessions (early March) and PBOC rate cuts. If we get a gamma squeeze above $39, this is positioned to capture acceleration to $42. The implied move shows $41.52 is within one standard deviation.
Aggressive: Replicate The Covered Trade
Setup: Buy FXI June 18 $42 calls (the exact strike that was covered)
- Current Price: Estimate ~$0.80-1.00 per contract
- Logic: Someone just paid $1.8M to close this exact position. If they're worried about a move to $42+, why not go long the same strike?
- Risk: 6 months of theta decay, needs FXI > $43 to profit meaningfully
- Reward: If China rips on massive stimulus, 8% OTM calls can 3-5x
Hedged Approach: Bull Put Spread
Setup: Sell FXI Jan 16 $37/$35 put spread
- Credit: ~$0.40-0.50 received
- Max Gain: Premium received (25% return on capital in 3 weeks)
- Max Risk: $1.50-1.60 if FXI < $35
- Rationale: Profit if FXI stays above $37 (current put gamma support). Use premium to fund call spreads.
Bottom Line 🎬
This $1.8M buy-to-close of FXI June $42 calls is a significant defensive move by someone who doesn't want to be short China into Q1 2026. The timing aligns perfectly with:
- Expected PBOC rate cuts (Q1)
- Two Sessions policy announcements (March)
- Country Garden resolution (January 20)
- Alibaba's accelerating AI deployment
The Setup Is Compelling: FXI at $38.88 with massive gamma resistance at $39, facing a catalyst-rich Q1, and someone just covered $50M+ worth of upside exposure. That's not random.
The Risk Is Real: Deflation at 0.1%, property crisis unresolved, $2.36B in fund outflows despite gains. China has disappointed before.
My Take: Use defined risk strategies. If you're bullish, the Jan-March call spreads offer asymmetric risk/reward aligned with the catalyst timeline. If you want to fade the rally, wait for a move above $40 to sell premium into elevated IV. But don't ignore what this BTC is signaling - sophisticated money just eliminated their bearish exposure, and they don't do that for fun.
Position Sizing: This is China - volatility can spike fast. Risk no more than 1-2% of portfolio on any single idea. Consider this a tactical trade, not a long-term hold.
Disclaimer: This analysis is for informational purposes only and does not constitute investment advice. Options trading involves substantial risk of loss. The author may hold positions in securities discussed. Always conduct your own due diligence and consult with a financial advisor before making investment decisions.
🔗 Additional Resources
Close Short Call: Chart Analysis - $42 Strike, Jun 2026 Expiry
Full ETF Analysis: FXI Deep Dive
Data Sources:
- Trade Flow: Proprietary options flow scanner
- Gamma Analysis: Real-time GEX data aggregator
- Implied Move: Options volatility surface calculations
- Catalyst Research: See embedded citations throughout
- Charts: Generated from live market data as of December 26, 2025