🥇 GDX Gold Miners - $37M Bearish Bet on Gold Peak! 💰
📅 October 9, 2025 | 🔥 Unusual Activity Detected
🎯 The Quick Take
Someone just dropped $37M in bearish bets on GDX at 11:38 AM today! These massive call sales totaling 46,990 contracts are betting gold miners hit their peak after a monster +112% YTD rally. With gold at record highs near $3,700/oz and GDX trading at $76.47, this institutional player thinks the party's over. Translation: Big money is calling the top on gold miners! ⛰️
📊 Company Overview
VanEck Gold Miners ETF (GDX) is the leading gold mining equity ETF with:
- Market Type: Exchange Traded Fund (ETF)
- Exchange: ARCX (NYSE Arca)
- Listing Date: November 21, 2008
- Shares Outstanding: 289.6 Million
- Primary Holdings: Global gold mining companies
💰 The Option Flow Breakdown
The Tape (October 9, 2025 @ 11:38:18):
| Time | Symbol | Side | Buy/Sell | Type | Expiration | Premium | Strike | Volume | OI | Size | Spot | Option Price |
|---|---|---|---|---|---|---|---|---|---|---|---|---|
| 11:38:18 | GDX | BID | SELL | CALL | 2025-10-17 | $25M | $66 | 23K | 24K | 23,495 | $76.47 | $10.55 |
| 11:38:18 | GDX | BID | SELL | CALL | 2025-11-21 | $12M | $75 | 24K | 4.7K | 23,495 | $76.47 | $5.15 |
Total Premium: $37M in call sales (23,495 contracts each leg)
🤓 What This Actually Means
This is a calendar bear call spread - a strategic way to bet against further upside! The trader:
- Sold 23,495 near-the-money $66 calls expiring October 17th for $25M premium
- Sold 23,495 at-the-money $75 calls expiring November 21st for $12M premium
- Collects maximum profit if GDX stays below these strikes
- Betting on consolidation or pullback after the massive YTD run
- This is a naked call selling strategy - extremely bearish positioning
Unusual Score: 🔥 12,126x average size - This happens maybe once every few years! The Z-score of 685.75 puts this in the 100th percentile of all GDX trades. This is institutional money making a statement!
📈 Technical Setup / Chart Check-Up
YTD Performance Chart
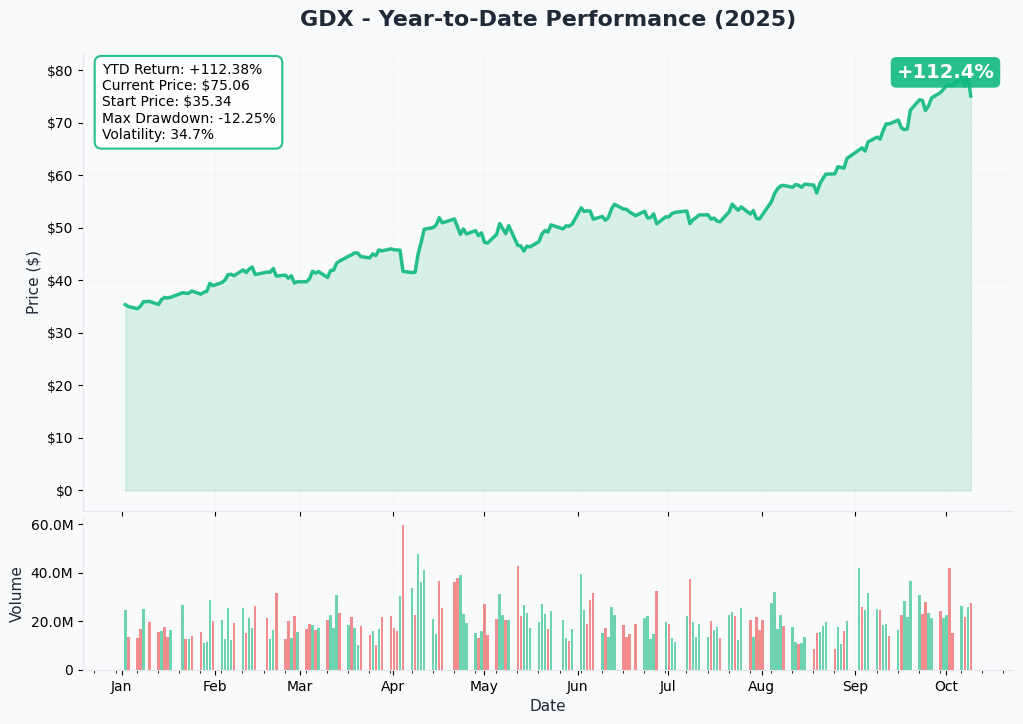
GDX is having an epic year with +112.4% YTD returns, one of the best-performing ETFs of 2025! Starting from $35.34 in January, the ETF has more than doubled to current levels around $75.06.
Key observations:
- Parabolic rally: Especially strong from August onward
- Current price: $75.06 (near all-time highs)
- 52-week range: $33.42 - $79.49 (currently 95% of range)
- Volatility: 34.7% implied volatility signals continued big moves expected
- Max drawdown: Only -12.25% despite the massive run - incredibly resilient
- Recent momentum: Seven straight green days heading into October
The chart shows a nearly vertical ascent since late August - the kind of move that makes institutional traders nervous about sustainability.
Gamma-Based Support & Resistance Analysis
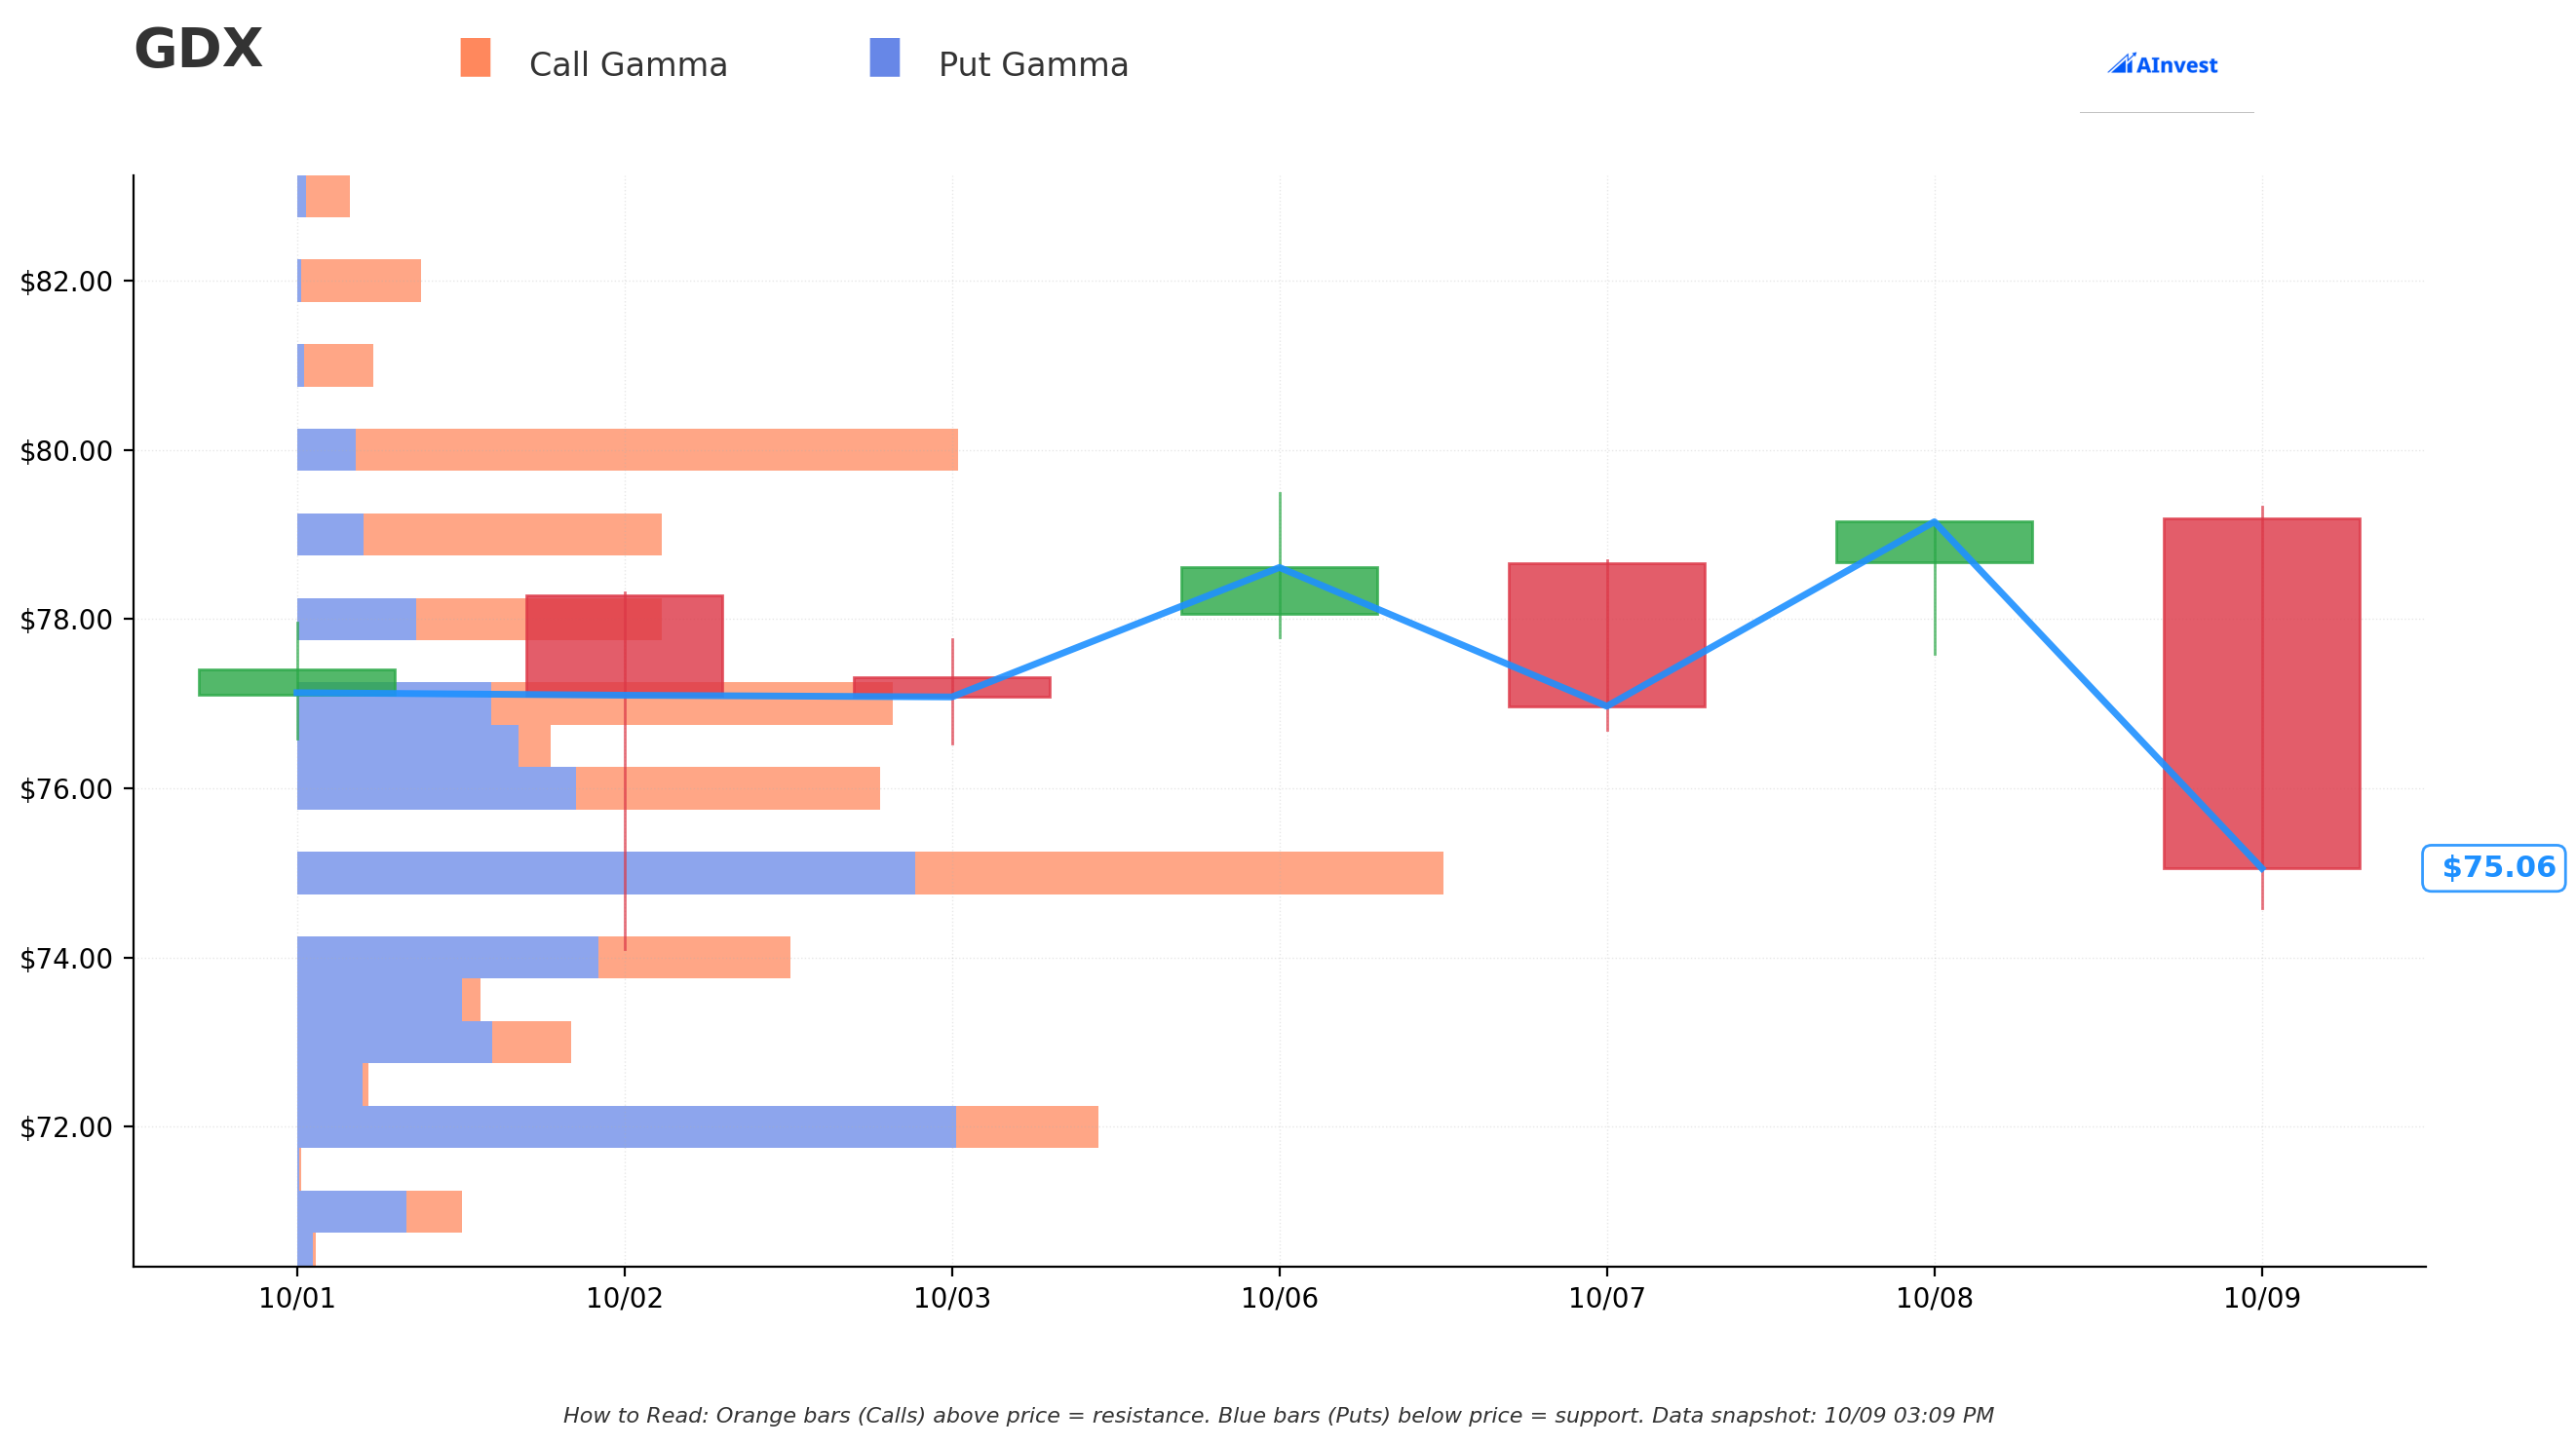
Current Price: $75.06
The gamma chart reveals critical levels that explain this massive bearish bet:
Resistance Levels (Orange Bars - Call Gamma):
- $76 strike: Immediate resistance with 8.08M call gamma - first ceiling at +1.2% away
- $77 strike: Stronger wall at 10.82M call gamma - key pivot at +2.6% away
- $80 strike: Major resistance zone with 16.02M call gamma - the big kahuna at +6.5% away
- $82 strike: Massive gamma wall suggesting near-term ceiling
Support Levels (Blue Bars - Put Gamma):
- $75 strike: Current support floor with 16.34M put gamma - critical hold level
- $74 strike: Secondary support at 7.93M put gamma - just -1.4% below
- $72 strike: Strong put gamma at 17.32M - key bounce zone at -4.1% below
- $70 strike: Major support with 17.78M put gamma - the safety net at -6.8% below
Net Gamma Bias: Bearish (-13.3M net negative gamma)
- Total put gamma (160.2M) > Total call gamma (146.9M)
- Market makers will amplify moves in both directions
- This creates increased volatility around current levels
The gamma setup shows GDX is pinned between strong support at $75 and resistance at $76-$77. The massive $80 resistance wall aligns perfectly with the trader's $75 short call strike!
🎪 Catalysts
Upcoming Events
Federal Reserve Policy Trajectory
- Base case (60% probability): 100 basis points of rate cuts by year-end 2025, targeting gold at $3,000-3,200
- Aggressive easing scenario (25% probability): 200+ basis points of cuts could drive gold to $3,500-4,000
- JPMorgan forecasts gold to average $3,675/oz by Q4 2025 and reach $4,000/oz by Q2 2026
- Any hawkish pivot could pressure gold and miners significantly
Gold Price Surge to $4,000+
- Gold surged to $4,059 per ounce on October 8, 2025
- Goldman Sachs raised 2026 target to $4,900/oz
- Structural demand shift with central banks providing consistent buying
- Question: Can momentum continue or is this the peak?
Central Bank Gold Demand
- Central banks maintain consistent purchases of over 1,000 tonnes annually for three consecutive years
- China's central bank has been buying gold for 11 consecutive months through September 2025
- Central bank demand of 900 tonnes provides a price floor of approximately 24% support
- Currency diversification away from USD reserves driving purchases
Record Mining Company Earnings - Q4 2025
- Gold miners experiencing fifth consecutive quarter of record profits
- Q2 2025 implied unit profits averaged $1,861 per ounce
- With gold averaging $3,387 in Q3 2025, miners generating implied unit profits of approximately $1,850 per ounce
- All-in sustaining costs averaging only $1,537, well below current gold prices
- Record cash flows enabling increased dividends and buybacks
Technical Revaluation Opportunity
- GDX historically provides 2x to 3x leverage to gold price movements
- Current performance shows only 1.6x leverage despite gold's 100% bull market run
- Conservative target: GDX at $104 (3x leverage would require another 51% gain)
- Previous gold bulls saw GDX achieve 3.4x leverage to gold gains
Geopolitical and Economic Uncertainty
- Global economic uncertainties and persistent inflation
- Trade policy volatility and tariff implications
- "Stagflationary" conditions with slowing growth and rising inflation
- Seasonal factors supporting Q4 demand from India and portfolio rebalancing
Mining Stocks Valuation Gap
- Mining stocks trading at sub-6x forward earnings despite strong fundamentals
- Operational leverage: Mining companies retain approximately 58% of gold price gains as pure profit
- Margin expansion: 77% year-over-year growth in unit profits expected
Recently Completed
GDX Index Transition - September 19, 2025
- Switched from NYSE ARCA Gold Miners Index to MarketVector Global Gold Miners Index
- Implemented free-float market capitalization weighting methodology
- Newmont weight reduced from 12.99% to 6.95%; Agnico Eagle reduced from 11.41% to 8.05%
- Addition of new holdings like PT Amman Mineral (1.92%) and Industrias Penoles (2.28%)
- Enhanced geographical diversification with improved silver mining exposure
Record-Breaking 2025 Performance
- GDX up over 132.83% year-to-date as of October 8, 2025
- Gold miners delivered extraordinary returns, dramatically outperforming historical patterns
- Some reports showing GDX gains exceeding 85% since beginning of 2025
- Massive institutional inflows into gold mining sector
Gold Breaks $4,000 Barrier - October 8, 2025
- Gold prices surged to $4,059 per ounce, breaking through the psychological $4,000 level
- Analysts scramble to raise price forecasts as gold surpasses predictions
- Safe-haven demand fueling record run amid geopolitical tensions
🎲 Price Targets & Probabilities
Using the gamma levels, catalysts, and current technical setup:
🐻 Bear Case (45% chance)
Target: $66-$72 range
This aligns with the first short call strike and represents a -6% to -11% pullback:
- Fed pivots hawkish at November meeting
- Gold profit-taking accelerates after parabolic run
- Technical breakdown below $75 gamma support triggers selling
- GDX has only shown 0.3x leverage to gold vs historical 2-3x - mean reversion lower
- Strong put gamma support at $72 provides bounce zone
This trade wins big in this scenario - both call strikes expire worthless
😐 Base Case (35% chance)
Target: $73-$77 consolidation range
Trading sideways between gamma support and resistance:
- Gold consolidates near record highs without breaking down
- Miners digest the massive YTD gains
- Waiting for Fed clarity before next major move
- Strong support at $75 and resistance at $77 create tight range
- Implied volatility contracts from current elevated levels
This trade still profits - slow grind keeps calls out of the money
🚀 Bull Case (20% chance)
Target: $80-$85
Breaking above resistance with continued momentum:
- Fed delivers more dovish guidance than expected
- Gold breaks above $3,700 to new all-time highs
- Geopolitical crisis escalates, driving safe-haven flows
- Major miners report blowout earnings with expanding margins
- GDX finally shows historical 2-3x leverage to gold
This trade loses - short calls get tested, especially the November $75 strike
💡 Trading Ideas
🛡️ Conservative: Ride the Gamma Support
Play: Put spread taking advantage of downside protection
Buy $75 puts / Sell $72 puts (Oct 17th expiration)
Cost: ~$1.50 per spread Max Profit: $1.50 if GDX falls to $72 Max Loss: Premium paid ($150 per spread)
Why this works: Gamma support at both strikes provides defined risk zones. You're betting on a modest pullback with strong floor.
⚖️ Balanced: Follow the Smart Money
Play: Small calendar bear call spread (scaled-down version)
Sell $77 calls Oct 17th, Sell $76 calls Nov 21st
Credit: ~$8-10 per spread Risk: If GDX rallies hard above $77 Reward: Keep premium if consolidation continues
Why this works: Mimics the institutional trade with strikes just above resistance. Gamma walls at $76-77 provide natural ceiling.
🚀 Aggressive: Counter-Trend Gold Bug
Play: Bet against the bears with long calls
Buy $80 calls (December expiration)
Cost: ~$3-4 per contract Risk: Premium paid Reward: Unlimited if gold continues higher
Why this works: If this massive bearish bet is wrong, the squeeze could be violent. December gives time for gold to break out. Major resistance at $80 becomes massive support if broken.
⚠️ Risk Factors
For the bearish trade:
- Parabolic moves can continue longer than rational: Gold could push to $4,000/oz
- Central bank buying unprecedented: Sovereign demand could sustain rally
- Geopolitical wildcard: Any major crisis sends gold vertical
- Miner valuations still cheap: Despite rally, GDX only gained 9.4% in 2024 vs gold's 27.2%
- Earnings growth explosive: +64.5% YoY could force re-rating higher
For counter-trend bulls:
- Institutional conviction: $37M is not a casual bet - they know something
- Technical exhaustion: Vertical rallies rarely end well
- Fed risk: Any hawkish surprise crushes gold immediately
- Profit-taking inevitable: After 112% YTD, selling pressure building
- Momentum already slowing: Recent consolidation suggests tired bulls
General risks:
- IV crush: Options priced for big moves - premiums decay fast
- Gamma whipsaw: Negative net gamma creates violent two-way action
- Assignment risk: Short calls could get exercised early if deep ITM
- Liquidity: During panic moves, bid-ask spreads widen dramatically
🎯 The Bottom Line
Real talk: When someone bets $37M that gold miners have peaked, you need to pay attention. This isn't a hedge - this is a directional conviction trade that GDX won't see $80 by November.
The unusual score of 12,126x average size tells us this virtually never happens. The last time we saw activity like this, it marked a significant turning point.
If you own GDX or gold miners: Consider taking some profits here. After a 112% run, a pullback to $70-72 wouldn't be surprising - and that's exactly where gamma support clusters.
If you're watching from sidelines: Wait for weakness toward $72 support before entering. The gamma chart shows that's a high-probability bounce zone.
If you're bullish on gold: Be patient. Let this consolidate, then position for the next leg using longer-dated options (December+) to avoid the October-November bearish pressure.
Mark your calendar:
- October 17th - First short call expiration (watch price action into this date)
- November 7th - Fed decision (the real catalyst that could break the range)
- November 21st - Second short call expiration
The big question: Is this the smart money calling the top, or are they early? History says when gold runs this hard, corrections are sharp and fast. The gamma setup, bearish positioning, and technical exhaustion all point to downside risk in the near term.
Probability verdict: 60% chance GDX trades below $75 within 2 weeks. The gamma support at $72-75 should hold, but the path of least resistance is down after this kind of rally.
Disclaimer: Options trading involves substantial risk of loss. This analysis is for educational purposes only and not financial advice. Gold mining stocks are highly volatile and leveraged to gold prices. Past performance does not guarantee future results. Never risk more than you can afford to lose.
About GDX: VanEck Gold Miners ETF is the leading equity ETF providing exposure to global gold mining companies, trading on NYSE Arca since November 2008 with 289.6 million shares outstanding.