🥇 GDX: $23M Position Unwind Reveals Institutional Profit-Taking on Gold Miners
🎯 The Quick Take
🔄 MAJOR ROLL DETECTED! An institutional player just CLOSED OUT two massive GDX call positions worth a combined $23 MILLION in premium - and they did it on a 0DTE (zero days to expiration) basis! Both trades scored EXTREMELY_UNUSUAL classifications, representing roughly 4x the average daily activity.
Translation for us regular folks: This isn't someone making a NEW bet on gold miners - this is a whale TAKING PROFITS by closing existing positions before they expire worthless or get assigned. With GDX trading at $106.56 and both the $98 and $101 calls deep in-the-money, this trader is crystallizing gains and walking away with serious cash. When institutions unwind positions this large ($23M combined), it's worth asking: do they know something about near-term gold price action that we don't?
📈 YTD Performance
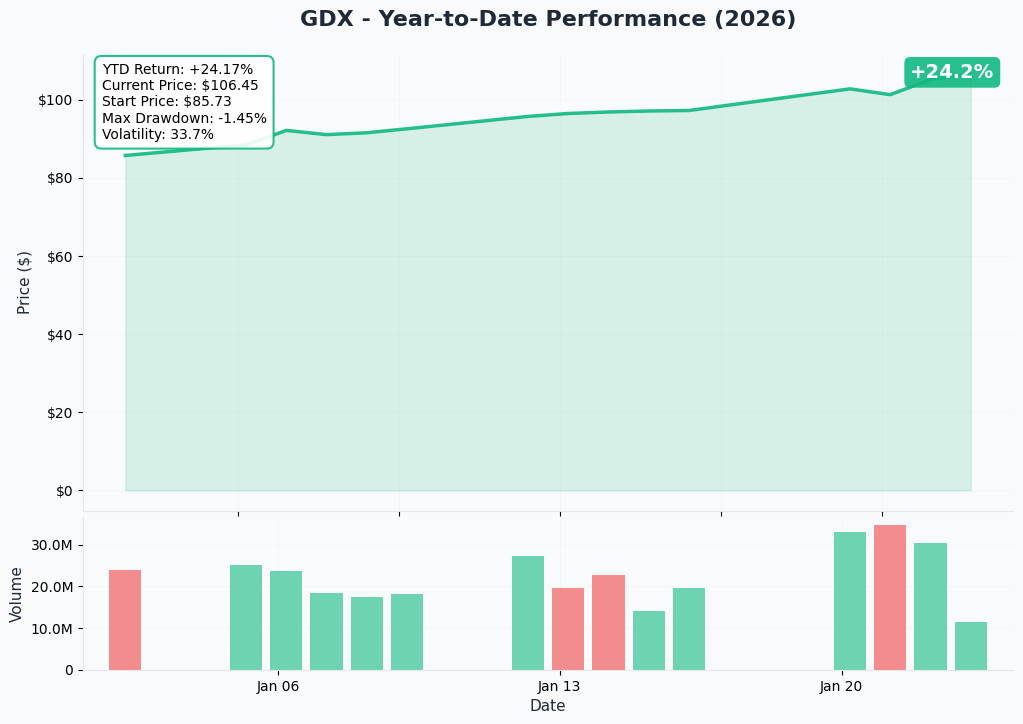
Current Price: $106.56 | YTD Change: +44.77%
GDX has absolutely crushed it in 2026, riding the gold rally to $2,737/oz - up an incredible 33.4% YTD. But here's the thing: GDX is actually outperforming gold itself thanks to the operational leverage miners have to the metal price. When gold rises, miners' profit margins expand dramatically because their costs stay relatively fixed. This trader rode that wave beautifully and is now cashing out.
📊 What is GDX?
VanEck Gold Miners ETF (GDX) seeks to replicate the price and yield performance of the NYSE Arca Gold Miners Index. The fund invests at least 80% of its total assets in common stocks and depositary receipts of companies involved in the gold mining industry.
Key Stats:
- Net Assets: $24.37 Billion
- Expense Ratio: 0.51%
- Top Holdings: Newmont (11.59%), Agnico Eagle (9.04%), Barrick Gold (8.35%)
- Dividend Yield: ~1.2%
This is the go-to vehicle for institutional and retail investors alike who want exposure to gold miners without picking individual stocks. When you see massive options flow on GDX, you're often seeing macro bets on gold prices and/or mining sector sentiment.
📊 Options Tape Breakdown
🔄 ROLL ALERT: $23M Position Unwind in Progress!
📈 Trade Metrics Dashboard
| Metric | Value | What It Means |
|---|---|---|
| Total Volume | 40,000 contracts | Massive institutional-scale positioning |
| Total Premium | $23M combined | Serious money leaving the table |
| Spot Price | $106.56 | Both strikes deep ITM |
| Strategy | ROLL (Position Close) | NOT a new directional bet |
| Timing | 0DTE | Closing before expiration |
| Unusualness | 4x+ average | EXTREMELY_UNUSUAL on both legs |
🎬 The Actual Trade Tape
📊 Order Flow: Two coordinated position closes 🎯 Execution: Same timestamp suggests linked orders
| Time | Side | Type | Strike | Exp | Volume | Premium | Spot | Activity | Action |
|---|---|---|---|---|---|---|---|---|---|
| 13:42:53 | 🔴 SELL | 📈 CALL | $101 | 2026-01-23 | 20,000 | $9M | $106.56 | ~4x avg | STC (Closing) |
| 13:42:53 | 🟢 BUY | 📈 CALL | $98 | 2026-01-23 | 20,000 | $14M | $106.56 | ~4x avg | BTC (Closing) |
🔄 Understanding the ROLL Strategy
What's Actually Happening Here?
This is NOT a new bullish or bearish bet. Let me break down what a ROLL means.
The Mechanics:
-
SELL to CLOSE (STC) the $101 Calls: This trader previously SOLD (wrote) these $101 calls - likely as part of a covered call or short call strategy. Now they're buying them back to close the position before expiration.
-
BUY to CLOSE (BTC) the $98 Calls: This trader previously BOUGHT these $98 calls. Now they're selling them to close the position and capture profits.
Why Close on 0DTE?
With GDX at $106.56 and expiration TODAY:
- The $101 calls are $5.56 in-the-money (intrinsic value ~$5.56 per share = $5.56 x 2M shares = ~$11.1M)
- The $98 calls are $8.56 in-the-money (intrinsic value ~$8.56 per share = $8.56 x 2M shares = ~$17.1M)
If they don't close these positions, they face:
- Automatic assignment (for the short $101 calls)
- Exercise decisions (for the long $98 calls)
- Capital tie-up and settlement risk
By closing now, they lock in their gains cleanly and free up capital for the next trade.
The Profit Picture
Without knowing their original entry prices, we can't calculate exact P&L. But consider:
- If they originally sold the $101 calls when GDX was around $95-100, they collected premium that's now being offset
- If they bought the $98 calls when GDX was around $95-100, they're sitting on massive intrinsic value gains
This ROLL suggests profit-taking after GDX's monster run.
🔥 Unusualness Score: Both 8+/10
| Metric | $101 Call (SELL) | $98 Call (BUY) |
|---|---|---|
| Activity Level | ~4.3x average | ~3.9x average |
| Classification | EXTREMELY_UNUSUAL | EXTREMELY_UNUSUAL |
| Percentile Rank | Top 0.01% | Top 0.01% |
| What It Means | Historic-level activity | Historic-level activity |
Why These Levels Matter:
Activity at 4x+ the average indicates volume significantly above normal trading patterns. At 4.3x and 3.9x average, we're looking at trades that occur maybe a handful of times per year for GDX. This isn't noise - this is signal.
🎯 Gamma Exposure & Support/Resistance
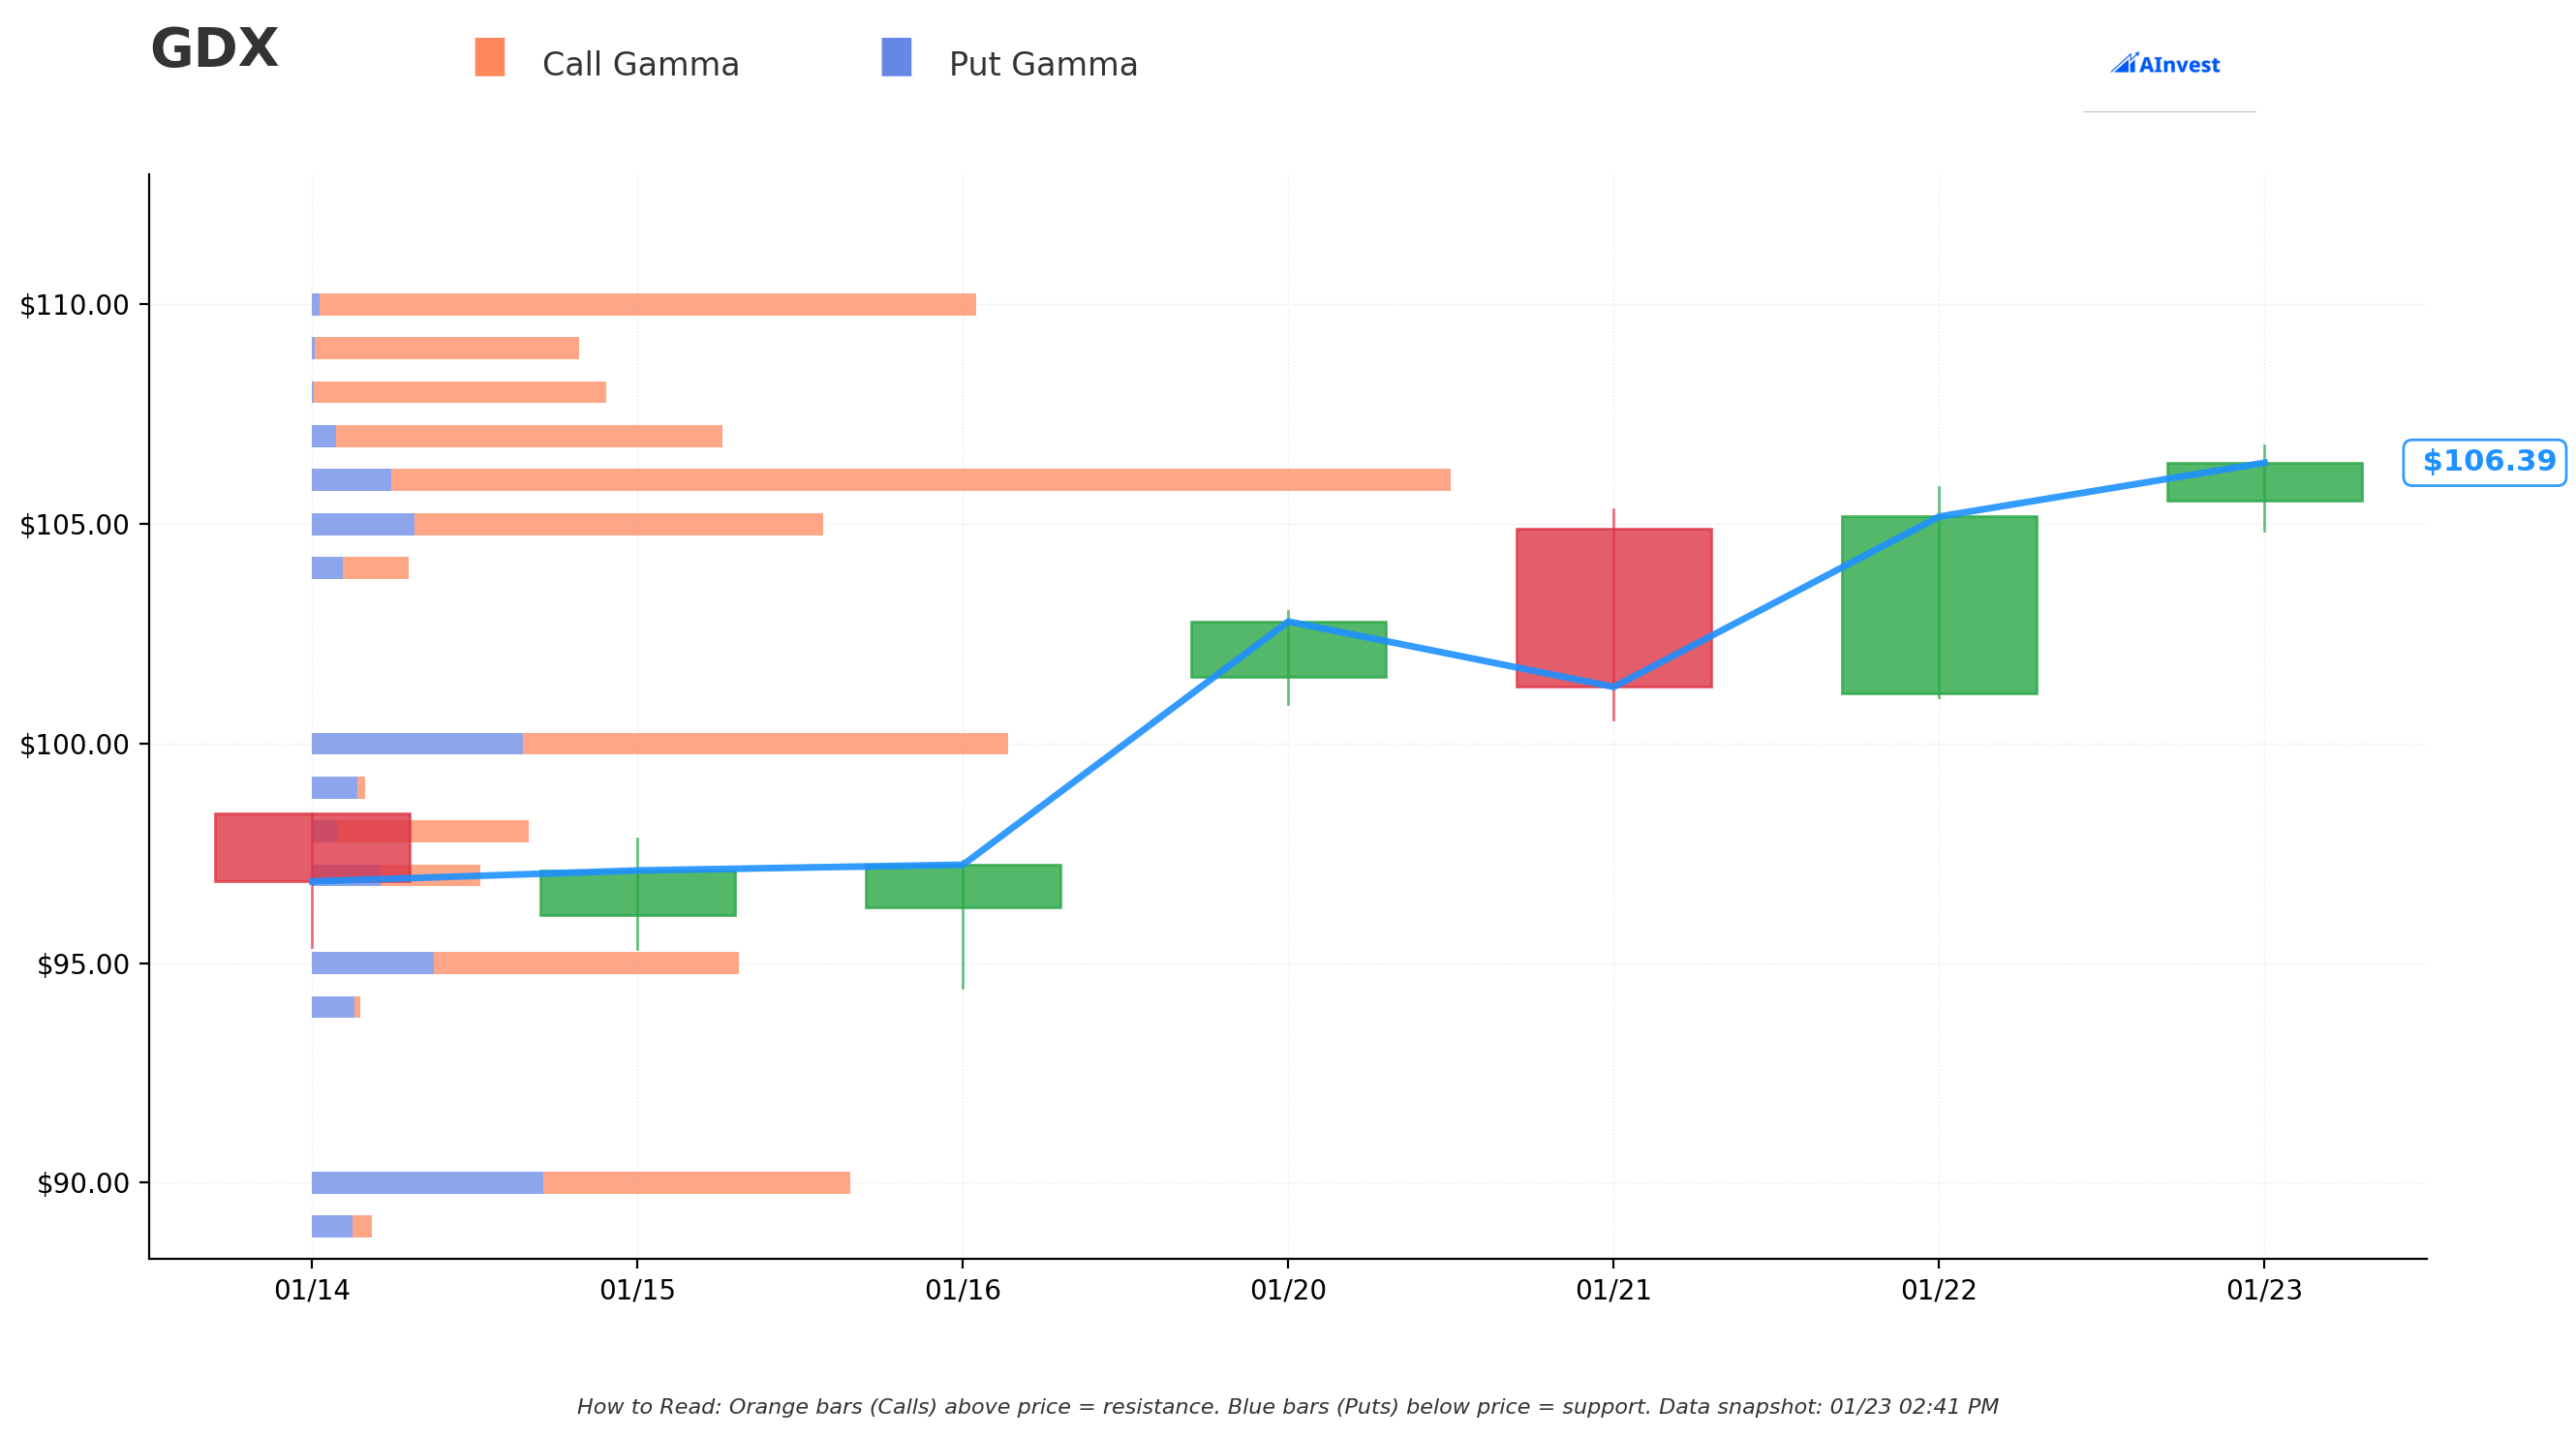
Current GEX Picture:
| Level | Type | Distance | Significance |
|---|---|---|---|
| $106.0 | 🟢 Strongest Support | 0.5% below | Gamma wall - expect bounces here |
| $107.0 | 🔴 Strongest Resistance | 0.4% above | First ceiling to break |
| $105.0 | 🟢 Support | 1.5% below | Secondary floor |
| $108-110 | 🔴 Resistance Zone | 1.4-3.2% above | Targets if breakout |
| $100-101 | 🟢 Major Support | 5-6% below | Key psychological level |
GEX Bias: BULLISH
With Call GEX at 123.4 vs Put GEX at 47.4, dealers are positioned to support upward moves. When calls dominate, dealer hedging activity tends to dampen downside moves and amplify upside - that's good news for gold bulls.
📊 Implied Move Analysis
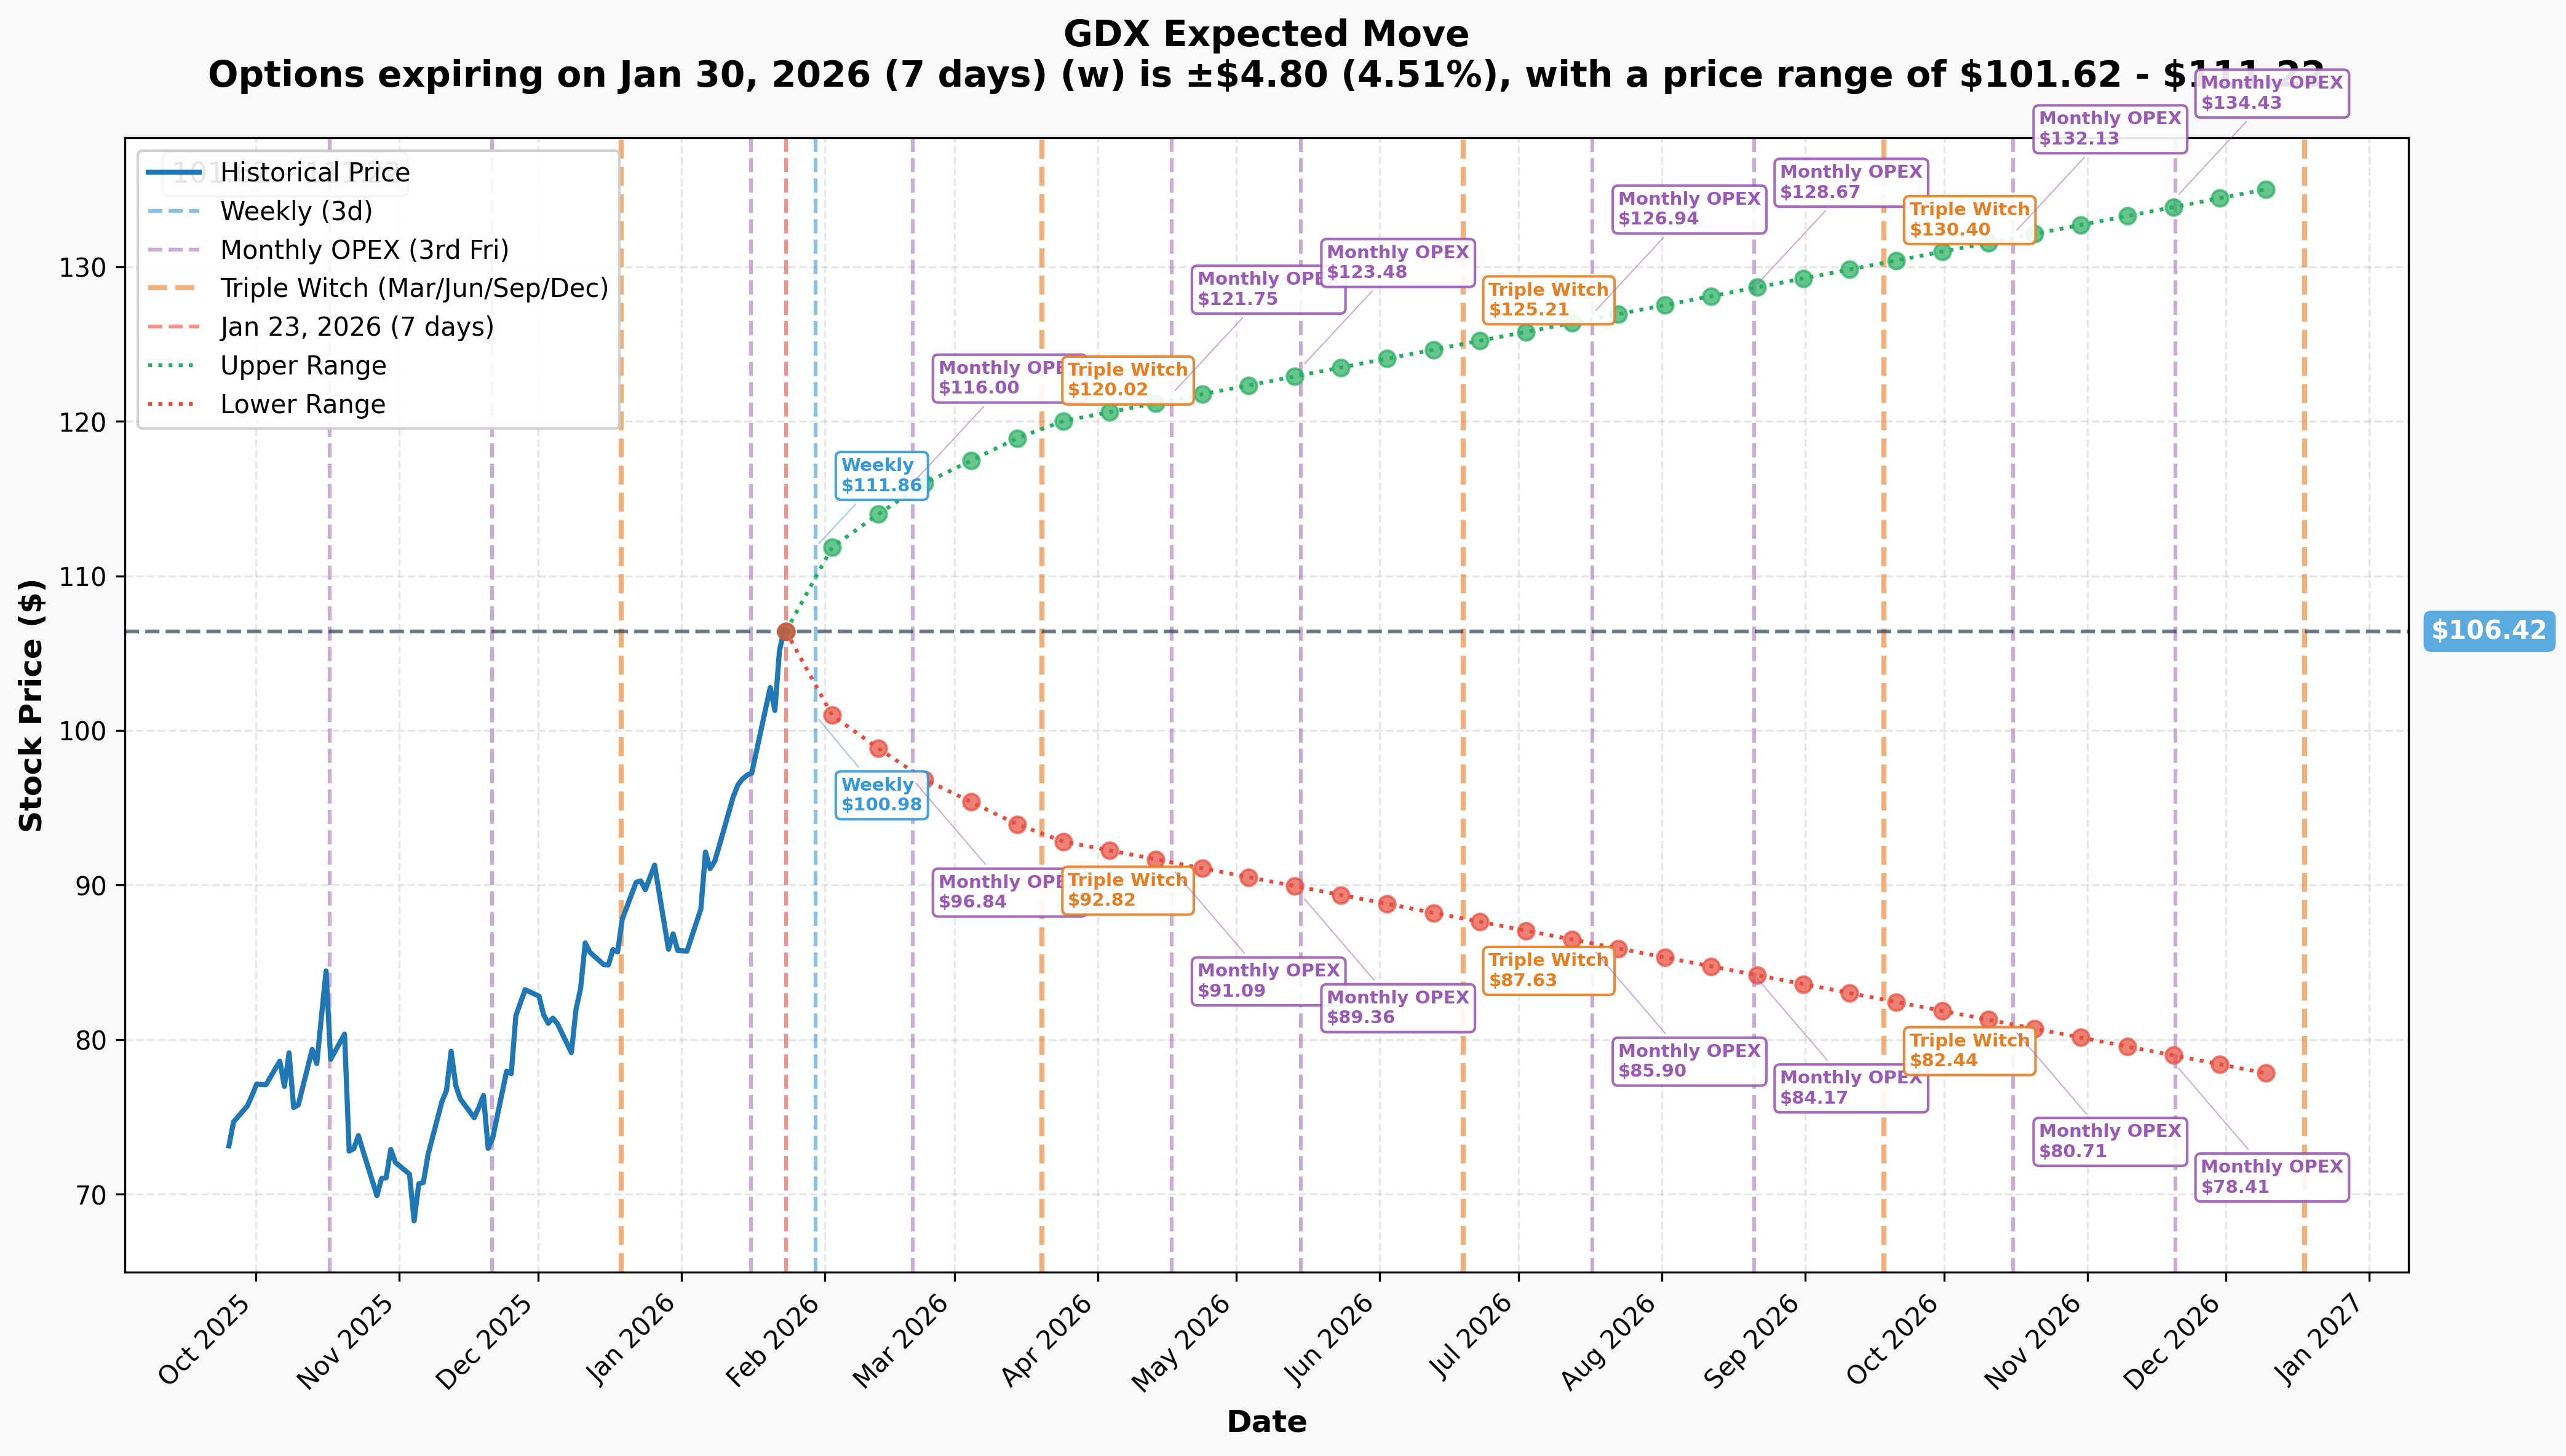
| Timeframe | Expected Range | Lower Bound | Upper Bound |
|---|---|---|---|
| 0DTE (Today) | ±0.6% | $105.78 | $107.06 |
| Weekly (Jan 30) | ±4.51% | $101.62 | $111.22 |
| Monthly (Feb 20) | ±8.73% | $97.13 | $115.71 |
| Quarterly (Mar 20) | ±12.56% | $93.05 | $119.79 |
| LEAPS (Yearly) | ±27.36% | $77.31 | $135.53 |
IV Environment: HIGH (~47% Monthly)
This elevated implied volatility tells us:
- Options are expensive - sellers have an edge if vol compresses
- Big moves expected - market pricing significant uncertainty
- Premium opportunity - consider selling strategies if you're neutral
The fact that someone is closing positions rather than opening new ones in this high-IV environment is notable. They may believe the easy money has been made.
🌟 Key Catalysts
What's Driving Gold Miners Right Now:
Bullish Factors:
- Gold at $2,737/oz - Up 33.4% YTD, miners benefit from operational leverage
- Fed Rate Cut Expectations - Markets pricing 3 cuts in 2026, lower rates boost gold
- Central Bank Buying - WGC data shows continued accumulation by China, India, and others
- Trump Tariff Concerns - Currency volatility driving safe-haven demand
- Q1 2026 Earnings Season - Miners set to report record margins with gold above $2,700
Risk Factors:
- Dollar Strength - Any USD rally pressures gold prices
- Profit-Taking - After 44.77% YTD gain, some investors booking gains
- Mining Cost Inflation - Energy and labor costs rising globally
- Gold Price Pullback - Overextended run could correct
- Position Concentration - Heavy institutional positioning creates unwind risk
🎲 Price Targets & Probabilities
🚀 Bull Case (30% probability)
Target: $115-120 by March
- Gold breaks $2,800/oz on Fed dovishness
- Q1 earnings beat expectations
- Dollar weakness accelerates
- Outcome: New all-time highs for GDX
😐 Base Case (50% probability)
Target: $102-110 range
- Gold consolidates around $2,700-2,750
- GDX digests gains, trades sideways
- Implied volatility compresses
- Outcome: Profit-taking but no crash
😰 Bear Case (20% probability)
Target: $90-95
- Fed delays rate cuts on sticky inflation
- Gold corrects to $2,500
- Miners underperform on cost pressures
- Outcome: 10-15% pullback from current levels
💡 Trading Ideas for Different Risk Levels
🛡️ Conservative: "Follow the Profit-Taker"
Strategy: Covered Call on GDX shares
- Buy 100 GDX shares at $106.56
- Sell Feb 21 $112 call for ~$3.00 premium
- Max Gain: $8.44/share (7.9%) if called away
- Breakeven: $103.56
- Rationale: Generate income while the institutional player takes profits; cap your upside but protect downside
⚖️ Balanced: "Neutral Volatility Play"
Strategy: Iron Condor (Feb expiration)
- Sell Feb 21 $100 Put, Buy Feb 21 $95 Put
- Sell Feb 21 $115 Call, Buy Feb 21 $120 Call
- Max Gain: ~$2.00 credit
- Max Loss: $3.00 per spread
- Rationale: High IV environment favors premium sellers; range-bound expectation after big run
🚀 Aggressive: "Ride the Momentum"
Strategy: Bull Call Spread (if bullish)
- Buy Feb 21 $108 Call
- Sell Feb 21 $115 Call
- Cost: ~$2.50 debit
- Max Gain: $4.50 (180% return)
- Rationale: Captures continued upside while defining risk; benefits from any post-pullback rally
🔍 What This ROLL Tells Us
Institutional Interpretation:
-
Profit Crystallization: After GDX's 44.77% YTD run, this institution is booking gains. Smart money doesn't hold winning positions forever.
-
Risk Management: Closing on 0DTE avoids assignment risk and settlement complications. Professional behavior.
-
Potential Caution Signal: When institutions unwind rather than roll forward (to a future expiration), it may indicate reduced conviction in near-term upside.
-
Capital Reallocation: The $23M freed up from this close will go somewhere else. Watch for unusual activity in other sectors for clues.
What You Should Do:
If you're long GDX:
- This isn't a "sell everything" signal, but consider tightening stops
- Take partial profits if you've been riding the rally
- Watch the $106 gamma support level
If you're on the sidelines:
- Wait for a pullback to the $100-102 zone before initiating longs
- High IV makes naked call buying expensive
- Consider selling put spreads if you want exposure
If you're bearish:
- Don't fight the trend yet, but this profit-taking is worth noting
- Look for follow-through selling in coming days
- Watch if other large positions start unwinding
📱 Key Levels to Watch
Support Zones:
- $106.0 - Immediate gamma support (MUST HOLD for bulls)
- $105.0 - Secondary support level
- $100-101 - Major psychological level / prior resistance
- $95.0 - Deep support if correction accelerates
Resistance Zones:
- $107.0 - Immediate ceiling
- $108-110 - Breakout confirmation zone
- $115+ - New all-time high territory
📊 Summary Table
| Attribute | Value |
|---|---|
| Ticker | GDX |
| Current Price | $106.56 |
| Strategy Detected | ROLL (Position Close) |
| Total Premium | $23M |
| Activity Level | 4x+ average (EXTREMELY_UNUSUAL) |
| GEX Bias | Bullish |
| IV Environment | High (~47% monthly) |
| Key Support | $106.0 |
| Key Resistance | $107.0 |
| YTD Performance | +44.77% |
🎬 The Bottom Line
Real talk: When you see $23 million in GDX options positions getting unwound on the same day - both marked as EXTREMELY_UNUSUAL - it's not a coincidence. This is coordinated profit-taking by an institution that rode the gold miners rally beautifully and is now stepping aside.
Does this mean GDX is about to crash? No. But it does mean that at least one sophisticated player thinks the risk/reward has shifted enough to book gains rather than let positions ride.
The 44.77% YTD gain is phenomenal. Gold at $2,737 is remarkable. But trees don't grow to the sky, and this ROLL is a gentle reminder that even the best trends eventually pause or reverse.
Your Move:
- If you've been riding GDX higher, consider following this whale's lead and taking some chips off the table
- If you're looking to enter, patience may be rewarded with a pullback to the $100-105 zone
- If you're trading options, the high IV environment favors premium sellers over premium buyers
Watch the $106 gamma wall carefully. If it holds, bulls stay in control. If it breaks, we could see a faster move down to test $100.
Gold miners have been one of the best trades of 2026 - this institution just rang the register. The question is: should you?
⚠️ Risk Disclosure
This analysis is for educational purposes only and does not constitute financial advice. Options trading involves substantial risk of loss and is not suitable for all investors. The unusualness scores and classifications are based on historical data patterns and do not guarantee future outcomes. Past performance does not predict future results. ROLL trades represent position management, not new directional bets - interpret accordingly. Always conduct your own research and consult with a licensed financial advisor before making any investment decisions. You can lose 100% of your premium when buying options.
Analysis Generated: January 23, 2026 Data Source: Live Options Flow - January 23, 2026 13:42:53 ET Unusualness Methodology: Statistical comparison vs. average activity