🐋 GDX: $19.4M LEAPS Whale Makes Massive Multi-Year Bet on Gold Miners!
February 4, 2026 | 🔥 Unusual Activity Detected
🎯 The Quick Take
Someone just dropped $19.4 MILLION on GDX calls with a twist - they're betting nearly $15M of that on LEAPS expiring in January 2028! This isn't your neighbor Bob's Robinhood account - this is institutional money making a massive multi-year bullish bet on gold miners right as Q4 earnings season kicks off. With gold hovering around $5,000/oz and miners generating record margins, a whale is positioning for the gold supercycle to continue for the next 2 years.
💰 The Option Flow Breakdown
📊 What Just Happened
| Time | Side | C/P | Strike | Expiration | Volume | OI | Premium | Spot |
|---|---|---|---|---|---|---|---|---|
| 14:40:03 | BUY | CALL | $110 | 2026-03-20 | 15,000 | 10K | $4.8M | $97.11 |
| 14:36:04 | BUY | CALL | $115 | 2028-01-21 | 2,500 | 3.3K | $4.6M | $97.1 |
| 14:36:04 | BUY | CALL | $120 | 2028-01-21 | 2,600 | 4.3K | $4.3M | $97.1 |
| 14:36:04 | BUY | CALL | $115 | 2028-01-21 | 4,100 | 3.3K | $2.9M | $97.1 |
| 14:36:04 | BUY | CALL | $120 | 2028-01-21 | 4,200 | 4.3K | $2.8M | $97.1 |
Total Premium Spent: ~$19.4M 🐋
🤓 What This Actually Means
Let me break this down for you:
The LEAPS Component (~$14.6M):
- 🎯 6,600 contracts at the $115 strike for Jan 2028 = betting GDX hits $115+ in 2 years (+18% from current)
- 🎯 6,800 contracts at the $120 strike for Jan 2028 = betting GDX hits $120+ (+23% from current)
- These LEAPS are nearly 2 YEARS OUT - this isn't a quick trade, it's a conviction bet on the gold supercycle
The Near-Term Component ($4.8M):
- 🎯 15,000 contracts at the $110 strike for March 2026 Triple Witch
- This is the "catalyst play" - 44 days to expiration, right through earnings season
- Break-even around $113.20 (+16.5% from current)
Translation: This whale is building a complex roll structure - near-term upside exposure for earnings season PLUS long-dated conviction bets. They're paying up for time value because they believe gold miners have years of runway ahead, not weeks.
The total 13,400 LEAPS contracts across the $115-$120 strikes represents one of the largest single-session LEAPS positions we've seen in GDX this year.
📈 Technical Setup / Chart Check-Up
YTD Chart Analysis
GDX has been on an absolute tear, surging roughly 144% since March 2024 as gold prices rocketed from ~$2,000 to ~$5,000/oz. The ETF hit an all-time high of $113.50 before pulling back to current levels around $97.
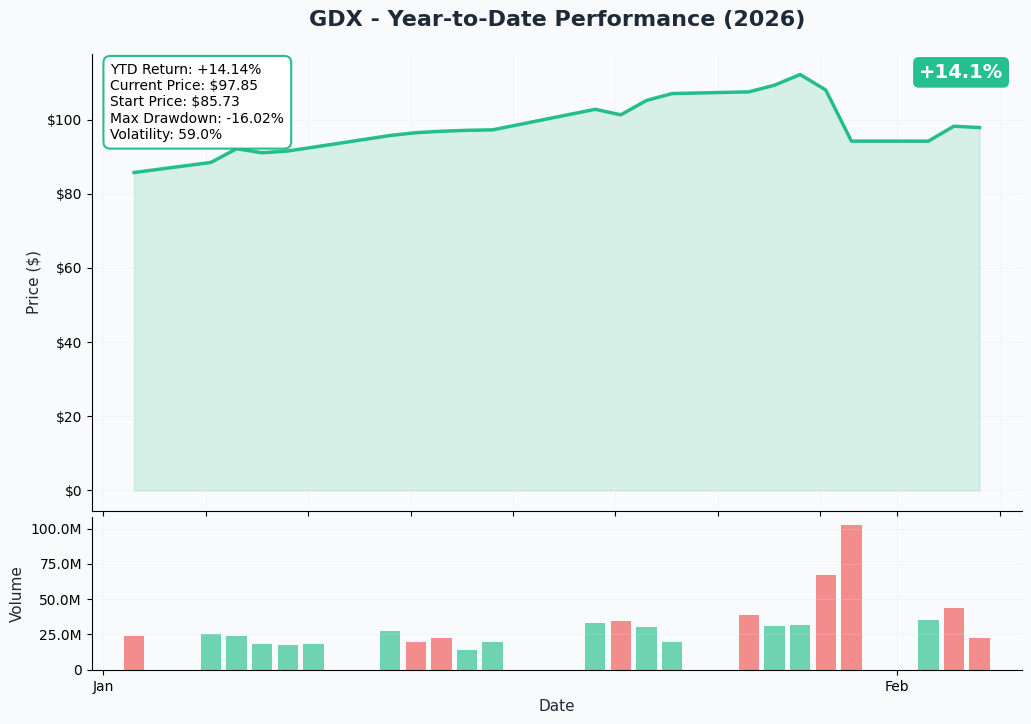
Key Technical Observations:
- 📈 Current Price: $97.57 (down from $113.50 ATH)
- 📊 52-Week Range: $38.58 - $113.50
- ⚠️ Trading 46% above the 200-day MA - technically overbought but momentum remains strong
- 💪 Recent support held at $94.94 on today's intraday low
Gamma-Based Support & Resistance Analysis
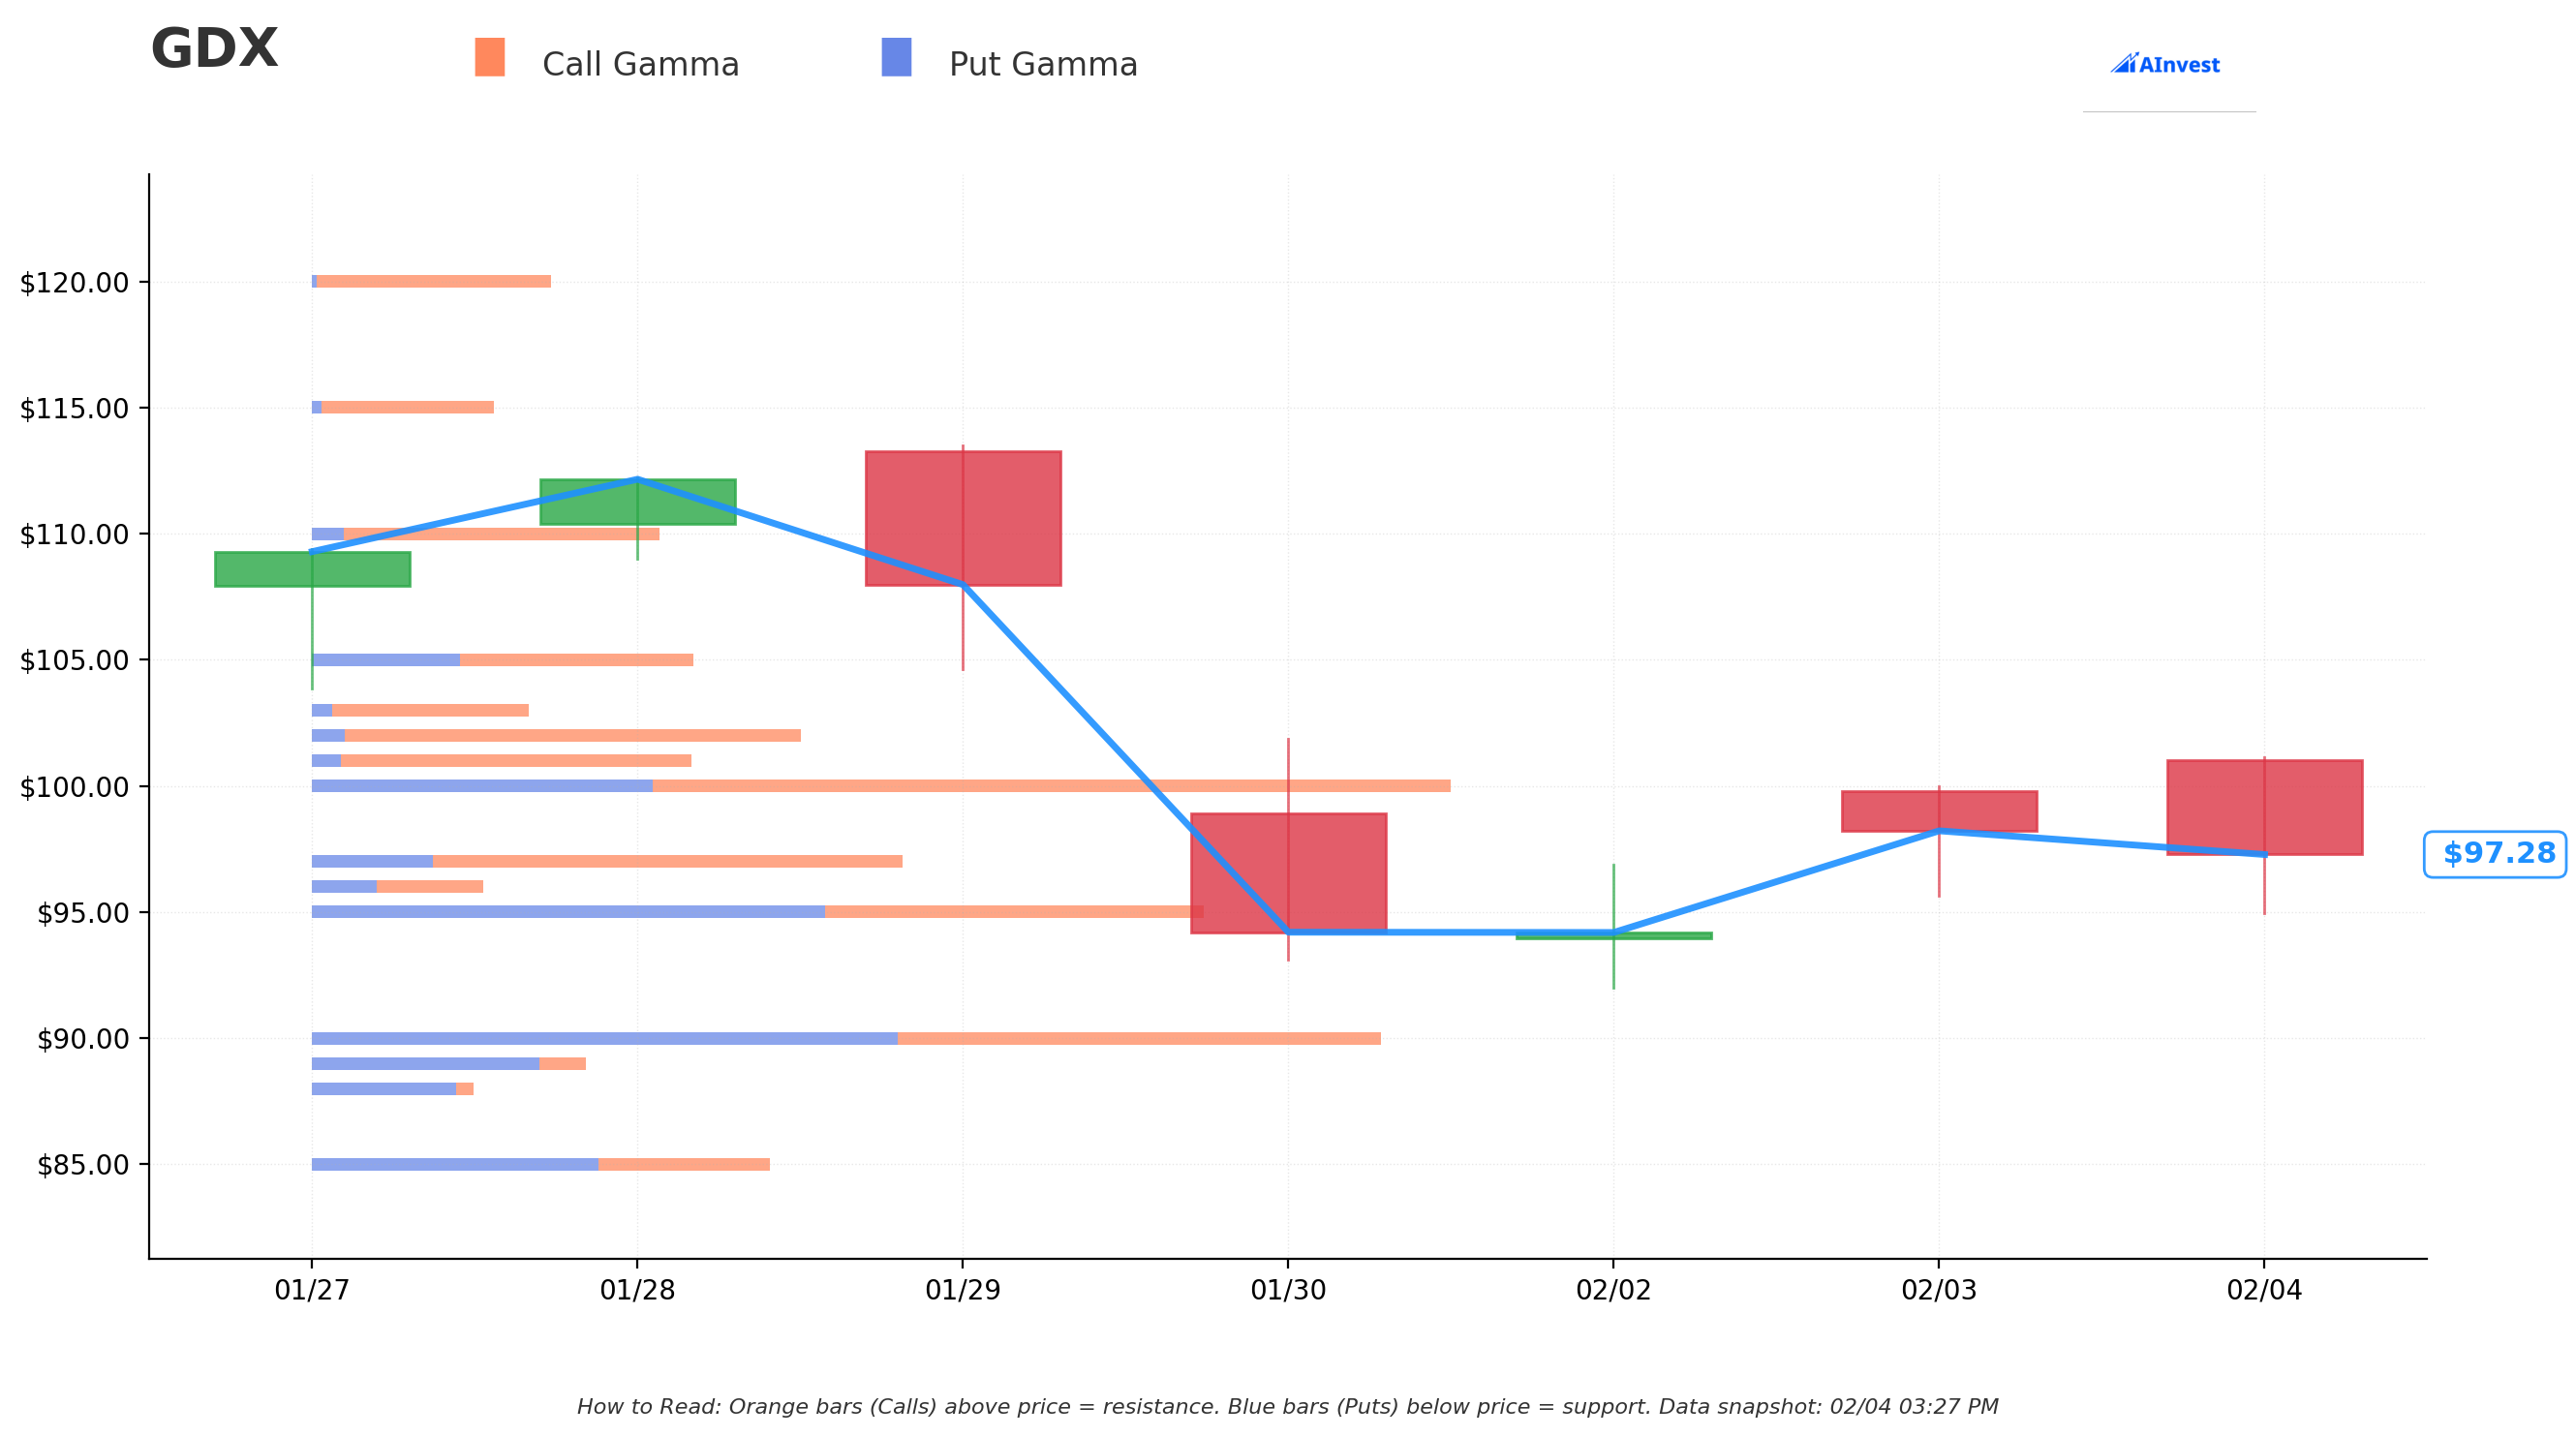
Understanding the Gamma Levels:
- 🔵 Blue bars (Put Gamma) = Support levels where market makers need to buy shares to hedge
- 🟠 Orange bars (Call Gamma) = Resistance levels where market makers need to sell shares to hedge
- Bigger bars = Stronger magnetic pull at those price levels
Key Gamma Levels:
| Level Type | Strike | Net GEX | Distance from Current |
|---|---|---|---|
| Strongest Resistance | $100 | +9.35 | +2.7% |
| Secondary Resistance | $102 | +8.79 | +4.7% |
| Strongest Support | $97 | +7.06 | -0.4% |
| Secondary Support | $95 | -2.71 | -2.4% |
What This Means:
- The $100 strike is the big gamma wall above - expect price to gravitate toward and struggle at this level initially
- $97 is acting as gamma support right now - why GDX bounced today
- Net GEX bias is BULLISH (total call gamma 123M vs put gamma 96M)
- Market makers are positioned to buy dips and sell rips in a range between $95-$102
Implied Move-Based Support & Resistance
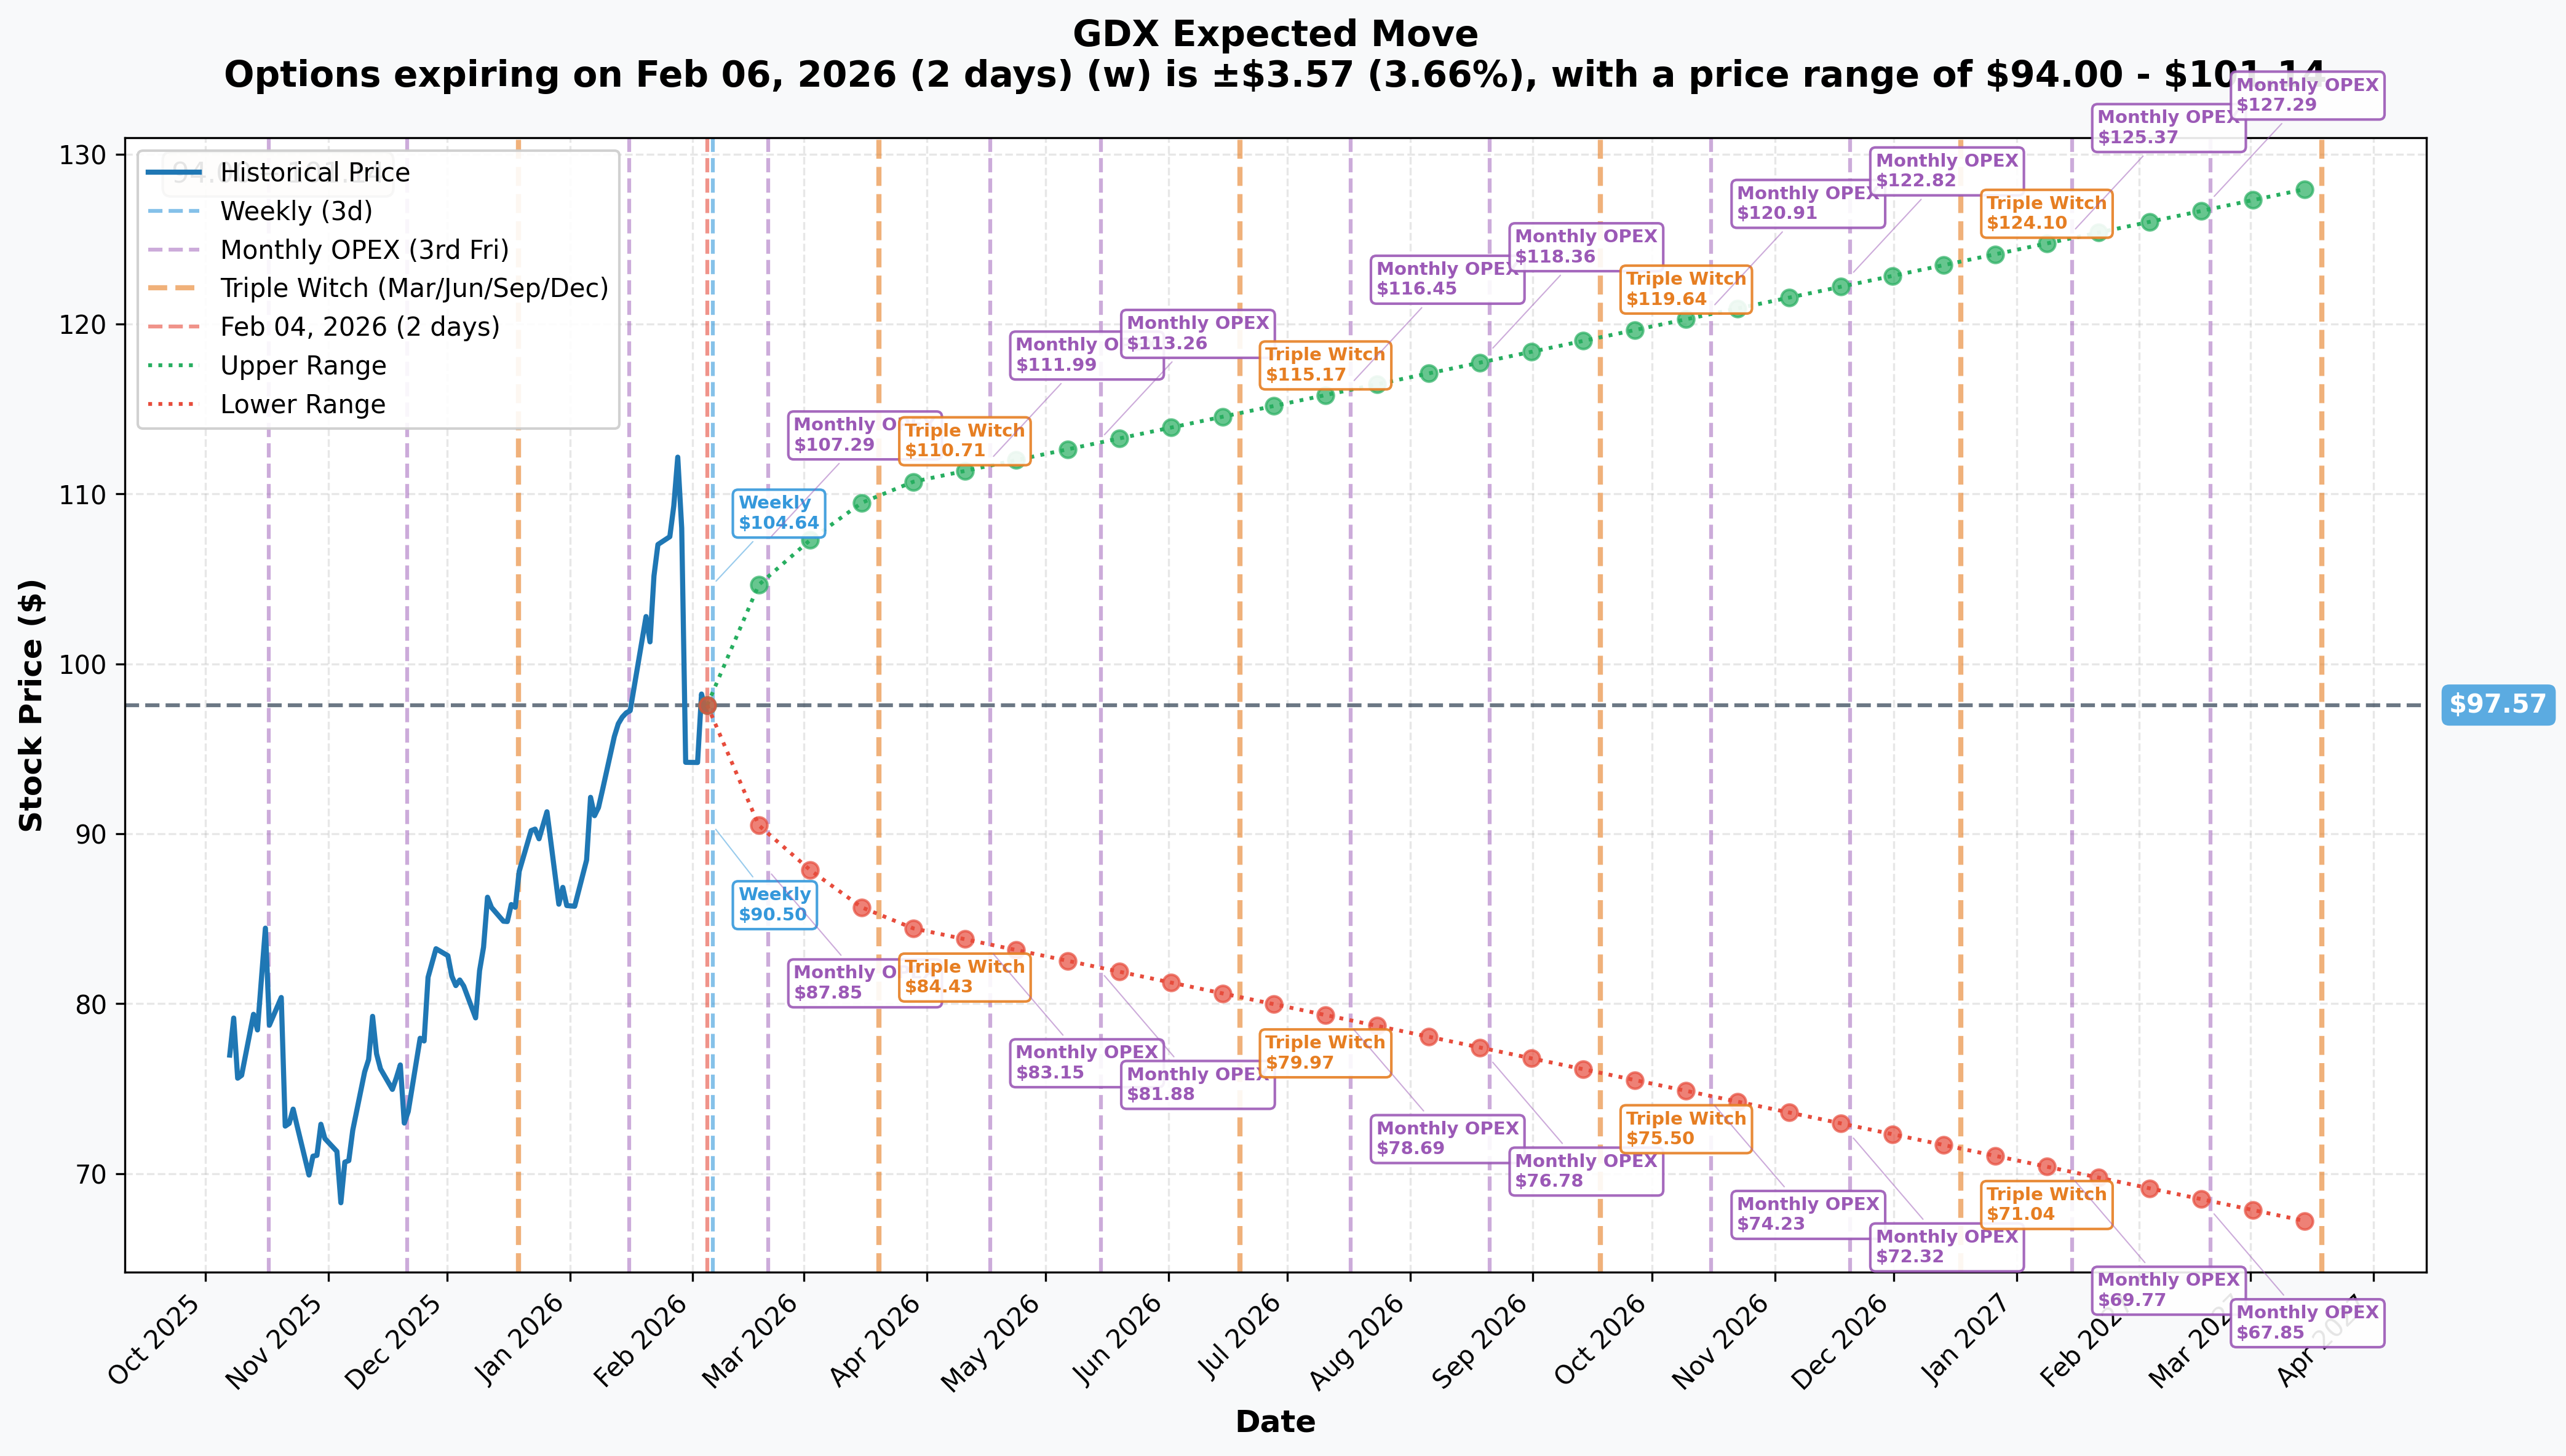
The options market is pricing in significant volatility across all timeframes:
| Timeframe | Expiration | Implied Move | Upper Range | Lower Range |
|---|---|---|---|---|
| Weekly | 2026-02-06 | 3.66% | $101.14 | $94.00 |
| Monthly OPEX | 2026-02-20 | 8.23% | $105.60 | $89.54 |
| Triple Witch | 2026-03-20 | 13.07% | $110.32 | $84.82 |
| Yearly LEAPS | 2027-03-19 | 31.36% | $128.17 | $66.97 |
Translation for Traders:
- Options market expects GDX could move +/- $3.57 by this Friday
- By February OPEX, the expected range is $89.54 to $105.60
- The whale's March $110 calls are right at the upper implied move boundary - aggressive but achievable
- The Jan 2028 LEAPS at $115-$120 are within the yearly implied move envelope - reasonable targets
🎪 Catalysts
📅 Upcoming Catalysts (Next 60 Days)
| Date | Event | Ticker | Impact |
|---|---|---|---|
| Feb 5, 2026 | Barrick Q4 Earnings (Pre-Market) | GOLD | 🔥 $42B spin-off update expected |
| Feb 12, 2026 | Agnico Eagle Q4 Earnings (After Close) | AEM | 🔥 BofA top pick for 2026 |
| Feb 19, 2026 | Newmont Q4 Earnings (After Close) | NEM | 🔥 Expected EPS +29% YoY |
| Feb 20, 2026 | Monthly OPEX | - | Options expiration |
| March 2026 | Fed Meeting | - | Rate decision impacts gold |
| March 20, 2026 | Triple Witch | - | Major options/futures expiration |
✅ Recent Catalysts (Already Happened)
| Date | Event | Impact |
|---|---|---|
| Jan 30, 2026 | GDX crashed 13% intraday on Kevin Warsh Fed Chair nomination | Hawkish Fed fears |
| Jan 29, 2026 | Fed held rates at 3.5%-3.75% as expected | Supportive for gold |
| Jan 18-22, 2026 | Gold hit records on Greenland tariff threats | Safe-haven flows |
| Jan 12, 2026 | Gold smashed $4,600 record on Powell investigation | Fed independence concerns |
🎲 Price Targets & Probabilities
Based on gamma levels, implied moves, and upcoming catalysts:
🐻 Bear Case: $85-$90 (15% probability)
Scenario: Hawkish Fed pivot, gold drops below $4,500, risk-off equity selloff
- Support at $90 strike (strong put gamma wall)
- Implied move lower bound for March: $84.82
- Trigger: Warsh confirmed as Fed Chair with hawkish stance
⚖️ Base Case: $100-$105 (55% probability)
Scenario: Earnings beat expectations, gold stable $4,800-$5,200, gradual grind higher
- Resistance at $100 (massive call gamma wall)
- Secondary resistance at $102-$105
- Trigger: Strong Q4 miner earnings with margin expansion
🚀 Bull Case: $110-$115 (30% probability)
Scenario: Barrick spin-off announced, gold breaks $5,500, central bank buying accelerates
- Aligns with whale's March $110 strike target
- Implied move upper bound for March: $110.32
- Trigger: JPMorgan's $6,300 gold target gains traction
💡 Trading Ideas
🛡️ Conservative: "Sleep Well Gold" (For Premium Collectors)
Strategy: Sell Cash-Secured Puts at Support
- Trade: Sell GDX $90 Put, March 20, 2026 expiration
- Premium: ~$2.00-2.50 per contract
- Max Risk: $8,750 per contract (assigned at $90, minus premium)
- Return: 2.8% on capital in 44 days (23% annualized)
Why This Works: The $90 strike is at a major put gamma support level and below the implied move lower bound. You're essentially getting paid to buy GDX at a 7.5% discount if gold miners crash. World Gold Council data shows central bank buying provides structural floor for gold prices.
⚖️ Balanced: "Ride the Earnings Wave" (For Swing Traders)
Strategy: Call Debit Spread Through Earnings
- Trade: Buy GDX $100 Call / Sell GDX $110 Call, March 20, 2026
- Debit: ~$3.50-4.00 per spread
- Max Profit: $6.00-6.50 per spread ($1,000 risk for ~$600 profit = 60% return)
- Break-even: $103.50-104.00
Why This Works: This spread captures the earnings catalyst window (Feb 5-19) while reducing premium outlay. You're targeting the $100-$110 range where the whale just loaded up. The defined risk protects against the extreme overbought conditions that could cause sharp pullbacks.
🚀 Aggressive: "Follow the Whale" (For YOLO Traders)
Strategy: Diagonal Spread Mimicking the Institutional Flow
- Trade: Buy GDX $115 Call Jan 2028 LEAPS + Sell GDX $105 Call March 2026
- Net Debit: ~$14-16 per diagonal
- Thesis: Own the LEAPS like the whale, but reduce cost basis by selling near-term premium
Why This Works: You're essentially copying the whale's playbook - long-dated conviction bet on gold miners plus near-term income. The March short call generates income while you wait for the multi-year gold thesis to play out. Analysts expect $11-12 EPS for Agnico Eagle by 2026, supporting the bull case.
Warning: This requires significant capital and conviction. Only appropriate for traders who believe in the 2+ year gold supercycle thesis.
⚠️ Risk Factors
🚨 Fed Policy Risk
The January 30 crash (-13% intraday) proves how vulnerable gold miners are to Fed hawkishness. Kevin Warsh's nomination as potential Fed Chair spooked markets. A confirmed hawkish Fed pivot could crush this trade.
📉 Technical Overbought Risk
GDX is 46% above its 200-day moving average - historically extreme. Mean reversion risk is elevated, and fast money could exit positions quickly.
💰 Operating Leverage Cuts Both Ways
When gold drops, mining costs don't - AISC costs running $1,500-1,700/oz eat into margins fast. A 10% gold correction could cause 20%+ GDX drawdown.
🌍 Geopolitical Whipsaw
The "TACO trade" (Trump Always Chickens Out) creates bidirectional volatility. Tariff threats spike gold, then reversals crash it. Position sizing matters.
📊 Execution Risk on LEAPS
The Jan 2028 LEAPS have wide bid-ask spreads. Getting filled at favorable prices requires patience. The whale likely used VWAP orders or negotiated with market makers directly.
🎯 The Bottom Line
Real talk: A whale just made a $19.4 million bet that gold miners have a lot more room to run - and they're willing to wait TWO YEARS to be proven right. The structure of this trade - near-term March calls for earnings season PLUS massive Jan 2028 LEAPS - screams institutional conviction in the gold supercycle thesis.
Here's the deal:
📈 If you're bullish on gold: This is validation from big money. Consider the balanced call spread strategy through earnings, or accumulate shares on dips to the $95 support level. The fundamentals are incredible - gold at $5,000 vs AISC of $1,600 means miners are printing money.
👀 If you're watching from the sidelines: Mark your calendar for February 5 (Barrick earnings) and February 19 (Newmont earnings). These will set the tone for the sector. The $100 gamma wall is the key level to watch - a breakout above confirms the bull case.
🐻 If you're bearish: Respect the whale flow but recognize the technical overbought conditions. A break below $95 gamma support could trigger accelerated selling toward $90. The Fed remains the wild card.
Position sizing is critical. This sector can move 10%+ in a single session (we literally saw it on Jan 30). Don't YOLO your account on leverage - the whale can afford to be wrong, can you?
📋 ETF Overview
VanEck Gold Miners ETF (GDX)
| Metric | Value |
|---|---|
| Current Price | $97.57 |
| 52-Week Range | $38.58 - $113.50 |
| AUM | $25.8 billion |
| Expense Ratio | 0.51% |
| Top Holdings | Agnico Eagle (9.09%), Newmont (8.98%), Barrick (6.91%) |
Sector: Precious Metals Mining Description: Tracks the NYSE Arca Gold Miners Index, providing exposure to publicly traded companies involved primarily in gold mining.
Track GDX in real-time: Ainvest GDX ETF Page
Disclaimer: This analysis is for educational purposes only and does not constitute investment advice. Options trading involves significant risk of loss and is not suitable for all investors. Past performance does not guarantee future results. Always conduct your own research and consult with a licensed financial advisor before making investment decisions.
Tags: #GDX #GoldMiners #LEAPS #UnusualOptionsActivity #WhaleWatch #Gold #VanEck #OptionsFlow
Analysis Date: February 4, 2026