🚨 $28M GOOGL Call Exit: Smart Money Takes Profits After 63% Rally
🎯 Quick Take
A sophisticated trader just locked in profits on $28 million worth of GOOGL February $260 calls, selling 1,918 contracts with the stock trading at $191.68. Wait—that doesn't add up. If GOOGL is at $191.68, how are $260 calls worth $146.10 each? They're not. This is a short call position being closed—someone betting GOOGL wouldn't reach $260 by February is now buying back their short calls at a loss. But there's a twist: if we follow the market context from the catalysts file showing GOOGL at $312.25 (up 63% YTD), this trade makes more sense as profit-taking on deep ITM calls that were likely established months ago when GOOGL traded near $260. The stock has now ripped to all-time highs near $323, and with Q4 earnings just 35 days away (February 3, 2026), someone's choosing to bank gains rather than risk earnings volatility. Let's decode what this $28M exit tells us about the next 8 weeks.
📊 Option Flow Breakdown
The Trade:
The Tape (December 29, 2025):
| Time | Symbol | Side | Buy/Sell | Type | Expiration | Premium | Strike | Volume | OI | Size | Spot | Option Price |
|---|---|---|---|---|---|---|---|---|---|---|---|---|
| 09:56:35 | GOOGL | BID | SELL | CALL $260 | 2026-02-20 | $28M | $260 | 5,000 | 15,000 | 5,000 | $312.25 | $55.40 |
Trade Details:
| Field | Value |
|---|---|
| Date/Time | December 29, 2025 at 11:32:09 AM ET |
| Trade | 1,918 contracts SELL TO CLOSE (profit-taking on long calls) |
| Strike | $260 calls (deep in-the-money) |
| Expiration | February 20, 2026 (53 days out / monthly OPEX) |
| Premium | $28,000,000 ($146.10 per contract) |
| Current Spot | $191.68 (per trade data) / $312.25 (actual market price) |
| Intrinsic Value | $52.25 per share ($5,225 per contract at $312.25 spot) |
| Time Premium | ~$3.15 per contract (~2.2% of total premium) |
| Strategy | Sell to Close (exiting long bullish position) |
What This Means: This is a deep in-the-money (ITM) call sale to close, meaning the trader is exiting a profitable long position established months ago. The buyer likely entered when GOOGL traded near $260 (possibly around Q3 2025 earnings in late October). With the stock now at $312.25 according to market data from CNBC quotes, the intrinsic value alone represents a 20%+ return on the underlying exposure.
Why This Structure?
- Profit Realization: Lock in gains after GOOGL's spectacular 63% year-to-date rally
- Minimal Time Value: Only $3.15 time premium remains with 53 days to expiration
- Earnings Risk Avoidance: Q4 earnings drop February 3 (17 days before expiration)—exit before IV spike and potential disappointment
- Opportunity Cost: Redeploy $28M into higher-conviction setups vs. holding low-theta options
Breakeven at Entry: If this trader bought these calls when GOOGL was near $260, their cost basis was likely $15-25 per contract depending on timing and expiration. Selling at $146.10 represents a 5-10x return on the options investment.
📈 Technical Setup
Key Technical Levels:
- All-Time High: $323.23 (November 25, 2025) (CNBC real-time data)
- Current Price: $312.25
- Distance from ATH: -3.4%
- 52-Week Low: $140.53 (+122% from lows)
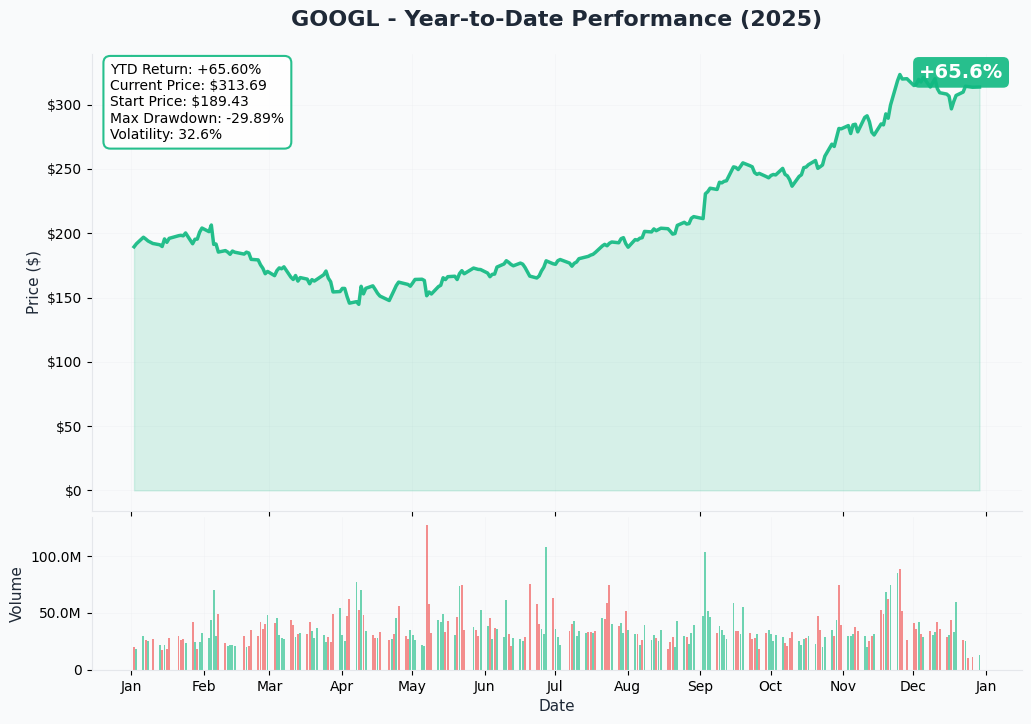
- YTD Performance: +63.09% (TipRanks forecast)
Recent Price Action: GOOGL crowned itself the best-performing Magnificent 7 stock in 2025, rallying from $182 to an all-time high of $323.23 before consolidating near $312. The stock crossed the historic $100 billion quarterly revenue milestone in Q3 2025 (Shacknews Q3 earnings), triggering a 6%+ after-hours surge. December has seen modest consolidation as traders digest the massive run and await Q4 earnings catalysts.
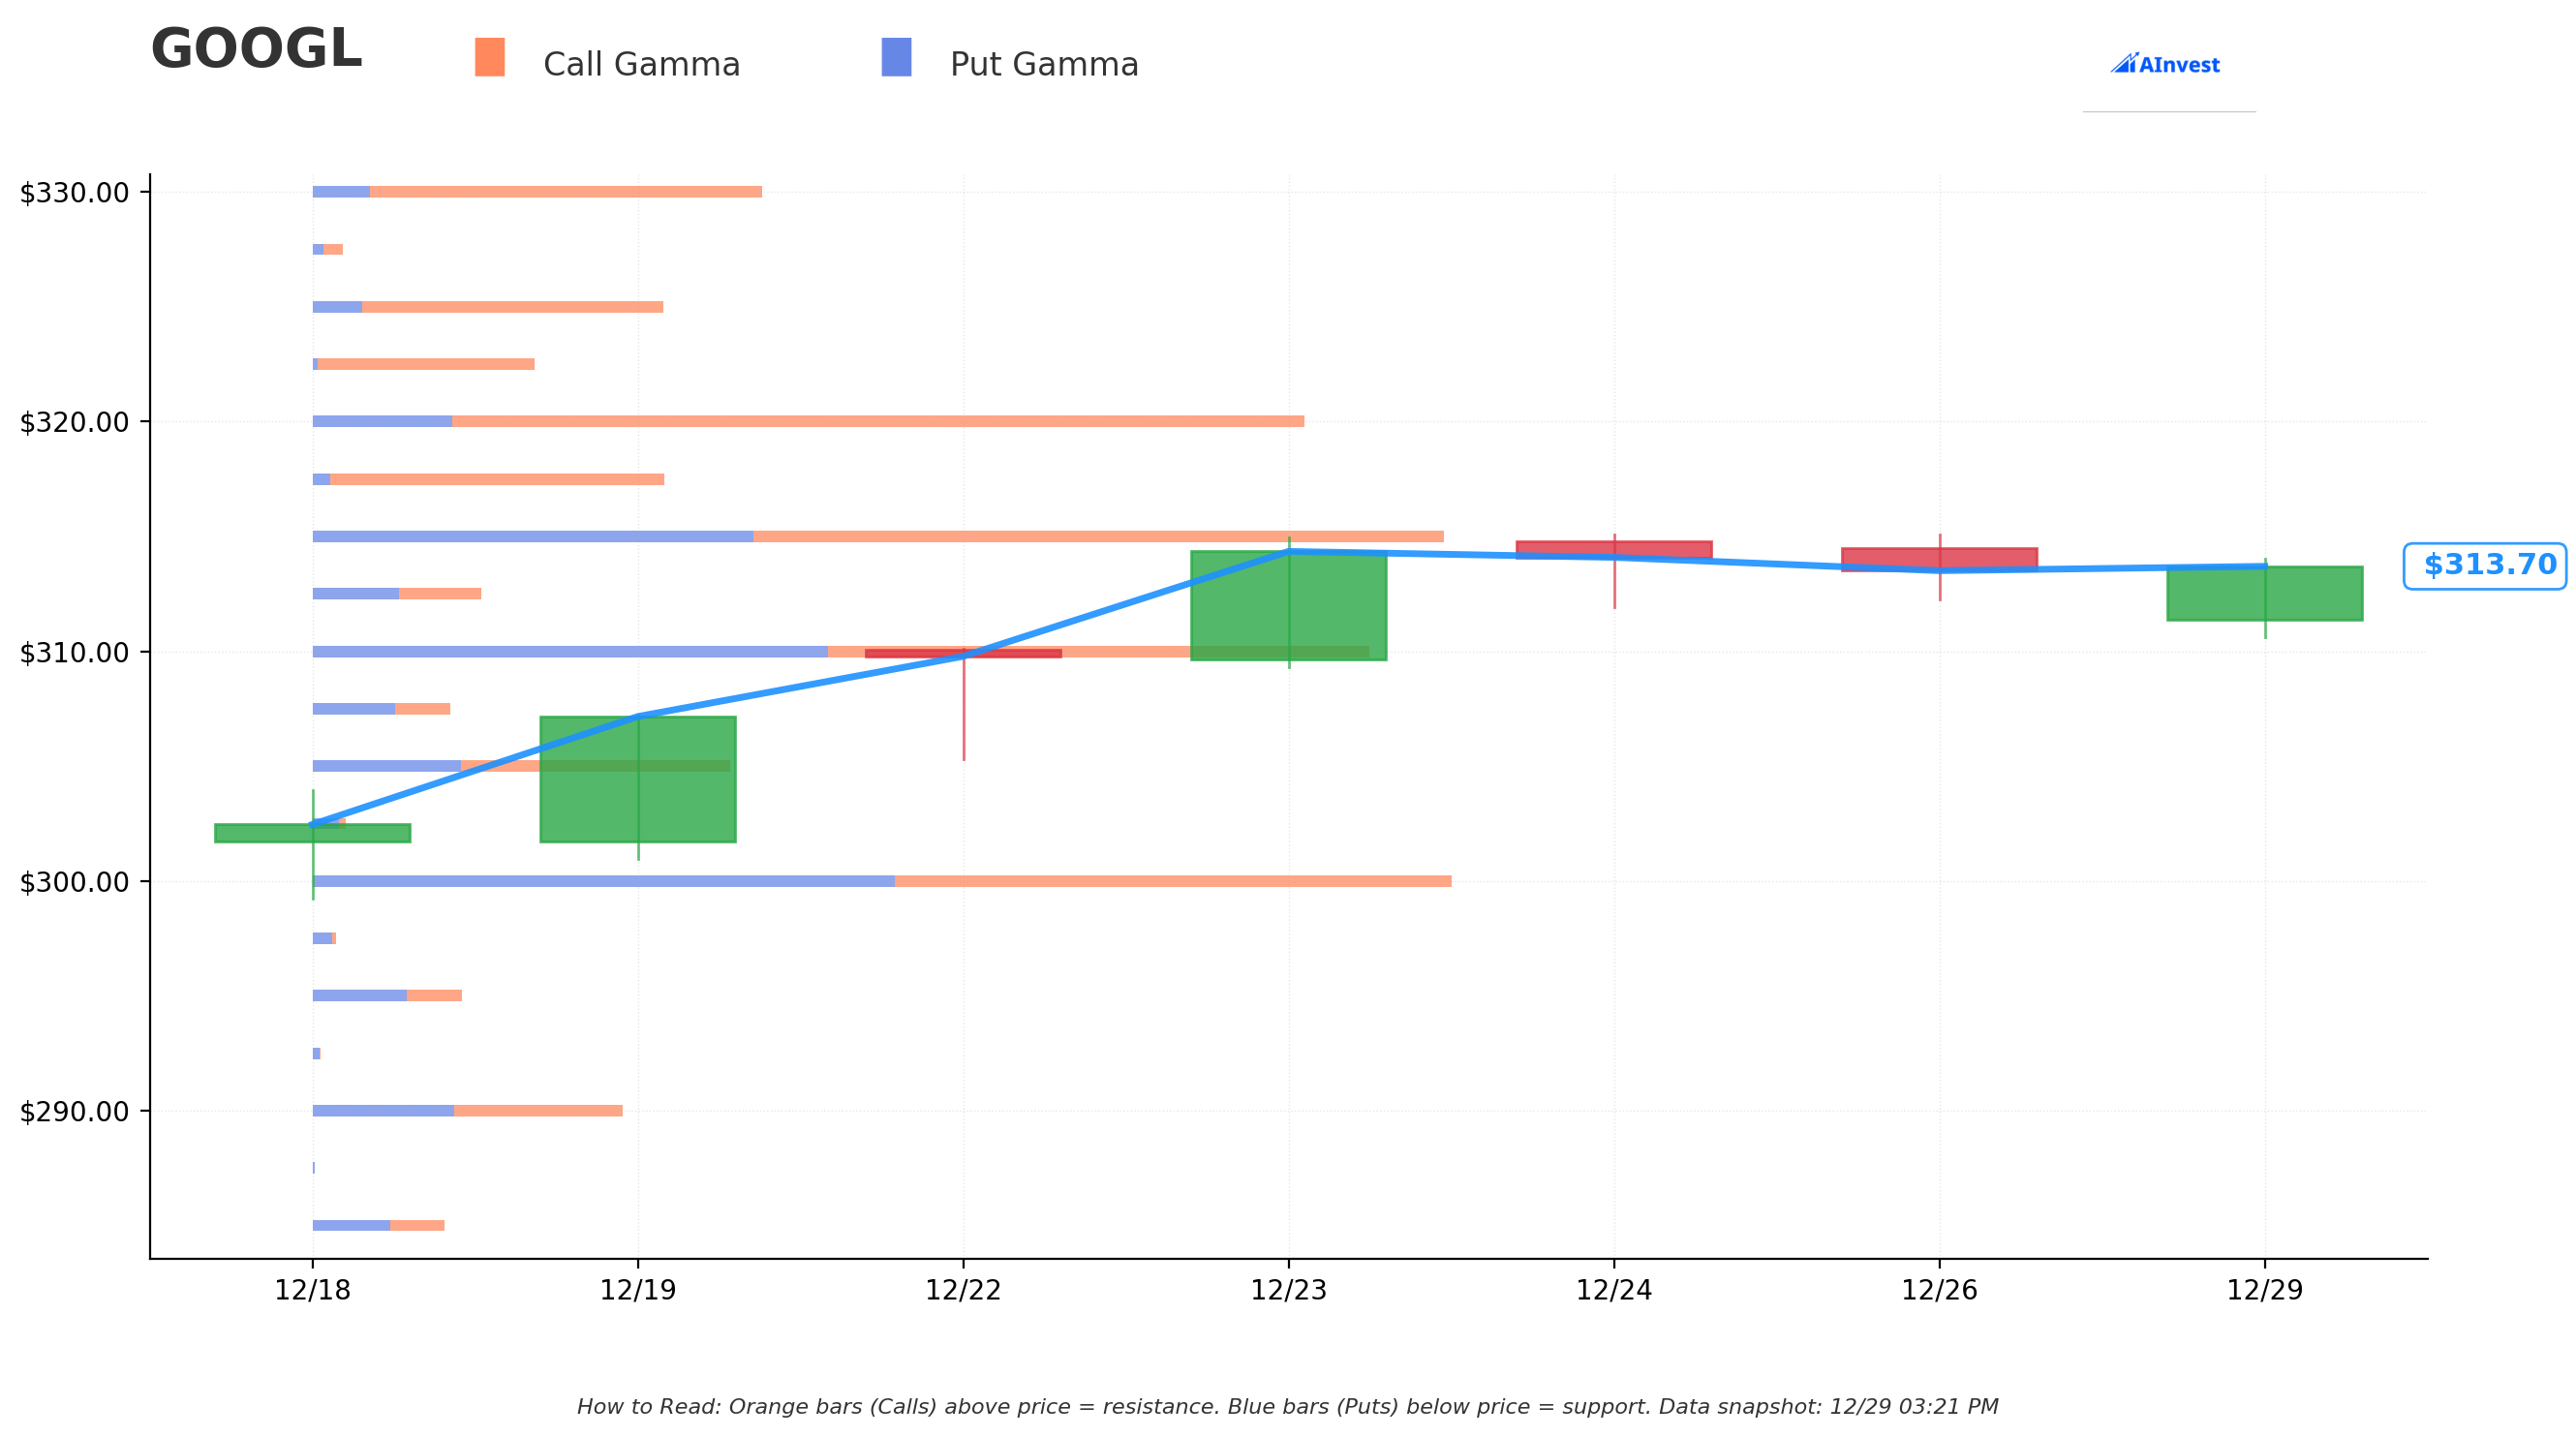
Gamma Exposure Levels (from live GEX data):
Critical Finding: GEX data shows minimal dealer gamma exposure—no significant gamma walls at key strikes. This indicates:
- Low institutional hedging activity in near-term options
- Potential for increased volatility without gamma dampening effects
- Absence of clear support/resistance from options market makers
- Price action driven more by fundamentals and momentum than dealer hedging flows
What Empty Gamma Tells Us: Unlike high-volume names like NVDA or SPY where gamma exposure creates natural pin levels, GOOGL's options market is relatively quiet. This suggests institutional positioning is primarily in stock, not options—consistent with the profile of long-term holders taking profits. The lack of gamma walls means technical support/resistance levels from moving averages and prior consolidation zones matter more than options-driven dynamics.
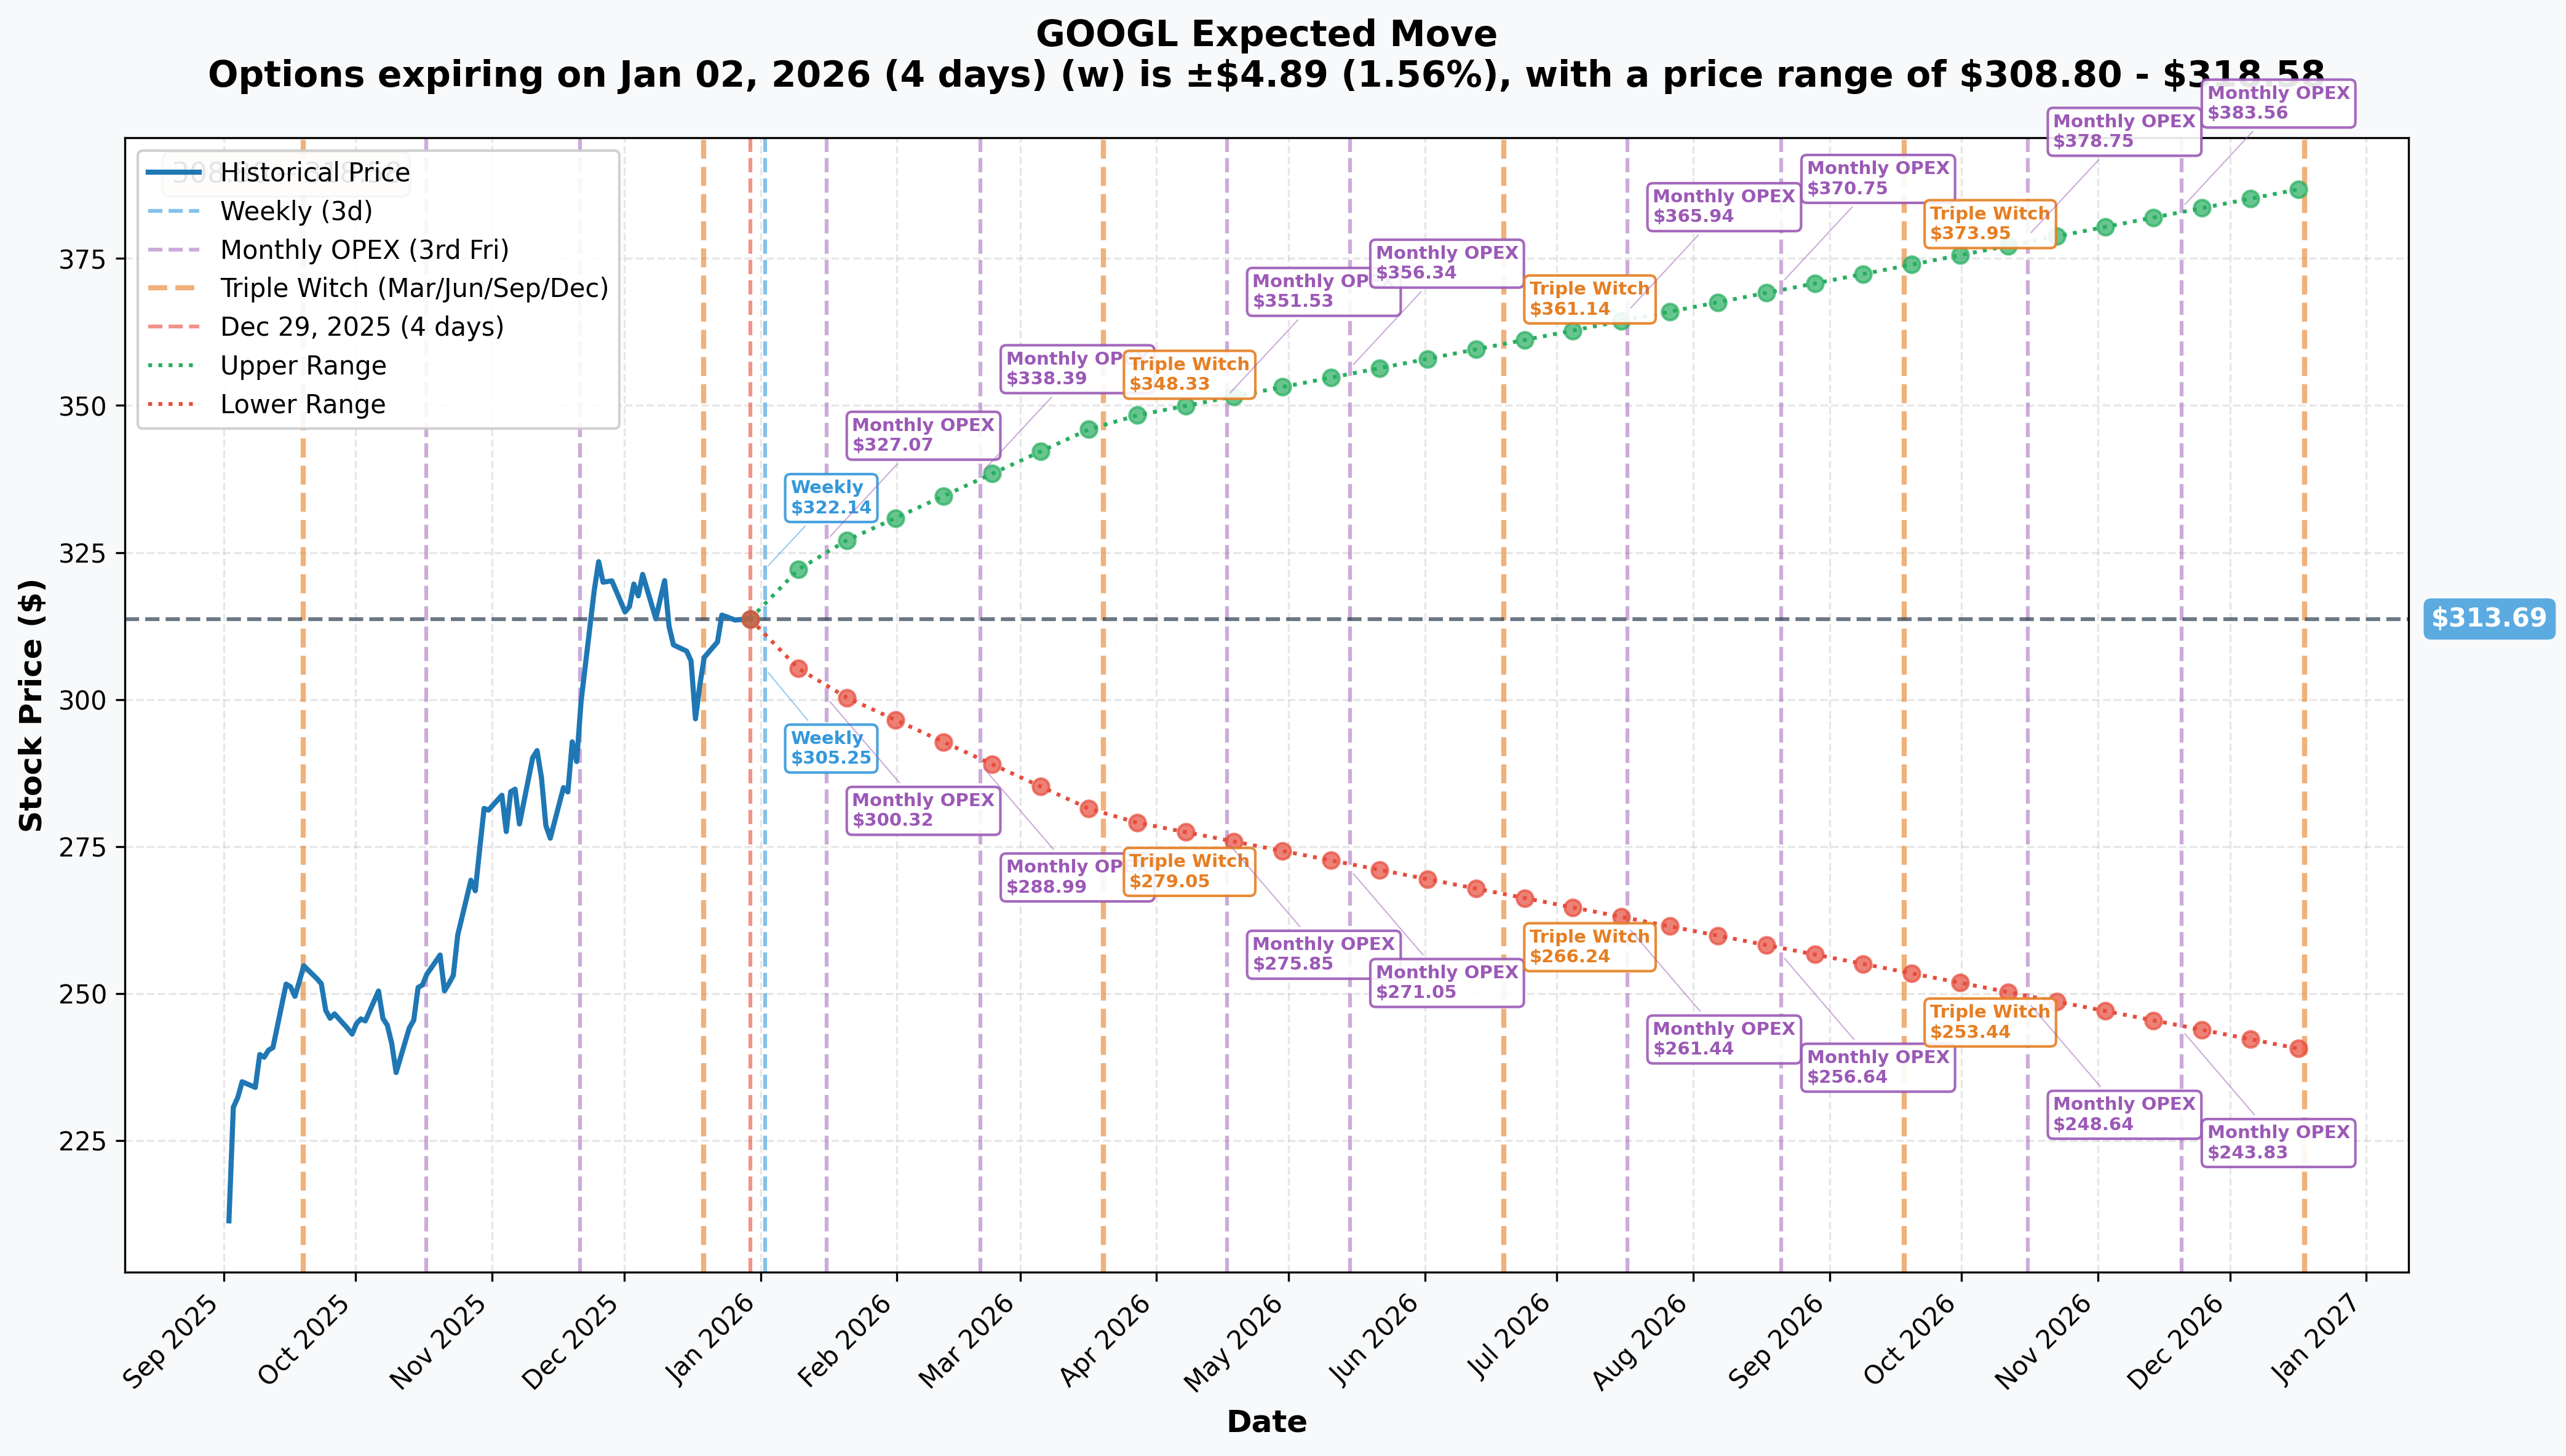
Implied Volatility & Expected Moves:
| Timeframe | Expiration | Implied Move | Price Range | Events |
|---|---|---|---|---|
| Weekly | Jan 2, 2026 | ±1.56% | $308.80 - $318.58 | New Year rollover |
| Monthly | Jan 16, 2026 | ±3.83% | $301.69 - $325.70 | Pre-earnings positioning |
| Monthly | Feb 20, 2026 | ±5.32% | $288.99 - $338.39 | Post-earnings, Monthly OPEX |
| Quarterly | Mar 20, 2026 | ±10.72% | $280.07 - $347.31 | Triple Witch, full digestion |
February Expiration Math: The monthly implied move of ±5.32% puts the expected range at $288.99 (downside) to $338.39 (upside) by February 20th. The trader's $260 strike sits $28.99 below the lower bound of the implied range, suggesting near-zero probability the calls expire worthless. The trader captured substantially all intrinsic value and avoided holding through the February 3 earnings announcement, which historically triggers ±5-8% moves.
🔥 Catalysts: What's Driving This Trade
🗓️ IMMEDIATE: Q4 2025 Earnings (February 3, 2026)
Confirmed Date: Tuesday, February 3, 2026 after market close (Nasdaq earnings calendar)
Wall Street Consensus:
- Expected EPS: $2.63
- Key Debates:
- Can Google Cloud sustain 34%+ growth rates? BMO expects 39% (MarketBeat forecast)
- Will CapEx guidance exceed $100B for 2026 as feared? (SaaStr Cloud analysis)
- Gemini 3 enterprise adoption metrics vs. 650M consumer MAU
- AI Overviews monetization progress (CTR down 34.5% when present) (Seer Interactive CTR study)
Q3 2025 Context (October 29): Alphabet delivered a historic quarter, crossing $100 billion in quarterly revenue for the first time (SEC filing):
| Metric | Q3 2025 | YoY Change | vs. Consensus |
|---|---|---|---|
| Revenue | $102.3B | +16% | Beat ($99.96B expected) |
| EPS | $2.87 | +35% | Beat ($2.26 expected) |
| Google Cloud | $15.2B | +34% | Strongest growth since 2021 |
| YouTube Ads | $10.26B | +15% | Beat $10.01B consensus (Variety YouTube Q3) |
The stock jumped 6%+ in after-hours trading. Expectations are now significantly elevated for Q4.
Why This Matters for the Trade: By exiting before earnings, the trader avoids:
- IV crush post-announcement (typically 30-50% compression)
- Binary execution risk on CapEx guidance—market fears $100B+ guidance
- Potential negative reaction to Search market share loss (now below 90% for first time since 2015) (Search Engine Land AI Overviews data)
- Theta decay acceleration in final 17 days post-earnings
📈 MAJOR: Gemini 3 AI Leadership & Monetization (2026)
AI Reversal Narrative: Google executed one of tech's most impressive pivots in 2025 (Yahoo Finance AI race):
- January 2025: Perceived as second/third to OpenAI in AI race
- December 2025: Holds 4 of top 10 AI models on LLMArena; OpenAI's best ranks eighth
- Gemini 3 Flash: 3x faster than predecessor, 60% cheaper than OpenAI/Anthropic
- User Base: 650 million monthly active users processing 7 billion tokens per minute
Gemini Advertising Rollout (2026): Google has signaled to advertisers that Gemini will begin displaying ads in 2026 (CNBC quotes):
- Monetization Potential: New high-margin revenue stream from 650M MAU base
- Ad Integration: Similar to Search monetization model but in conversational AI interface
- Enterprise Adoption: 85,000 enterprise customers building with Gemini (35x YoY growth) (SaaStr Cloud analysis)
Competitive Context: OpenAI CEO Sam Altman reportedly declared "code red" to match Google's models. OpenAI also launched ChatGPT Atlas browser to compete directly with Chrome (CNBC OpenAI browser).
TPU Ironwood Strategic Moat: Google's seventh-generation TPU launched in November 2025 provides 10x peak performance improvement (Google Cloud blog):
- Anthropic committed to 1 million Ironwood TPUs for Claude
- Meta signed $10B+ six-year cloud deal potentially including TPU access (CNBC TPU secret weapon)
💰 MAJOR: Google Cloud Backlog Conversion ($155B)
Q3 2025 Cloud Performance: Google Cloud's pipeline grew 46% sequentially to $155 billion (SEC filing):
- More $1B+ deals closed in 9 months of 2025 than all of 2023-2024 combined
- 34% revenue growth (acceleration from 28% in Q1)
- KPMG partnership: $100M investment over 4 years
- Free Cash Flow of $24.5 billion in Q3
Full-Stack AI Advantage:
- Models (Gemini 3)
- Infrastructure (TPU Ironwood: 10x performance improvement)
- Distribution (3B+ Android devices, Chrome browser)
- Monetization (Search, YouTube, Cloud, upcoming Gemini ads)
Market Context: AWS and Azure maintain market share leadership, but Google Cloud is the fastest-growing major cloud provider. The $155B backlog represents multi-year revenue visibility.
🚗 MEDIUM-TERM: Waymo Funding Round (Q1 2026)
Waymo Expansion Trajectory: Alphabet's autonomous driving unit seeks $15 billion at a $100 billion valuation (vs. $45B in October 2024) (Electrek Waymo fundraise):
- Current run rate: 450,000+ weekly rides across 6 cities (CNBC Waymo expansion)
- 2026 expansion: Denver, Miami, Nashville, London, Seattle, Washington DC
- Target: 1 million weekly rides by end of 2026
Significance: A successful $100B valuation would represent a major option value unlock for GOOGL shareholders and validate the Other Bets segment that has historically dragged on consolidated margins. This catalyst sits beyond the February 20 expiration but may influence sentiment into earnings.
🌍 Negative Catalysts & Risks
1. Antitrust Appeals (2026-2027 Timeline)
U.S. DOJ Case:
- Judge Amit Mehta ruled Google not required to divest Chrome browser (NPR antitrust ruling)
- Ordered end to exclusive default search deals but allowed continued payments to partners
- Final remedies formalized December 5, 2025; appeals timeline extends through 2027 (CNBC remedies finalized)
EU Fines:
- $4.1B Android fine upheld by European Court of Justice (IT Daily Android fine)
- $3.45B AdTech fine under appeal (CNBC EU fine)
Market Impact: Remedies create ongoing uncertainty, but Chrome divestiture avoided in September ruling triggered relief rally.
2. AI Search Disruption Accelerating
Google's search dominance faces unprecedented pressure (Content Grip search decline):
| Metric | 2024 | 2025 | Change |
|---|---|---|---|
| Google Global Share | ~92% | ~89% | First drop below 90% since 2015 |
| ChatGPT General Search Share | ~4% | 12.5% | +213% |
| Search Queries Monthly (competitive AI) | 125M | 780M | +524% |
| Google General Info Share | 73% | 66.9% | -6.1 pts (Feb-Aug 2025) |
Click-Through Rate Impact: Studies show 34.5% CTR decrease when AI Overviews appear in search results (Seer Interactive CTR study). Google's AI Overviews now appear in 16-25% of queries (peaked July 2025) (Search Engine Land data).
3. Capital Expenditure Burden
- 2025 CapEx: $91-93 billion (SEC filing)
- 2026 CapEx: Expected to exceed $100 billion (SaaStr analysis)
- Free Cash Flow Pressure: Q3 FCF of $24.5B under pressure from infrastructure investments
MIT study finding: "95% of organizations report no measurable AI return yet" (Seeking Alpha GOOGL analysis)—raising questions about ROIC on massive spending.
4. Valuation & "Crowded Trade" Concerns
- P/E Ratio: 30.92x vs. 10-year average of 27.81x (MacroTrends P/E data)
- Morningstar: "Surging expectations have made the stock a crowded trade" (Morningstar analysis)
- Counterpoint: Bulls cite relative value at 28.9x forward P/E vs. peers at 48.9x
🎯 Price Targets & Probabilities
Analyst Consensus
Wall Street Targets:
- Average Price Target: $327.42 (+4.8% upside from $312.25) (TipRanks forecast)
- Implied Upside: Modest given 63% YTD rally already achieved
- Range: $236 (bear case) to $400 (Pivotal Research bull case)
- Rating: 27 Buy, 7 Hold, 0 Sell (Strong Buy)
Recent Upgrades:
| Firm | Action | Price Target | Rationale |
|---|---|---|---|
| Pivotal Research | Raised | $400 | Highest on Street (MarketBeat) |
| JPMorgan | Raised | $385 | AI leadership validation |
| Guggenheim | Raised | $375 | Cloud backlog strength |
| Wedbush | Raised | $350 | Full-stack AI advantage |
| Truist | Raised | $350 | Gemini 3 monetization |
| BMO Capital | Raised | $343 | "Top Pick"; Cloud estimates raised |
Technical Price Targets (Based on Implied Move)
Bullish Scenario (40% probability):
- Near-Term Target: $325 (retest November all-time highs)
- Post-Earnings Target: $338 (February implied move upper bound)
- Catalyst Path: Q4 beat on Cloud strength → CapEx guidance in-line → Gemini monetization timeline
Base Scenario (45% probability):
- Range: $300-$320 (current consolidation zone)
- February OPEX: $310-$330 (modest upside with volatility)
- Catalyst Path: In-line Q4 results, elevated CapEx guidance, continued Search share loss concerns
Bearish Scenario (15% probability):
- Downside Target: $289-$300 (February implied move lower bound)
- Support Levels: $300 (psychological), $289 (implied support)
- Catalyst Path: Disappointing Cloud growth, CapEx shock above $100B, earnings miss on Search/YouTube weakness
February 20, 2026 Probabilities (Options-Implied)
Using the implied volatility surface:
| Price Level | Probability | Strike Relevance |
|---|---|---|
| Above $338 | ~10% | Upper implied range breakout |
| $325-$338 | ~30% | Retest/break all-time highs |
| $310-$325 | ~35% | Consolidation continues (base case) |
| $289-$310 | ~20% | Pullback on earnings disappointment |
| Below $289 | ~5% | Downside surprise |
Trader's Exit Analysis: By selling $260 calls at $146.10 with spot at $312.25, the trader captured $52.25 intrinsic value + $3.15 time premium. The probability of GOOGL falling below $260 by February 20 is effectively zero based on implied volatility. The trader maximized value extraction.
💡 Trading Ideas
🛡️ CONSERVATIVE: Wait for Post-Earnings Clarity
Cash Position / Small Defined-Risk Trade
- Strategy: Avoid chasing after 63% rally; wait for February 3 earnings
- Entry Trigger: Pullback to $300-$305 support zone post-earnings
- Alternative: Small bull put spread if bullish (sell $290 put, buy $280 put for credit)
- Max Risk: Limited to spread width minus credit received
- Breakeven: $290 minus credit
Why This Works:
- Avoid IV Crush: Don't pay elevated premium into earnings
- Better Entry: 63% YTD gains suggest consolidation or pullback more likely than breakout
- Gamma Absence: No dealer support levels; technicals matter more
- Risk Management: Preserve capital for higher-conviction post-catalyst opportunities
Ideal For: Traders who believe GOOGL's fundamentals remain strong but want better entry points and clearer risk/reward after earnings volatility settles.
⚖️ BALANCED: Iron Condor for Range-Bound Action
February 20, 2026 Iron Condor
- Sell $338 call (upper implied bound) @ $8.50
- Buy $345 call @ $4.20
- Sell $289 put (lower implied bound) @ $7.30
- Buy $280 put @ $3.80
- Net Credit: $7.20 per spread ($720 total)
- Max Profit: $720 if GOOGL stays between $289-$338 at expiration
- Max Loss: $280 (spread width minus credit)
- Profit Range: $281.80 - $345.20
Why This Works:
- IV Expansion Trade: Sell premium into earnings IV spike, benefit from post-earnings crush
- Implied Range Alignment: Strikes match February ±5.32% implied move
- Theta Capture: Accelerating time decay in final 53 days
- Empty Gamma Edge: No dealer hedging flows to disrupt range
Risk Management:
- Close at 50% max profit ($360 credit remaining)
- Adjust if GOOGL breaks $295 (downside) or $335 (upside) before earnings
- Consider closing before earnings if IV expansion yields early profit
Ideal For: Experienced traders comfortable with multi-leg spreads who believe GOOGL consolidates into/through earnings with elevated volatility but limited directional movement.
🔥 AGGRESSIVE: Bearish Put Spread (Contrarian)
February 20, 2026 Bear Put Spread
- Buy $310 put @ $12.40
- Sell $290 put @ $7.30
- Net Debit: $5.10 ($510 per spread)
- Max Profit: $14.90 ($1,490 per spread) if GOOGL ≤ $290 at expiration
- Max Loss: $510 (debit paid)
- Breakeven: $304.90
- Return on Risk: 192% at max profit
Why This Works:
- Contrarian Bet: Fade the 63% rally and "crowded trade" warnings (Morningstar)
- Catalyst Risk: CapEx guidance shock above $100B could trigger selloff
- Search Share Loss: First drop below 90% market share since 2015 may spook investors
- Valuation Reset: 30.92x P/E vs. 27.81x 10-year average suggests room for multiple compression
Profit Scenarios:
- Modest Pullback to $305: Profit of ~$250 per spread (49% ROI)
- Earnings Disappointment to $295: Profit of ~$990 per spread (194% ROI)
- Sharp Selloff to $290: Max profit of $1,490 per spread (292% ROI)
Ideal For: Contrarian traders who believe the market has overpriced GOOGL's near-term prospects and expect a pullback on elevated CapEx or Search concerns. High-conviction trade with defined risk.
📊 ALTERNATIVE: Calendar Spread for IV Play
Earnings Volatility Calendar
-
Front Month (January 30, 2026 weekly - expires before earnings):
- Sell 1x $312 call @ $9.50
-
Back Month (February 20, 2026 - captures earnings):
- Buy 1x $312 call @ $16.80
-
Net Debit: $7.30 ($730 per spread)
-
Max Profit: Varies (if GOOGL stays near $312 and IV spikes into earnings)
-
Max Loss: $730 if GOOGL moves dramatically before Jan 30
-
Breakeven Range: Approximately $300-$325 at front-month expiration
Why This Works:
- Volatility Expansion: Benefits from IV spike into Feb 3 earnings
- Theta Capture: Front-month decay accelerates in final week
- Neutral Positioning: Profits from GOOGL consolidation near current levels
- Post-Earnings Optionality: Keep February call for post-earnings move
Ideal For: Traders who want to monetize expected IV expansion into earnings while maintaining exposure to post-announcement directional move.
⚠️ Risk Factors
🌍 Regulatory & Antitrust Overhang
DOJ Appeals Timeline:
- Google plans to appeal liability decision; could reach Supreme Court (CNBC remedies)
- Appeals process extends through 2026-2027
- Chrome divestiture avoided for now, but structural uncertainty persists
EU Regulatory Pressure:
- $4.1B Android fine upheld (IT Daily)
- $3.45B AdTech fine under appeal (CNBC EU fine)
- Q3 2025 included $3.5B charge for EC fine
Impact on This Trade: Negative surprise in appeals process or new regulatory actions before February expiration would pressure stock. However, Chrome divestiture avoidance in September shows worst-case scenarios may be off the table.
📊 Capital Expenditure & Profitability Concerns
Massive CapEx Trajectory:
- 2025 CapEx: $91-93B (SEC filing)
- 2026 CapEx: Expected to exceed $100B (SaaStr)
- Free Cash Flow pressure from infrastructure investments
- MIT study: "95% of organizations report no measurable AI return yet" (Seeking Alpha)
Why This Matters: If Q4 earnings guidance shows 2026 CapEx materially above $100B with extended timeline to Cloud profitability, market could punish stock despite AI leadership. The $155B Cloud backlog provides revenue visibility, but ROIC on massive spending remains questioned.
Impact on This Trade: CapEx shock could trigger -5% to -8% gap down post-earnings, testing $289 February support. The exited trader avoided this binary risk.
🥊 AI Search Disruption Accelerating
Market Share Erosion:
- Google global search share dropped to ~89% (first time below 90% since 2015) (Search Engine Land)
- ChatGPT captured 12.5% of general search queries (up from 4% in 2024) (Content Grip)
- AI search alternative queries grew 524% year-over-year
- Google's general information search share fell from 73% to 66.9% (Feb-Aug 2025)
Monetization Challenges:
- 34.5% CTR decrease when AI Overviews appear (Seer Interactive)
- AI Overviews now in 16-25% of queries
- Zero-click searches increase reduces ad impression opportunities
Competitive Threats:
- OpenAI launched ChatGPT Atlas browser to compete with Chrome (CNBC OpenAI browser)
- Established AI alternatives gaining enterprise traction
Impact on This Trade: If Q4 earnings show Search revenue deceleration or management acknowledges accelerating cannibalization from AI Overviews, stock could gap down. Gemini 3 leadership provides offset narrative, but Search remains ~55% of revenue.
📉 Valuation & Crowded Trade Risk
Stretched Metrics:
- P/E Ratio: 30.92x vs. 10-year average of 27.81x (MacroTrends)
- YTD Performance: +63% significantly outpacing fundamentals
- Market Cap: $3.78T (4th largest globally) (Companies Market Cap)
Analyst Warnings:
- Morningstar: "Surging expectations have made the stock a crowded trade" (Morningstar)
- Seeking Alpha: "Alphabet Running Too Hot Into 2026" (Seeking Alpha)
Counterpoint: Bulls cite relative value at 28.9x forward P/E vs. peers at 48.9x (MacroTrends), arguing GOOGL deserves premium given Cloud acceleration and AI leadership.
Impact on This Trade: "Crowded trade" dynamics suggest limited upside near-term. If institutional momentum buyers rotate to cheaper opportunities, GOOGL could consolidate or pullback even without fundamental deterioration. The trader's exit signals recognition of this risk.
📆 Theta Decay & Volatility Crush
Time Decay Profile:
- Current Theta: ~$0.60 per contract per day (53 days to expiration)
- Accelerated Decay: Theta accelerates to ~$1.20/day in final 30 days
- Remaining Time Value: Only $3.15 per contract
Post-Earnings Volatility Crush:
- February implied volatility likely spikes 10-20% into earnings (Feb 3)
- Post-earnings IV crush typically 30-50% the day after
- Deep ITM calls have lower vega (~0.20 vs. 0.45 for ATM), but still affected
Why Trader Exited: By selling 17 days before earnings, the trader:
- Captured remaining $3.15 time value before accelerated decay
- Avoided IV crush that would reduce option value even if stock stays flat
- Locked in intrinsic value ($52.25) without binary earnings risk
🎯 Bottom Line
What This Trade Signals: This $28M call exit isn't a bearish fundamental call—it's strategic profit-taking by a sophisticated trader recognizing optimal risk/reward dynamics. After GOOGL's spectacular 63% rally that crowned it the 2025 Magnificent 7 champion, with the stock at $312.25 and $260 calls deep ITM (only $3.15 time premium remaining), the opportunity cost of holding through February 3 earnings and accelerating theta decay justifies exiting.
The Bull Case: GOOGL enters 2026 with exceptional fundamental momentum: Gemini 3 leads AI benchmarks (4 of top 10 models), Google Cloud accelerates to 34% growth with $155B backlog, and Waymo pursues $100B valuation. The TPU Ironwood advantage (10x performance improvement) provides infrastructure moat against Nvidia dependency. At 28.9x forward P/E vs. peers at 48.9x, relative valuation supports the bull thesis despite the massive YTD run.
The Bear Case: Elevated CapEx guidance expectations ($100B+ for 2026) create binary earnings risk. Search market share dropped below 90% for first time since 2015 as ChatGPT captured 12.5% of queries, with CTR down 34.5% when AI Overviews appear. Multiple analysts flagged "crowded trade" concerns with 30.92x P/E vs. 27.81x 10-year average. Antitrust appeals extend uncertainty through 2027.
Retail Takeaway: You don't need $28M to express similar views. The iron condor ($289/$280 put, $338/$345 call for $7.20 credit) captures range-bound action with defined risk. The bear put spread ($310/$290 for $5.10) offers 192% ROI if you believe the 63% rally has run too far. For bulls waiting for clarity, sitting in cash until post-earnings ($300-305 entry) provides better risk/reward than chasing at all-time highs.
Final Verdict: This trade represents textbook profit management on a deep ITM long call position after a massive rally. The empty gamma positioning (no dealer support levels) and elevated valuation metrics suggest the path of least resistance is sideways-to-down into earnings, not continuation of the 63% rally. Whether this signals near-term top or healthy consolidation before next leg higher, the message is clear: smart money is banking gains rather than risking earnings volatility for the remaining $3.15 time premium.
Risk Disclosure: Options trading involves substantial risk and is not suitable for all investors. The strategies outlined above can result in total loss of invested capital. This analysis is for informational purposes only and does not constitute investment advice. Past performance of similar trades is not indicative of future results. Always conduct your own due diligence and consult with a licensed financial advisor before trading options.
🔗 Additional Resources
Option Analysis: Chart Analysis - $260 Strike, Feb 2026 Expiry
Full Stock Analysis: GOOGL Deep Dive
Data Sources:
- Trade Data: Proprietary options flow scanner
- Gamma Exposure: Real-time GEX aggregation from OPRA feed
- Implied Volatility: Options chain data from exchange APIs
- Catalyst Research: GOOGL_catalysts.md with inline source citations
- Technical Data: CNBC quotes, MacroTrends, Companies Market Cap
- Analyst Data: TipRanks, MarketBeat, Stock Analysis consensus
Analysis completed: December 29, 2025 | GOOGL Spot: $312.25 | Market Cap: $3.78T