🔥 HIMS Modified Call Ratio Spread - $8.4M Institutional Play!
📅 October 10, 2025 | 🔥 Unusual Activity Detected
🎯 The Quick Take
Someone just executed a $8.4M modified call ratio spread on HIMS with 4,420 contracts across three strikes, all at 11:51:47 AM today! This sophisticated institutional play collected $1.17M in net premium while betting HIMS rallies toward $60-$65 by November 21st, right after earnings. Translation: Big money is betting on controlled upside through earnings - max profit at $60, but with capped risk below and UNCAPPED risk above $72.65!
📊 Company Overview
Hims & Hers Health, Inc. (HIMS) is a telehealth platform connecting patients and healthcare providers with:
- Market Cap: $13.17 Billion
- Industry: Services - Offices & Clinics of Doctors of Medicine
- Employees: 1,637
- Primary Business: Direct-to-consumer telehealth for erectile dysfunction, hair loss, skin care, mental health, and weight loss treatments
- Founded: 2017 | Headquarters: San Francisco, CA
- Business Model: Over 2 million subscribers across 50 U.S. states and European markets
💰 The Option Flow Breakdown
The Tape (October 10, 2025 @ 11:51:47):
| Time | Symbol | Side | Buy/Sell | Type | Expiration | Premium | Strike | Volume | OI | Size | Spot | Option Price |
|---|---|---|---|---|---|---|---|---|---|---|---|---|
| 11:51:47 | HIMS | MID | BUY | $55 CALL | 2025-11-21 | $3.6M | $55 | 4.6K | 2.3K | 4,420 | $54.89 | $8.15 |
| 11:51:47 | HIMS | MID | SELL | $60 CALL | 2025-11-21 | $2.7M | $60 | 5.2K | 8.7K | 4,420 | $54.89 | $6.10 |
| 11:51:47 | HIMS | MID | SELL | $65 CALL | 2025-11-21 | $2.1M | $65 | 5.3K | 6.9K | 4,420 | $54.89 | $4.70 |
Net Cash Flow:
- Pay $3,602,300 for 4,420 x $55 calls @ $8.15
- Collect $2,696,200 from 4,420 x $60 calls @ $6.10
- Collect $2,077,400 from 4,420 x $65 calls @ $4.70
- NET CREDIT: $1,171,300 (approximately $265 per spread)
🤓 What This Actually Means
This is a modified call ratio spread - actually a combination of a bull call spread plus a short call. The trader:
- Buys 4,420 $55 calls for $3.60M (bullish position)
- Sells 4,420 $60 calls for $2.70M (caps gains at $60)
- Sells 4,420 $65 calls for $2.08M (additional premium but creates risk above $65)
Profit/Loss Profile:
- Below $55: Collects full $1.17M credit (all options expire worthless)
- At $60: Maximum profit of ~$3.38M ($5 intrinsic value from $55/$60 spread + $1.17M net credit)
- At $65: Profit ~$2.17M ($10 from $55 call - $5 loss on $60 call + $1.17M credit)
- Above $65: Each $1 move higher reduces profit by $442,000 (naked short exposure on 4,420 contracts)
- Breakeven above: ~$72.65 (where losses from $65 short call wipe out gains)
This is a BULLISH bet with a twist - profits max out if HIMS rallies to $60-$65, but has UNLIMITED RISK above $72.65!
Unusual Score: EXTREME (2,556x average size) - This happens maybe once a year! The trade size is staggering compared to typical HIMS activity.
📈 Technical Setup / Chart Analysis
YTD Performance Chart
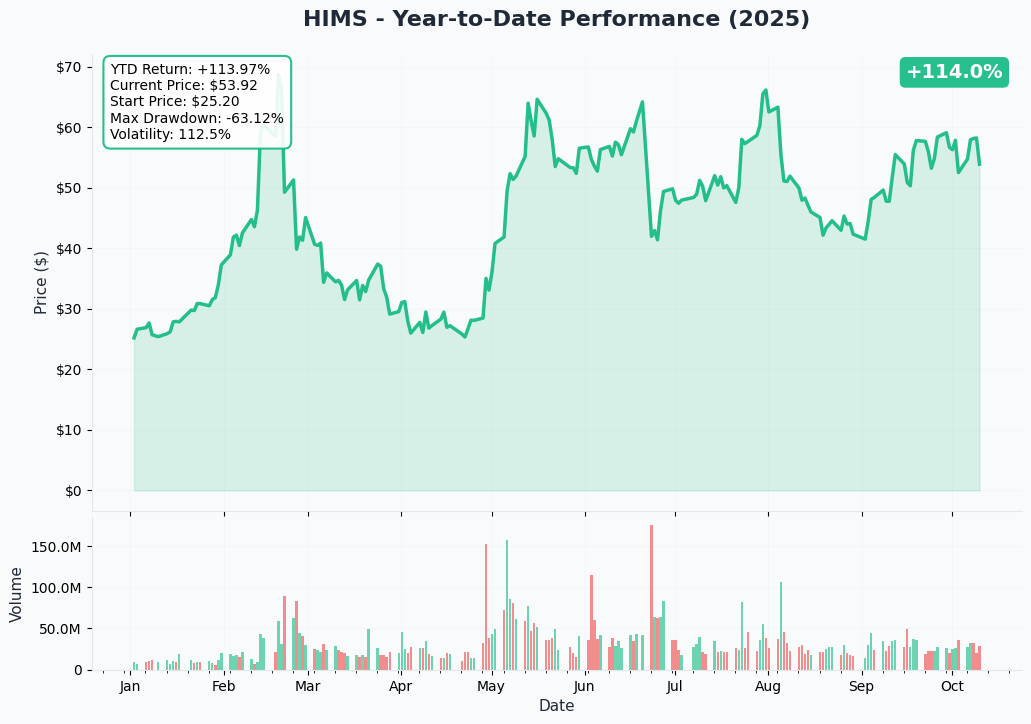
HIMS is having an absolute monster year with +115.9% YTD performance! Starting from $25.20 in January, the stock has more than doubled to current levels around $54.89.
Key observations:
- Explosive volatility: 112.5% implied volatility signals massive moves expected (particularly around earnings)
- Multi-peak pattern: Hit highs near $67 in February, June, and August before consolidation
- Current position: Trading at $54.89 after recent pullback from September highs
- Max drawdown: -63.12% from peak shows significant volatility swings
- Volume spikes: Major institutional interest at key inflection points
The chart shows a stock that's been climbing aggressively but with significant volatility - perfect for a butterfly spread that profits from controlled movement toward $60.
Gamma-Based Support & Resistance Analysis
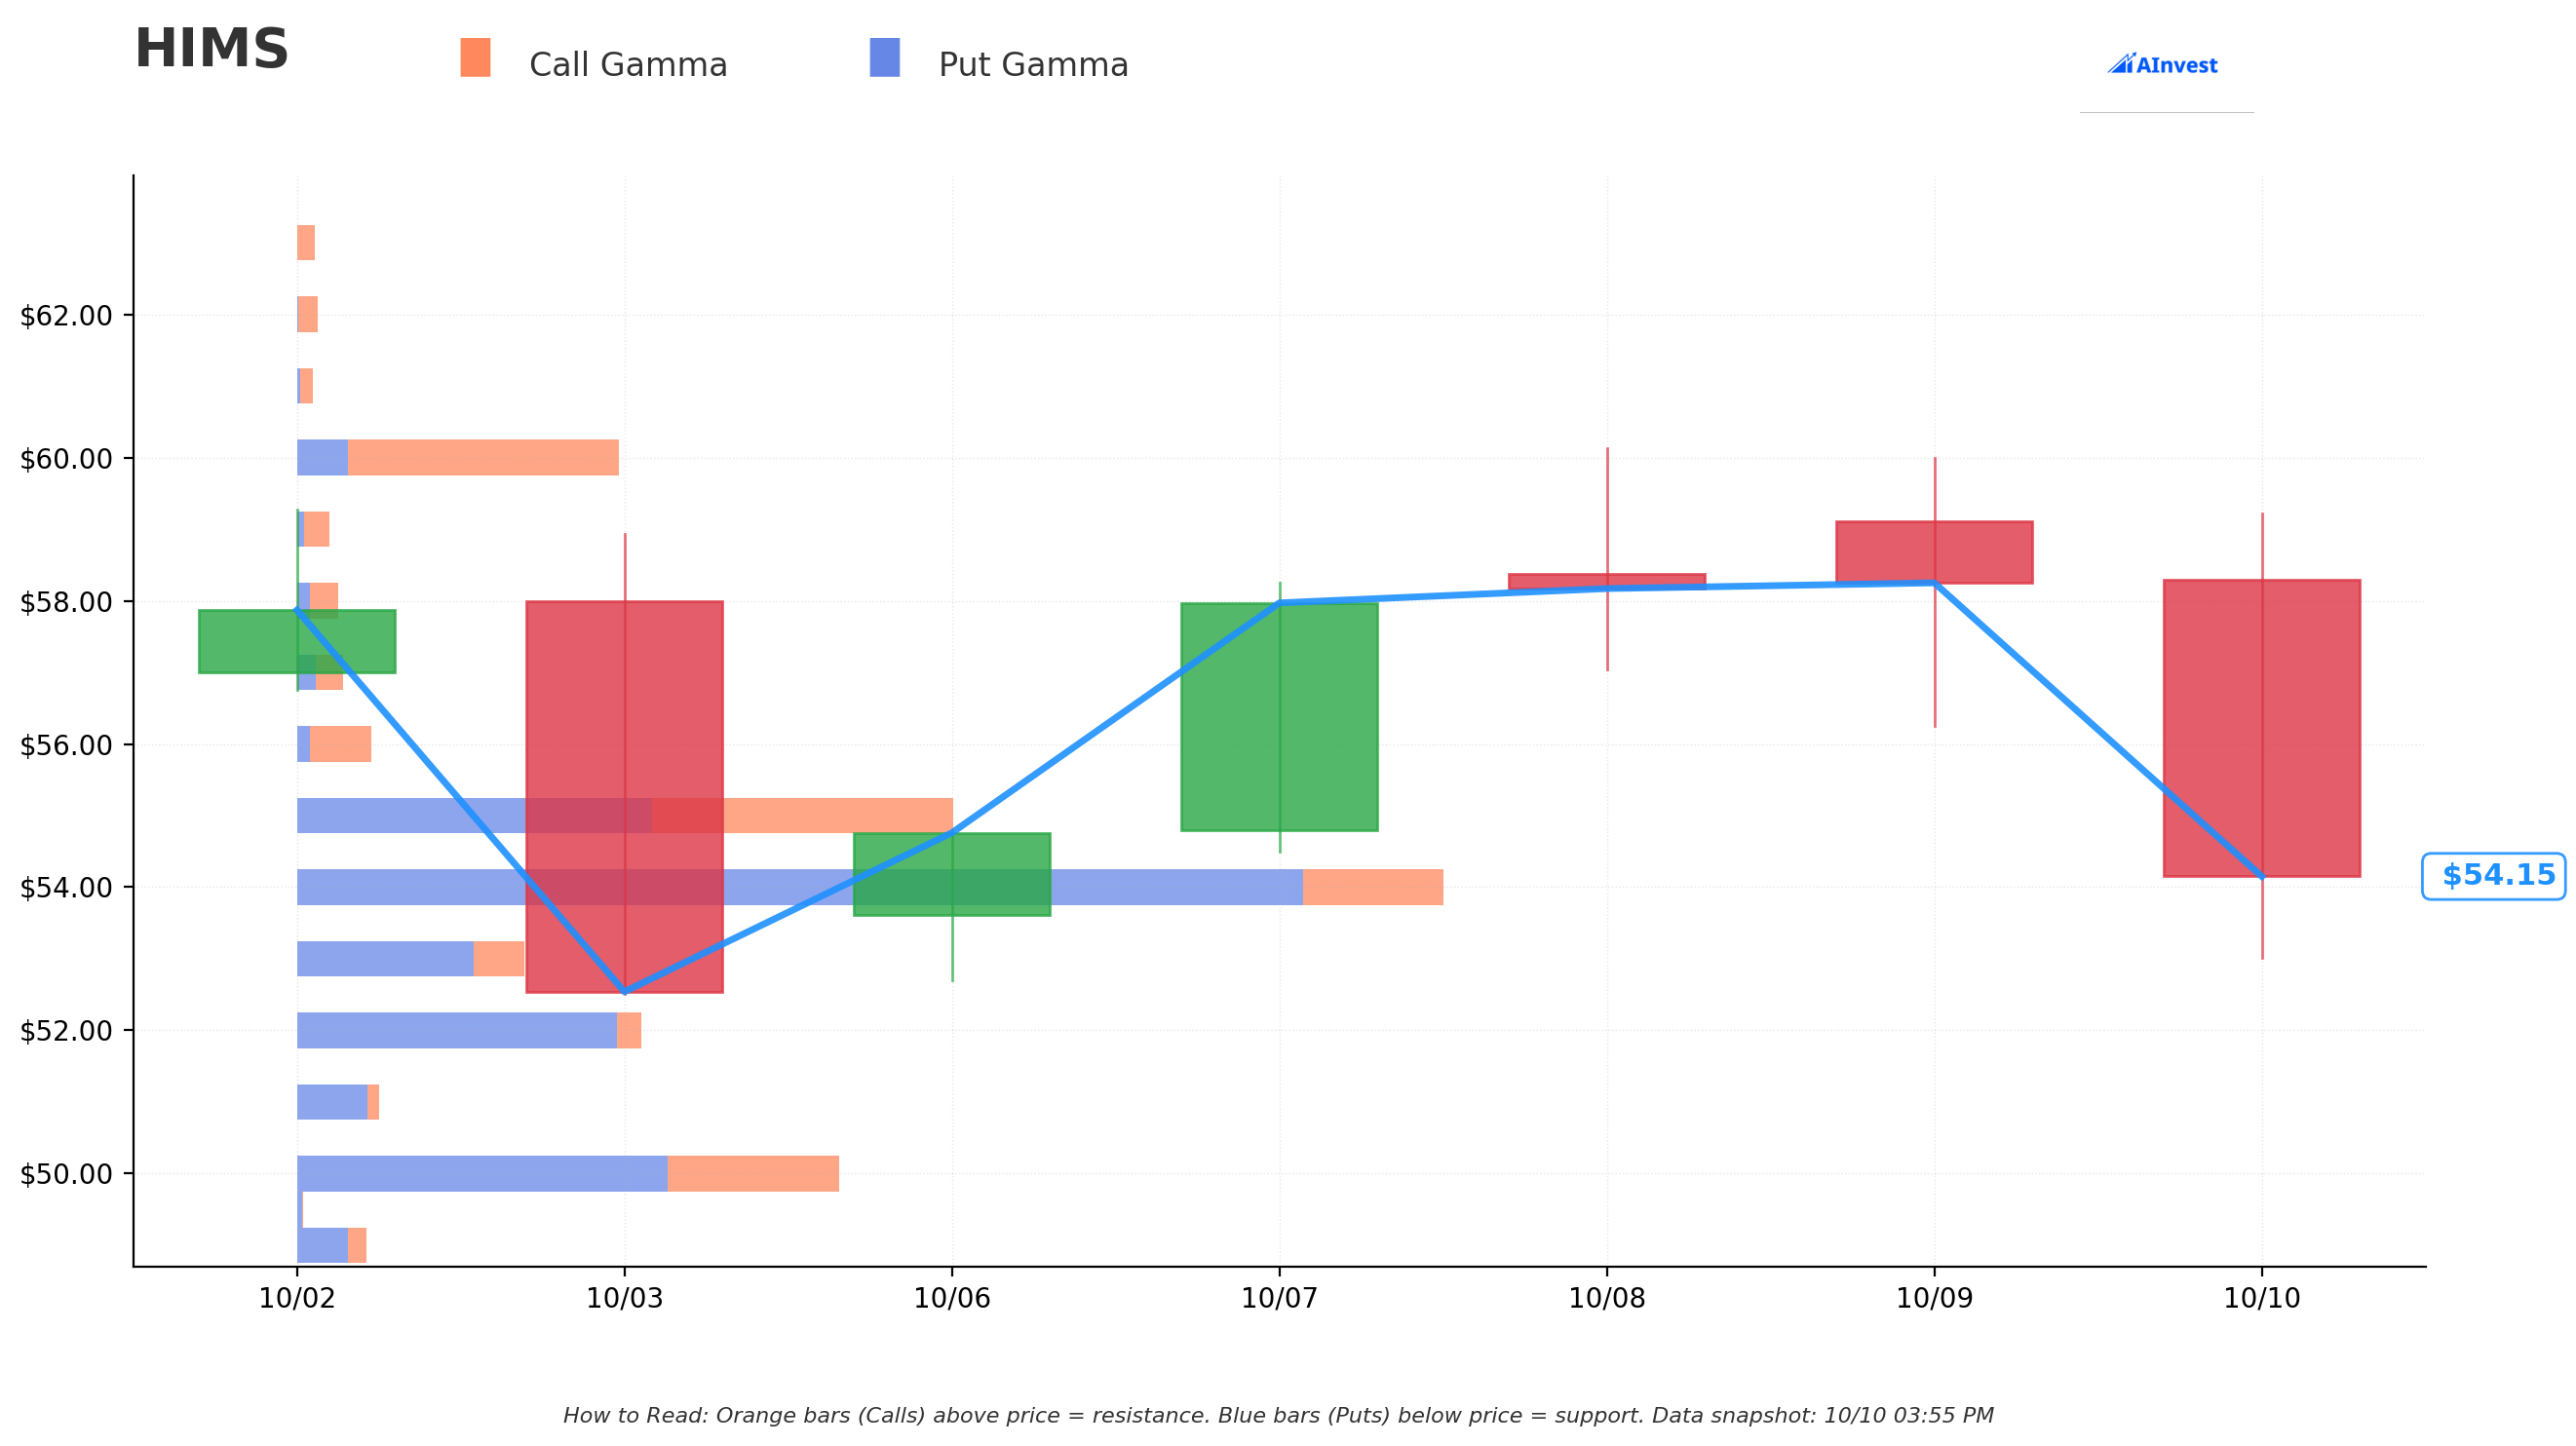
Current Price: $54.89 (Updated snapshot: October 10, 02:14 PM)
The gamma chart reveals critical levels that perfectly explain this butterfly trade structure:
Immediate Resistance Levels (Orange Bars - Call Gamma):
- $55.00: Strongest resistance with 16.16M total gamma just $0.11 above current price (0.44% away)
- $56.00: Secondary resistance at 4.52M gamma (2.27% away)
- $57.00: Moderate resistance at 4.23M gamma (4.10% away)
- $58.00: Building resistance at 4.95M gamma (5.92% away)
- $60.00: Major gamma wall at 8.95M - exactly the middle strike of this butterfly! (9.58% away)
- $65.00: Upper boundary at 3.73M gamma - exactly the upper strike! (18.71% away)
Support Levels (Blue Bars - Put Gamma):
- $54.00: Immediate support with 9.74M total gamma (1.38% below)
- $52.00: Strong floor at 8.10M gamma (5.03% below)
- $50.00: Major support at 10.75M gamma (8.69% below)
- $45.00: Deep support at 3.88M gamma (17.82% below)
Net Gamma Bias: Currently BEARISH with $60M total put gamma vs $52.6M call gamma
This gamma setup perfectly explains the trade logic:
- The $55 long calls are positioned just above current price and immediate resistance
- The $60 short calls align with a major gamma resistance wall where market makers will sell into rallies
- The $65 short calls provide upside protection at another key gamma level
- Maximum profit zone ($58-62) sits right in the controlled resistance band
🎪 Catalysts
Upcoming Events
Q3 2025 Earnings - November 3, 2025 (MarketBeat)
- Expected EPS: $0.09-0.10
- Revenue Estimate: $570-590M (StocksToTrade)
- Conference Call: 5:00 PM ET
- Critical Metric: Order trends after Bank of America reported orders down 16% YoY in September
- Timing: Just 24 days before this options spread expires on November 21st!
Testosterone Treatment Product Launch (Ongoing through 2026)
- Launched compounded enclomiphene treatments (HIMS Newsroom)
- Major Catalyst: Exclusive partnership with Marius Pharmaceuticals for Kyzatrex oral testosterone launching in 2026
- Kyzatrex has shown 96% effectiveness in restoring testosterone levels (HIMS Newsroom)
- Market Opportunity: ~20 million men in the US have low testosterone
International Expansion via ZAVA Acquisition
- Status: Acquisition closed, now integrating operations
- Adds 1.3 million active customers in Europe
- Expansion into UK, Germany, France, and Ireland
- Expected to be accretive by 2026
GLP-1 Weight Loss Program Evolution
- Projected $725+ million in GLP-1 sales for 2025
- Continues offering compounded semaglutide for eligible patients despite Novo Nordisk partnership changes
- Focus shifting to personalized and oral weight loss solutions
Recently Completed
Q2 2025 Strong Performance
- Revenue of $544.8M (up 73% YoY)
- 2.4 million subscribers (up 31% YoY in Q2 2025)
- Full year 2025 revenue guidance: $2.3-2.4B
- Adjusted EBITDA guidance: $295-335M for 2025
New Product Categories Launched
- Volumizing shampoo and conditioner line recently launched
- Expanding into longevity and sleep quality treatments
- Hormonal health treatments for both men and women
- Building out lab testing capabilities as standalone service
🎯 Price Targets & Probabilities
Using gamma levels, earnings catalyst timing, and current technical setup:
🚀 Bull Case (35% chance)
Target: $58-$62 (Sweet Spot)
- Earnings beat on revenue and subscriber growth metrics
- Strong Q4 guidance incorporating testosterone treatment momentum
- ZAVA acquisition progress update provides European growth visibility
- Breaks through $55 gamma resistance cleanly
- Settles in the $58-62 range where this butterfly makes maximum profit
Perfect scenario for this spread - could capture $400-490K in profits
😐 Base Case (45% chance)
Target: $52-$58 range
- Mixed earnings with revenue beat but margin pressure concerns
- Guidance maintains current trajectory without major upside
- Order trend concerns from BofA report addressed but not resolved
- Stays within current gamma support/resistance bands
- Stock consolidates between $54-57 levels
Butterfly still profitable in upper part of this range ($55-58)
😰 Bear Case (20% chance)
Target: $45-$52
- Earnings miss or weak Q4 guidance disappoints
- Order trend deterioration confirmed in Q3 results
- FDA regulatory concerns around compounded medications intensify
- GLP-1 revenue growth slows more than expected
- Breaks below $52 gamma support toward $50 level
Butterfly loses premium paid (~$11,713) - but risk is defined
💡 Trading Ideas
🛡️ Conservative: Simple Bull Call Spread (Defined Risk)
Play: Bull call spread (Nov 21st expiration)
Buy 10 $55 calls, sell 10 $60 calls
Risk: $2.05 per spread × 10 = $2,050 maximum loss (net debit: $8.15 - $6.10) Reward: $5.00 per spread × 10 = $5,000 max profit if HIMS closes above $60 Profit Range: $57.05 breakeven to unlimited above $60 Max Return: 144% if HIMS reaches $60 by expiration
Why this works: Captures the core bullish bet without the naked short exposure above $65. Much safer than replicating the institutional structure which has unlimited risk.
⚖️ Balanced: Pure Earnings Play
Play: Long strangle (Nov 21st expiration)
Buy $60 calls AND buy $50 puts
Risk: Total premium paid (~$800-1,000 per strangle depending on prices) Reward: Unlimited upside if big earnings beat OR downside protection if miss Break-even: Needs 15%+ move in either direction
Why this works: With 112.5% IV, earnings could create explosive moves. Strangle captures volatility expansion in either direction. Gamma levels suggest support at $50 and resistance at $60 are key battlegrounds.
🚀 Aggressive: Leveraged Earnings Bet
Play: Long calls at-the-money (Nov 21st expiration)
Buy 10-20 $55 calls
Risk: $8.15 per contract × quantity = $815-1,630 Reward: Unlimited upside if earnings catalyst drives stock higher Theta Decay: Working against you until November 3rd earnings
Why this works: If earnings surprise to the upside with strong Q4 guidance, testosterone treatment traction, or ZAVA synergies, HIMS could break above $60 toward previous highs near $67. High risk, high reward play for conviction bulls.
⚠️ Risk Factors
- Order trend concerns: BofA reports orders down 16% YoY in September 2025 - if confirmed in earnings, could pressure stock
- FDA regulatory scrutiny: Recent FDA warning letter regarding compounded semaglutide marketing creates overhang
- Analyst skepticism: Wide price target range from $28 (BofA Underperform) to $85 (bulls) shows major disagreement
- GLP-1 competitive pressure: Increasing competition in weight loss space after Novo Nordisk partnership changes
- High IV crush risk: 112.5% IV could collapse quickly post-earnings, hurting option values
- Spread timing: Expires Nov 21st, giving only 18 days after earnings for thesis to play out
- Naked call risk: The institutional trade has UNLIMITED risk above $72.65 - retail traders should NOT replicate this exactly
🏁 The Bottom Line
Real talk: This $8.4M modified ratio spread is one of the most aggressive institutional trades we've seen on HIMS all year. Smart money collected $1.17M in premium while betting on a controlled rally toward $60 through the November 3rd earnings catalyst. However, they've taken on UNLIMITED risk above $72.65 - suggesting strong conviction HIMS won't explode past that level.
The gamma data backs the $60 target perfectly. With massive resistance at $55 (immediate ceiling), $60 (sweet spot strike), and $65 (upper bound), this trader has mapped out the exact price zones where market makers will defend.
If you own HIMS: Consider $60-$65 as realistic targets through November expiration. The +115.9% YTD gain is impressive, but gamma resistance could cap upside unless earnings deliver a major surprise.
If you're watching: November 3rd earnings at 5:00 PM ET will be THE catalyst. Key metrics to watch:
- Subscriber growth trends (was 2.4M, up 31% YoY in Q2)
- Q4 guidance incorporating testosterone treatment launch momentum
- Order trends addressing the BofA concerns (-16% YoY in September)
- ZAVA acquisition integration timeline and European growth
If you're trading: DO NOT replicate the exact institutional structure unless you have similar risk tolerance and capital. The naked short $65 call creates unlimited risk. Instead, consider simpler bull call spreads ($55/$60) to capture the core bullish thesis with defined risk.
Mark your calendar:
- November 3, 2025, 5:00 PM ET - Q3 2025 earnings call (CRITICAL CATALYST)
- November 21, 2025 - Options expiration for this trade (18 days post-earnings)
The next 3-6 weeks will determine if this institutional bet pays off. The gamma levels, earnings timing, and product catalysts all point to $60 as the optimal target price. The institution is betting HIMS won't exceed $72.65 by risking unlimited losses above that level!
Disclaimer: Options trading involves substantial risk. This analysis is for educational purposes only and not financial advice. The unusual score calculation is based on historical trade data but past patterns don't guarantee future results.
About HIMS: Hims & Hers Health is a telehealth platform connecting patients and healthcare providers with a $13.17B market cap in the medical services sector. The company provides direct-to-consumer healthcare treatments across multiple therapeutic categories to over 2 million subscribers.