HYG: $2.2M Put Position Closes as High-Yield Credit Plays Defense
January 8, 2026 | Unusual Activity Detected
ETF Overview
iShares iBoxx $ High Yield Corporate Bond ETF (HYG) is one of the largest high-yield corporate bond ETFs, tracking the Markit iBoxx USD Liquid High Yield Index. The fund provides exposure to U.S. dollar-denominated, high-yield corporate bonds.
| Metric | Value |
|---|---|
| AUM | $19.89B - $20.65B |
| Expense Ratio | 0.49% |
| Distribution Yield | 5.72% |
| 52-Week Range | $75.08 - $81.36 |
| Sector | Fixed Income - High Yield Corporate Bonds |
The Quick Take
A trader just closed out a $2.2M put position on HYG - the high-yield bond ETF that sits at the heart of the credit market pulse. With 40,000 contracts changing hands and a Z-score of 4.41, this is an extremely unusual trade - the kind of activity you see just a few times per year. The "Buy to Close" signal suggests someone is taking profits on a bearish bet that already paid off, or simply removing downside protection as credit markets stabilize near 52-week highs.
The Option Flow Breakdown
What Just Happened
| Time | Symbol | Buy/Sell | Call/Put | Expiration | Strike | Volume | OI | Size | Premium | Spot | Option Price |
|---|---|---|---|---|---|---|---|---|---|---|---|
| 12:27:07 | HYG | BUY | PUT | 2026-04-17 | $79 | 40,000 | 51,000 | 39,992 | $2.2M | $80.89 | $0.56 |
Option Symbol: HYG20260417P79
Trade Classification
| Metric | Value | Interpretation |
|---|---|---|
| Order Type | BTC (Buy to Close) | Closing an existing short put position |
| Option Strategy | Closing Put | Single-leg put position being closed |
| Z-Score | 4.41 | EXTREMELY UNUSUAL |
| Volume/OI Ratio | 0.784 (78.4%) | HIGH ACTIVITY |
| Strategy Type | STANDALONE | Single-leg position |
Unusual Score Analysis
Z-Score: 4.41 - This trade is approximately 40x larger than typical HYG options activity. With a Z-classification of "EXTREMELY UNUSUAL," this represents the kind of institutional-scale positioning that occurs only a handful of times per year.
For context: A Z-score above 3 is considered highly unusual, and above 4 is exceptional. This $2.2M trade dwarfs normal retail activity and signals meaningful institutional repositioning.
What This Actually Means
Someone held a bearish position on HYG - likely purchased these puts when high-yield credit looked riskier - and is now closing out for profits (or exiting a hedge). The "Buy to Close" order means this trader is:
- Taking chips off the table - Locking in gains from a put position that appreciated
- Reducing hedges - Removing downside protection they no longer need
- Changing their view - Credit markets have held up better than expected, so they're adjusting
The $79 strike is approximately 2.3% below the current $80.89 price, making this an out-of-the-money put that was purchased as downside insurance or a speculative bearish bet.
Technical Setup
YTD Chart Analysis
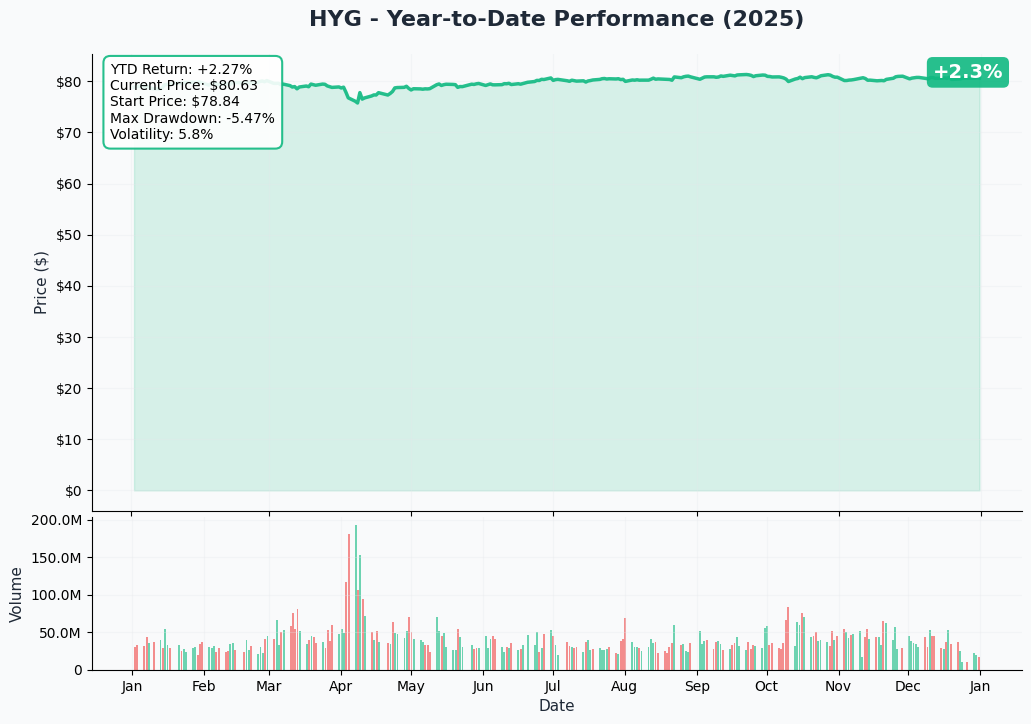
HYG has been remarkably stable over the past year:
- YTD Return: +2.27% (2025)
- Current Price: $80.89
- Max Drawdown: -5.47%
- Volatility: 5.8% (low)
The chart shows HYG trading in a tight range between $78-$82 for most of 2025, with a brief dip in early April when credit markets experienced a brief wobble. Volume spiked significantly during that April stress period but has normalized since.
Gamma-Based Support & Resistance Analysis
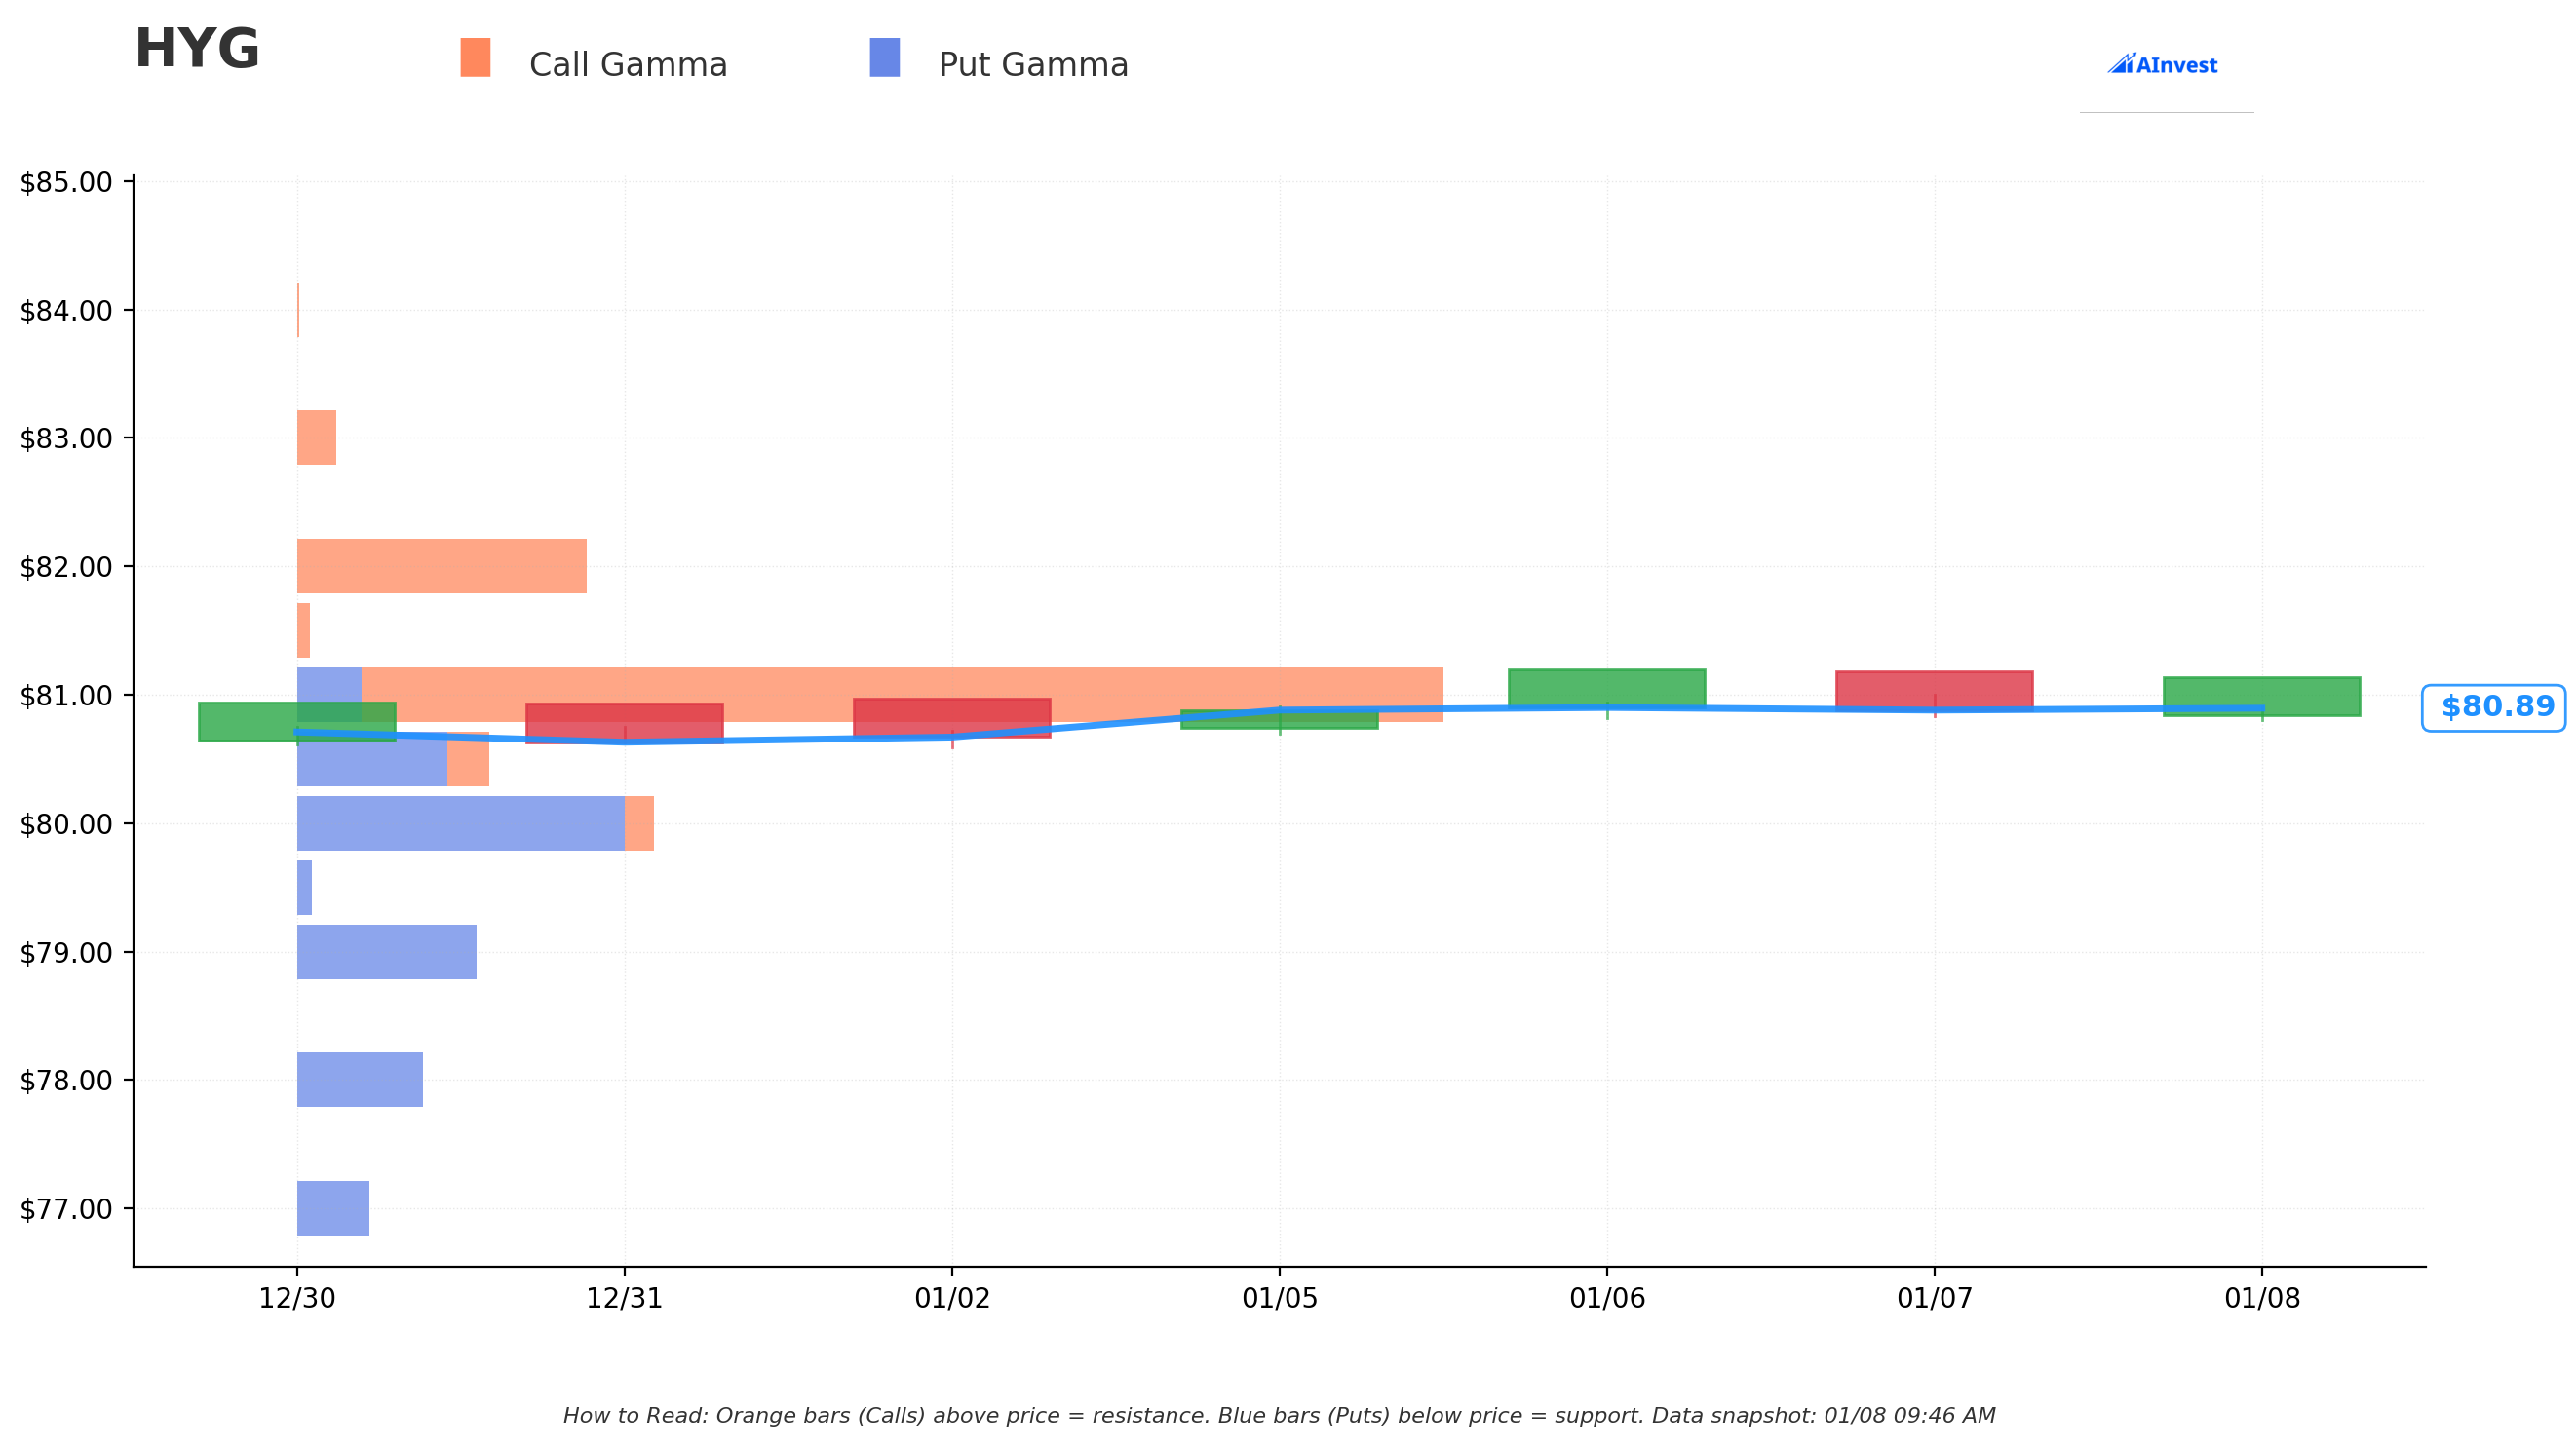
Key Gamma Levels:
| Level Type | Price Zone | Strength |
|---|---|---|
| Major Resistance | $81.00 - $82.00 | Strong call gamma concentration |
| Current Price | $80.89 | Near upper resistance band |
| Minor Support | $80.00 | Moderate put gamma |
| Major Support | $79.00 | Significant put gamma wall |
| Deep Support | $77.00 - $78.00 | Heavy put protection |
The gamma chart reveals:
- Orange bars (Call Gamma) cluster around $81-$82, creating resistance overhead
- Blue bars (Put Gamma) stack up at $79-$80, providing layered support
- Price action has been grinding along the $81 resistance zone
This suggests HYG is "pinned" in a range where market maker hedging activity keeps volatility suppressed - typical for a bond ETF near 52-week highs.
Implied Move Support & Resistance Analysis
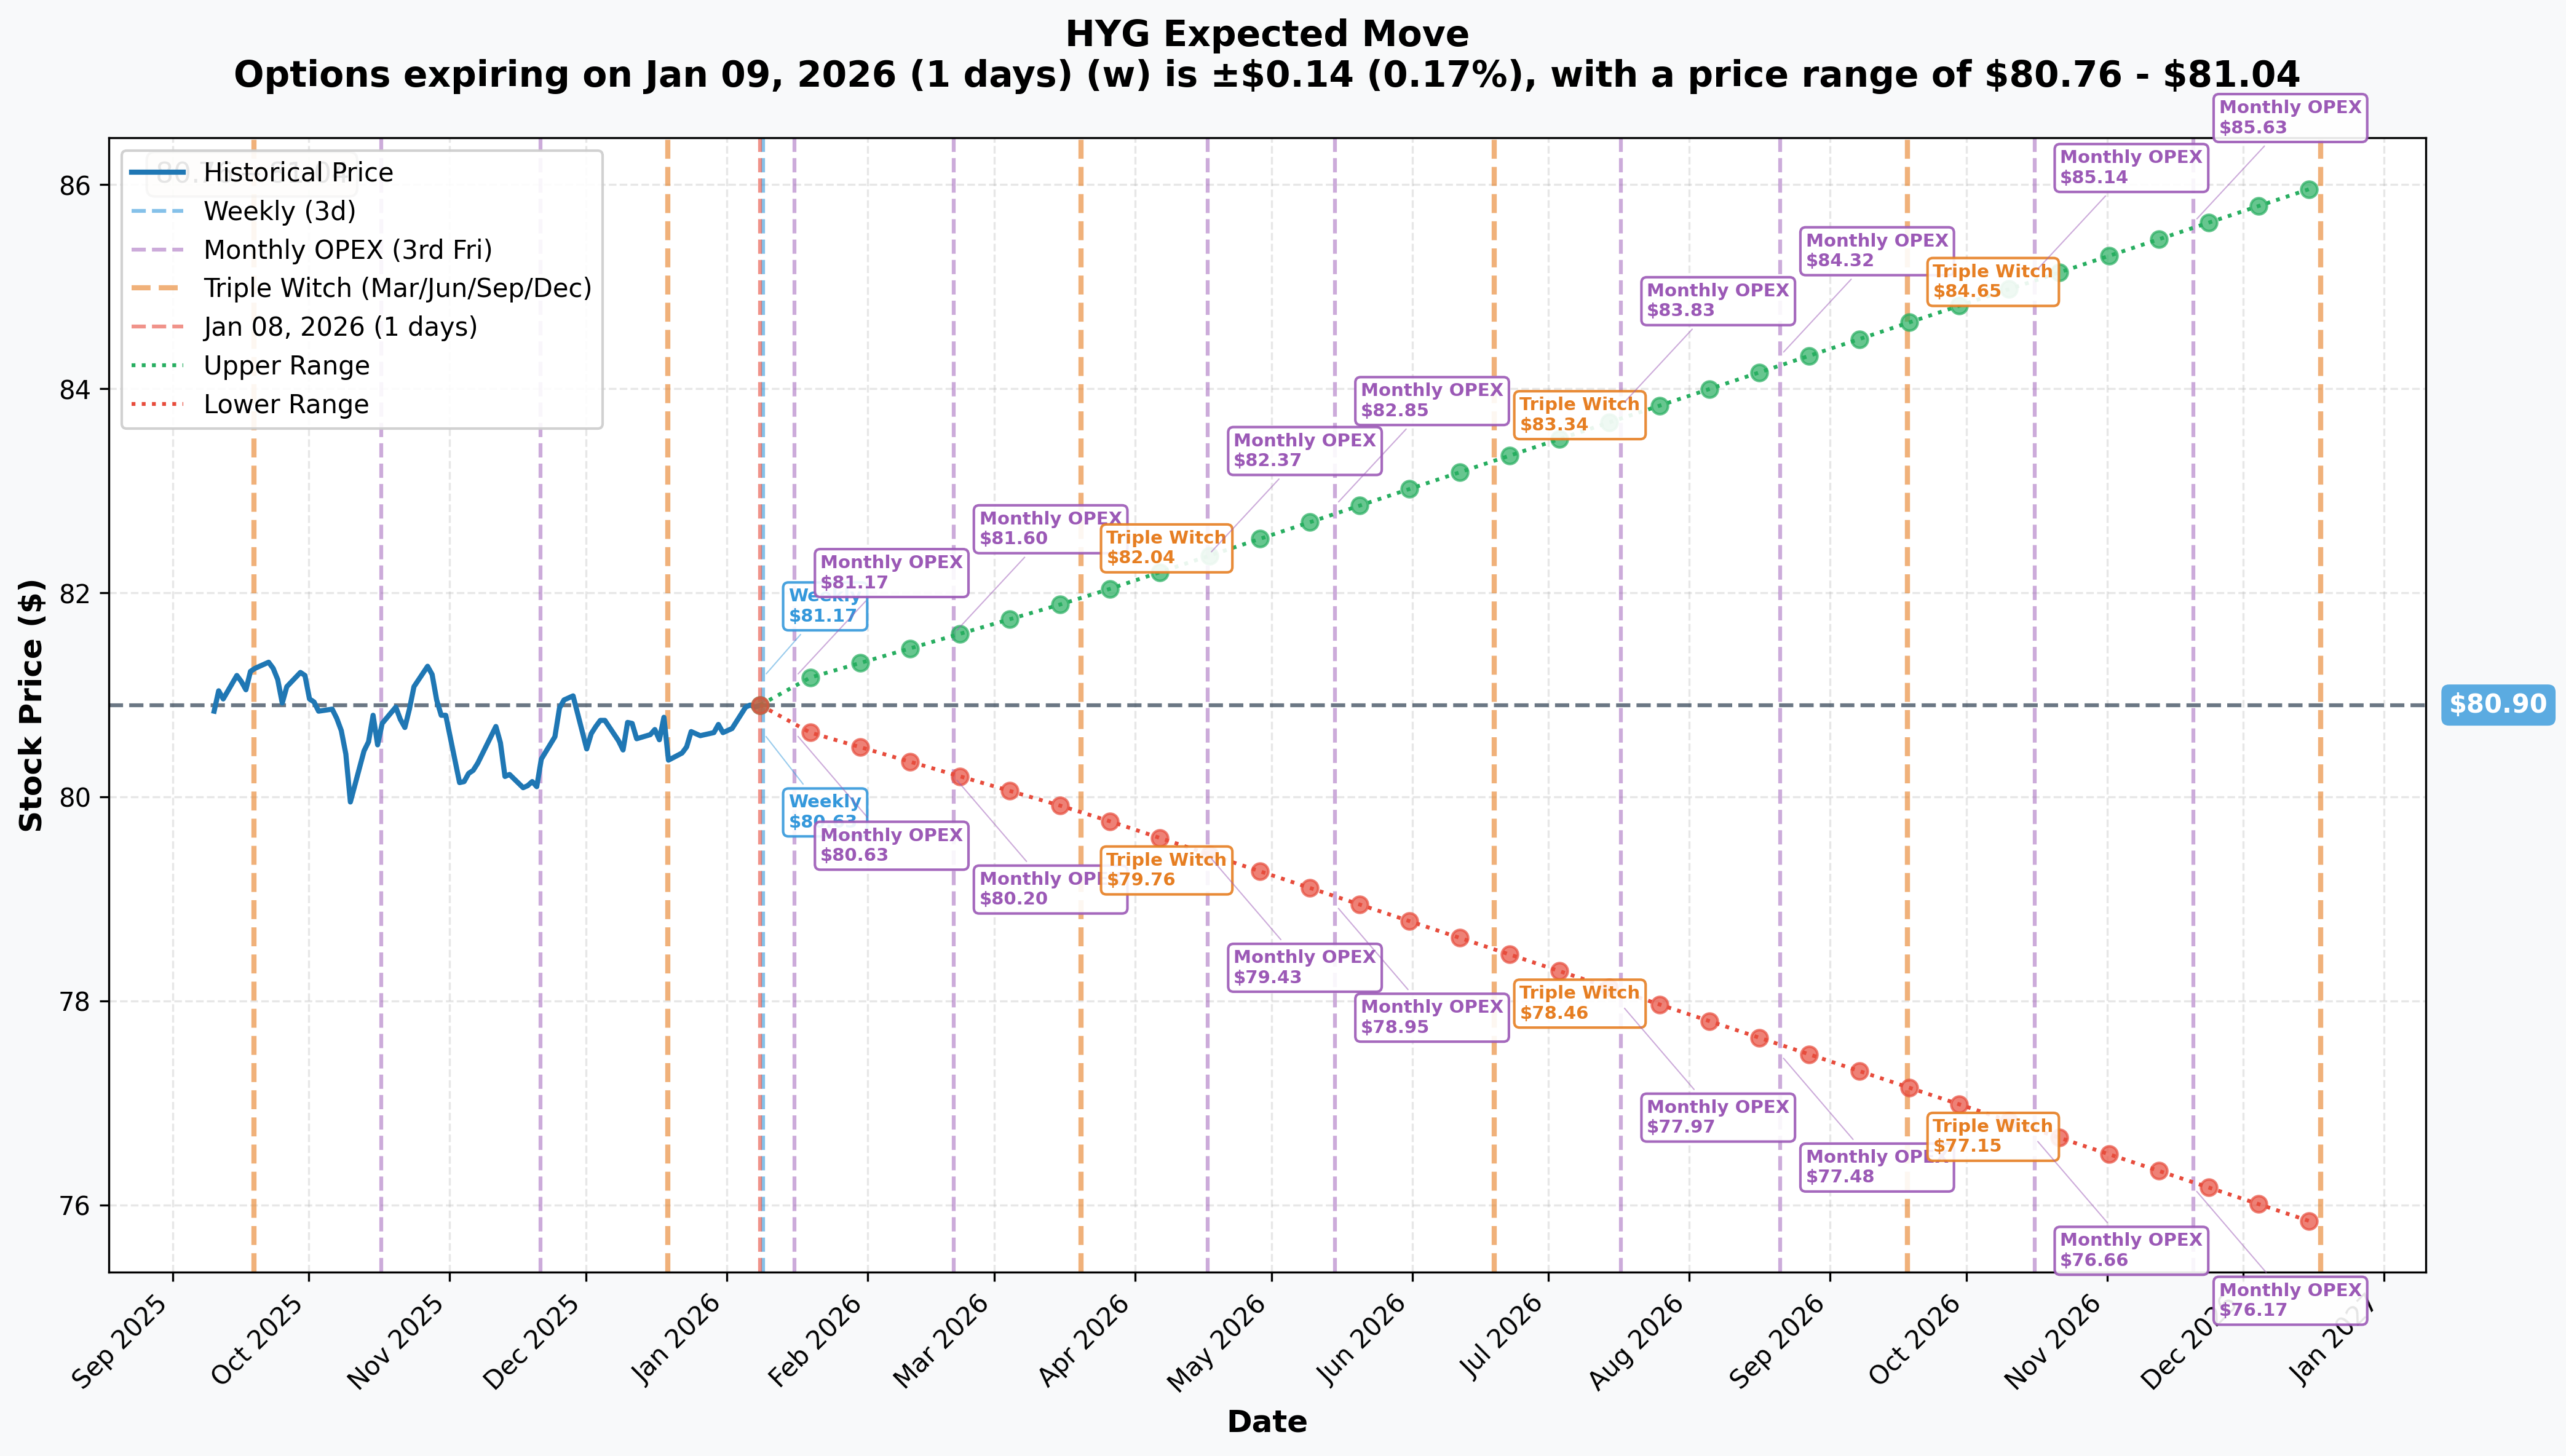
Expected Moves by Timeframe:
| Timeframe | Expiration | Implied Move | Expected Range |
|---|---|---|---|
| Weekly | 2026-01-09 | +/- 0.17% | $80.76 - $81.04 |
| Monthly OPEX | 2026-01-16 | +/- 0.29% | $80.67 - $81.13 |
| Triple Witch | 2026-03-20 | +/- 1.30% | $79.85 - $81.95 |
| April OPEX | 2026-04-17 | +/- 1.82% | $79.43 - $82.37 |
| LEAPS | 2026-12-18 | +/- 6.30% | $75.80 - $86.00 |
Key Observation: The April 17 expiration (matching the traded put) has an implied range of $79.43 - $82.37. The $79 strike sits right at the lower boundary of this expected move - a strategic choice for someone wanting cheap downside protection that only pays off in a meaningful selloff.
Catalysts
Upcoming Events
| Date | Event | Potential Impact |
|---|---|---|
| January 27-28, 2026 | FOMC Meeting | Rate decision; 16.1% probability of a cut per Kalshi |
| March 2026 | FOMC Meeting | Potential cut if data softens |
| April 2026 | Expected Fed Cut | CME FedWatch pricing per iShares |
| May 15, 2026 | Powell Term Expires | New Fed Chair appointment per Brookings |
Recent Developments
- Credit Spreads at 25-Year Tights: The ICE BofA US High Yield Index OAS sits at just 2.81% according to Trading Economics - in the tightest 5% of readings over the past 25 years per Janus Henderson
- Default Rates Rising: Moody's projects HY bond defaults to rise above 4% by Q1 2026, up from 3.7% currently
- Maturity Wall Concerns: According to PitchBook, $320B in high-yield debt matures in 2026-2027, creating refinancing pressure
- Fed Chair Transition: Yahoo Finance reports Kevin Hassett leads the race to replace Powell with 75% odds on Polymarket
- Tariff Risk: Barings notes consumer and manufacturing sectors are most vulnerable to tariff-related credit stress
Price Targets & Probabilities
Based on gamma exposure, implied moves, and catalyst timing:
Bull Case: $82 - $83 (30% probability)
Conditions: Fed delivers dovish surprise, credit spreads remain tight, no economic shock
- Gamma resistance at $82 would need to break
- Would require move beyond implied range upper bound ($82.37)
- Limited upside given HYG already near 52-week highs ($81.36)
Base Case: $80 - $81 (50% probability)
Conditions: Fed holds steady, credit environment stable, no catalyst disruption
- Price continues grinding along $81 resistance
- Gamma pinning keeps volatility suppressed
- Current price ($80.89) well-positioned for range-bound trading
- Yield seekers continue to bid for 5.72% distribution
Bear Case: $78 - $79 (20% probability)
Conditions: Credit event, hawkish Fed surprise, default wave, or economic slowdown
- Would require break below major $79 put gamma support
- The $79 strike from today's trade represents this floor
- Vanguard warns of potential stagflationary shocks in H1 2026
- Jordan Lopez (Payden & Rygel) cites macro slowdown as biggest risk at current valuations per Cambridge Associates
Trading Ideas
Conservative: Collect Premium While We Wait
Strategy: Sell Cash-Secured Put at $79 strike, April 17 expiration
- Premium: ~$0.55-$0.60 per contract
- Max Return: ~0.7% in 99 days (2.6% annualized)
- Breakeven: ~$78.40
- Why This Works: Someone just closed this exact position - you can open it. If HYG stays above $79 (current gamma support), you keep the premium. If assigned, you own HYG at $78.40 - a solid entry for a 5.72% yielding bond ETF
Balanced: Bull Put Spread for Defined Risk
Strategy: Sell $79 Put / Buy $77 Put spread, April 17 expiration
- Net Credit: ~$0.30-$0.35
- Max Risk: $1.65-$1.70 per spread
- Max Return: 18-21% on risk in 99 days
- Breakeven: ~$78.65
- Why This Works: Captures premium while limiting downside to $200 per spread. $77 is deep support (put gamma wall) - unlikely to breach without a credit crisis
Aggressive: Calendar Spread for Volatility Pop
Strategy: Sell January $81 Call / Buy April $81 Call
- Net Debit: ~$0.40-$0.50
- Thesis: January theta decay works in your favor; if HYG stays pinned near $81 (gamma magnet), you capture time premium
- Catalyst Play: Positions you for potential volatility expansion around FOMC (Jan 27-28) and Fed Chair transition uncertainty
- Why This Works: HYG implied volatility is low (5.8% historical). Any catalyst-driven vol expansion benefits the longer-dated leg
Risk Factors
What Could Go Wrong
- Credit Event Risk: Tight spreads provide minimal buffer for any credit shock per J.P. Morgan. A single high-profile default could trigger spread widening
- Fed Policy Shift: New Fed Chair could pivot hawkish, pressuring credit valuations
- Maturity Wall Execution: Companies rolling debt at higher rates face margin compression
- Tariff Second-Order Effects: HSBC warns of potential shock from tariff cascades through supply chains per PitchBook
- Liquidity Risk: Bond ETFs can gap in stress scenarios - 2020 showed HYG can drop 20%+ in weeks
- CCC Quality Deterioration: LPL Research notes CCC spreads widening even as BB tightens - bifurcation signals selective stress
The Bottom Line
Real talk: This $2.2M put closure tells us something important - a major player just reduced their bearish exposure on high-yield credit. With HYG trading near 52-week highs and credit spreads at 25-year tights, they could be:
- Taking profits from a well-timed hedge during 2025's volatility
- Shifting to neutral as credit markets prove resilient
- Rolling positions to different strikes or expirations
The Setup:
- HYG sits at $80.89, pinned by gamma between $79 support and $81 resistance
- Implied volatility is low, making puts relatively cheap
- April expiration captures the Jan/March FOMC meetings and potential Fed Chair announcement
For Traders:
- If You're Bullish: The put seller's exit is your opportunity - sell puts at $79 for income
- If You're Neutral: Range-bound strategies work here - iron condors or calendar spreads
- If You're Bearish: Wait for a break below $79 before betting against this tight spread environment
Mark Your Calendar: January 27-28 FOMC and May 15 Powell term expiration are the key dates. Credit markets are priced for perfection - any disappointment could trigger the move that makes the $79 puts valuable again.
Disclaimer
This analysis is for informational purposes only and does not constitute investment advice. Options trading involves significant risk of loss and is not suitable for all investors. Past performance is not indicative of future results. High-yield bonds carry substantial credit risk and may experience significant price volatility. Always conduct your own research and consider consulting a financial advisor before making investment decisions. The unusual options activity highlighted may not predict future price movements, and institutional trades can be part of complex hedging strategies not visible from public data.
Analysis generated January 8, 2026 | Data sources: ETFdb, referenced financial publications