🪙 IBIT: $28M Bitcoin ETF Mega Trade - Institutional Conviction Despite Outflows!
📅 December 11, 2025 | 🔥 Unusual Activity Detected
🎯 The Quick Take
Someone just dropped a staggering $28 MILLION on matching IBIT call and put spreads expiring June 2026 - the single largest options bet we've seen on BlackRock's Bitcoin ETF. This isn't retail FOMO; this is sophisticated money making a massive leveraged play on Bitcoin volatility while the ETF bleeds outflows. With IBIT sliding from recent highs and Bitcoin struggling around $92K, big money is positioning for major moves ahead.
💎 ETF Overview
IBIT (iShares Bitcoin Trust) is BlackRock's spot Bitcoin ETF and currently the world's largest Bitcoin exchange-traded product. Here's what you need to know:
Key Stats:
- Assets Under Management: $71.8 billion[^1_1]
- Current Price: $51.22 (as of December 11, 2025)
- Structure: Physical Bitcoin holdings (holds ~770,000 BTC)[^5_5]
- Bitcoin Exposure: Direct 1:1 tracking of Bitcoin spot price
- Market Share: ~40% of all spot Bitcoin ETF assets
- Options Market: 9th largest in U.S. with 7.7M active contracts and $38B open interest[^5_1]
Performance Context:
- 52-Week Range: $42.98 - $71.82
- YTD 2025: Roughly flat (-1%)
- Down from ATH: -28.7% from October 2025 peak
- Year-to-Date Inflows: $25.3 billion (leading all Bitcoin ETFs)[^8_3]
What Makes IBIT Special: This isn't just another ETF - IBIT has become the most liquid way for institutions to get Bitcoin exposure without dealing with custody, wallets, or regulatory headaches. BlackRock's reputation and $13.4 trillion in total assets[^13_1] gives IBIT credibility that crypto-native products can't match. The ETF now dominates 45% of global Bitcoin options activity[^5_3], meaning when big money wants to bet on Bitcoin, they're increasingly doing it through IBIT.
💰 The Option Flow Breakdown
📊 What Just Happened
Here's the wild part - 20,000 contracts traded on both sides at the exact same time:
| Time | Type | Strike | Expiration | Premium | Volume | OI | Size | Spot Price | Order Type | Z-Score |
|---|---|---|---|---|---|---|---|---|---|---|
| 11:13 AM | CALL BUY | $52 | 2026-06-18 | $14.0M | 20,000 | 2,500 | 20,000 | $50.72 | BTO | 219.23 |
| 11:13 AM | PUT SELL | $52 | 2026-06-18 | $14.0M | 20,000 | 5,800 | 20,000 | $50.72 | STO | 67.29 |
View IBIT $52 June 2026 Call Chart View IBIT $52 June 2026 Put Chart
Total Capital Deployed: $28 million Expiration: June 18, 2026 (189 days out) Unusualness: Call Z-Score of 219x - this trade is extremely rare (happens a few times per year)
🤓 What This Actually Means
Let's break down this monster trade in plain English:
The Setup:
- Bought 20,000 calls at $52 strike for $7.20 each = $14.4M
- Sold 20,000 puts at $52 strike for $7.12 each = $14.24M
- Net cost: Nearly even (small debit of ~$160K)
The Strategy: This is a synthetic long position - basically recreating Bitcoin exposure through options instead of buying the ETF outright. Here's why someone would do this:
✅ Massive Leverage: Controlling $104M worth of IBIT (20,000 contracts × 100 shares × $52) for essentially zero upfront cost ✅ Capital Efficiency: Tying up maybe $2-3M in margin instead of $104M in stock ✅ Bullish Conviction: This trader wants Bitcoin/IBIT higher but wants to keep their cash for other trades ✅ Institutional Fingerprints: The matched timing, identical strikes, and size scream hedge fund or prop desk
Real Talk: When someone puts on a trade this size, they've done their homework. This isn't speculation - this is calculated positioning ahead of known catalysts. The June 2026 expiration gives them 6+ months for their thesis to play out, which suggests they're expecting major Bitcoin moves tied to specific events (more on that below).
The Risk: If IBIT trades below $52 at June expiration, this position starts losing money fast. Below $45, losses accelerate dramatically. This is a pure directional bet - no hedges, no safety net.
📈 Technical Setup / Chart Check-Up
YTD Chart Analysis
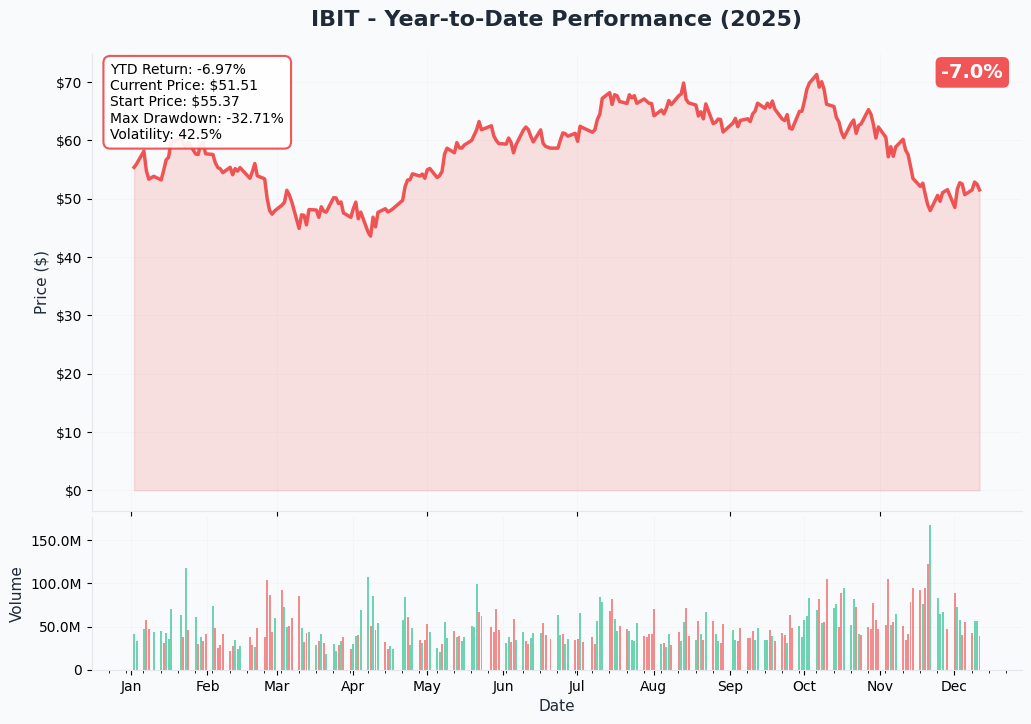
IBIT's 2025 journey tells a story of institutional FOMO followed by reality check. The ETF rocketed from $43 in early 2025 to an all-time high near $72 in October as Bitcoin hit $126,000[^15_1]. That's a 67% gain in 10 months - not bad for "boring" institutional money.
But since October, it's been a different story. IBIT has shed 28.7% from peak to trough, currently trading at $51.22. The recent selloff coincided with Bitcoin's 35% correction from $126K to $82K[^7_2], though Bitcoin has since recovered to $92K while IBIT lags.
Key Technical Levels:
- Major Support: $50.00 (psychological level + October 2024 base)
- Immediate Support: $51.50 (current gamma support zone)
- Immediate Resistance: $52.00 (exactly where the big trade is positioned)
- Major Resistance: $55.00 (need to reclaim this for trend reversal)
The fact that this massive $28M trade struck at $52 is no accident - that's the key resistance level IBIT needs to clear to signal the bleeding is over.
Gamma-Based Support & Resistance Analysis
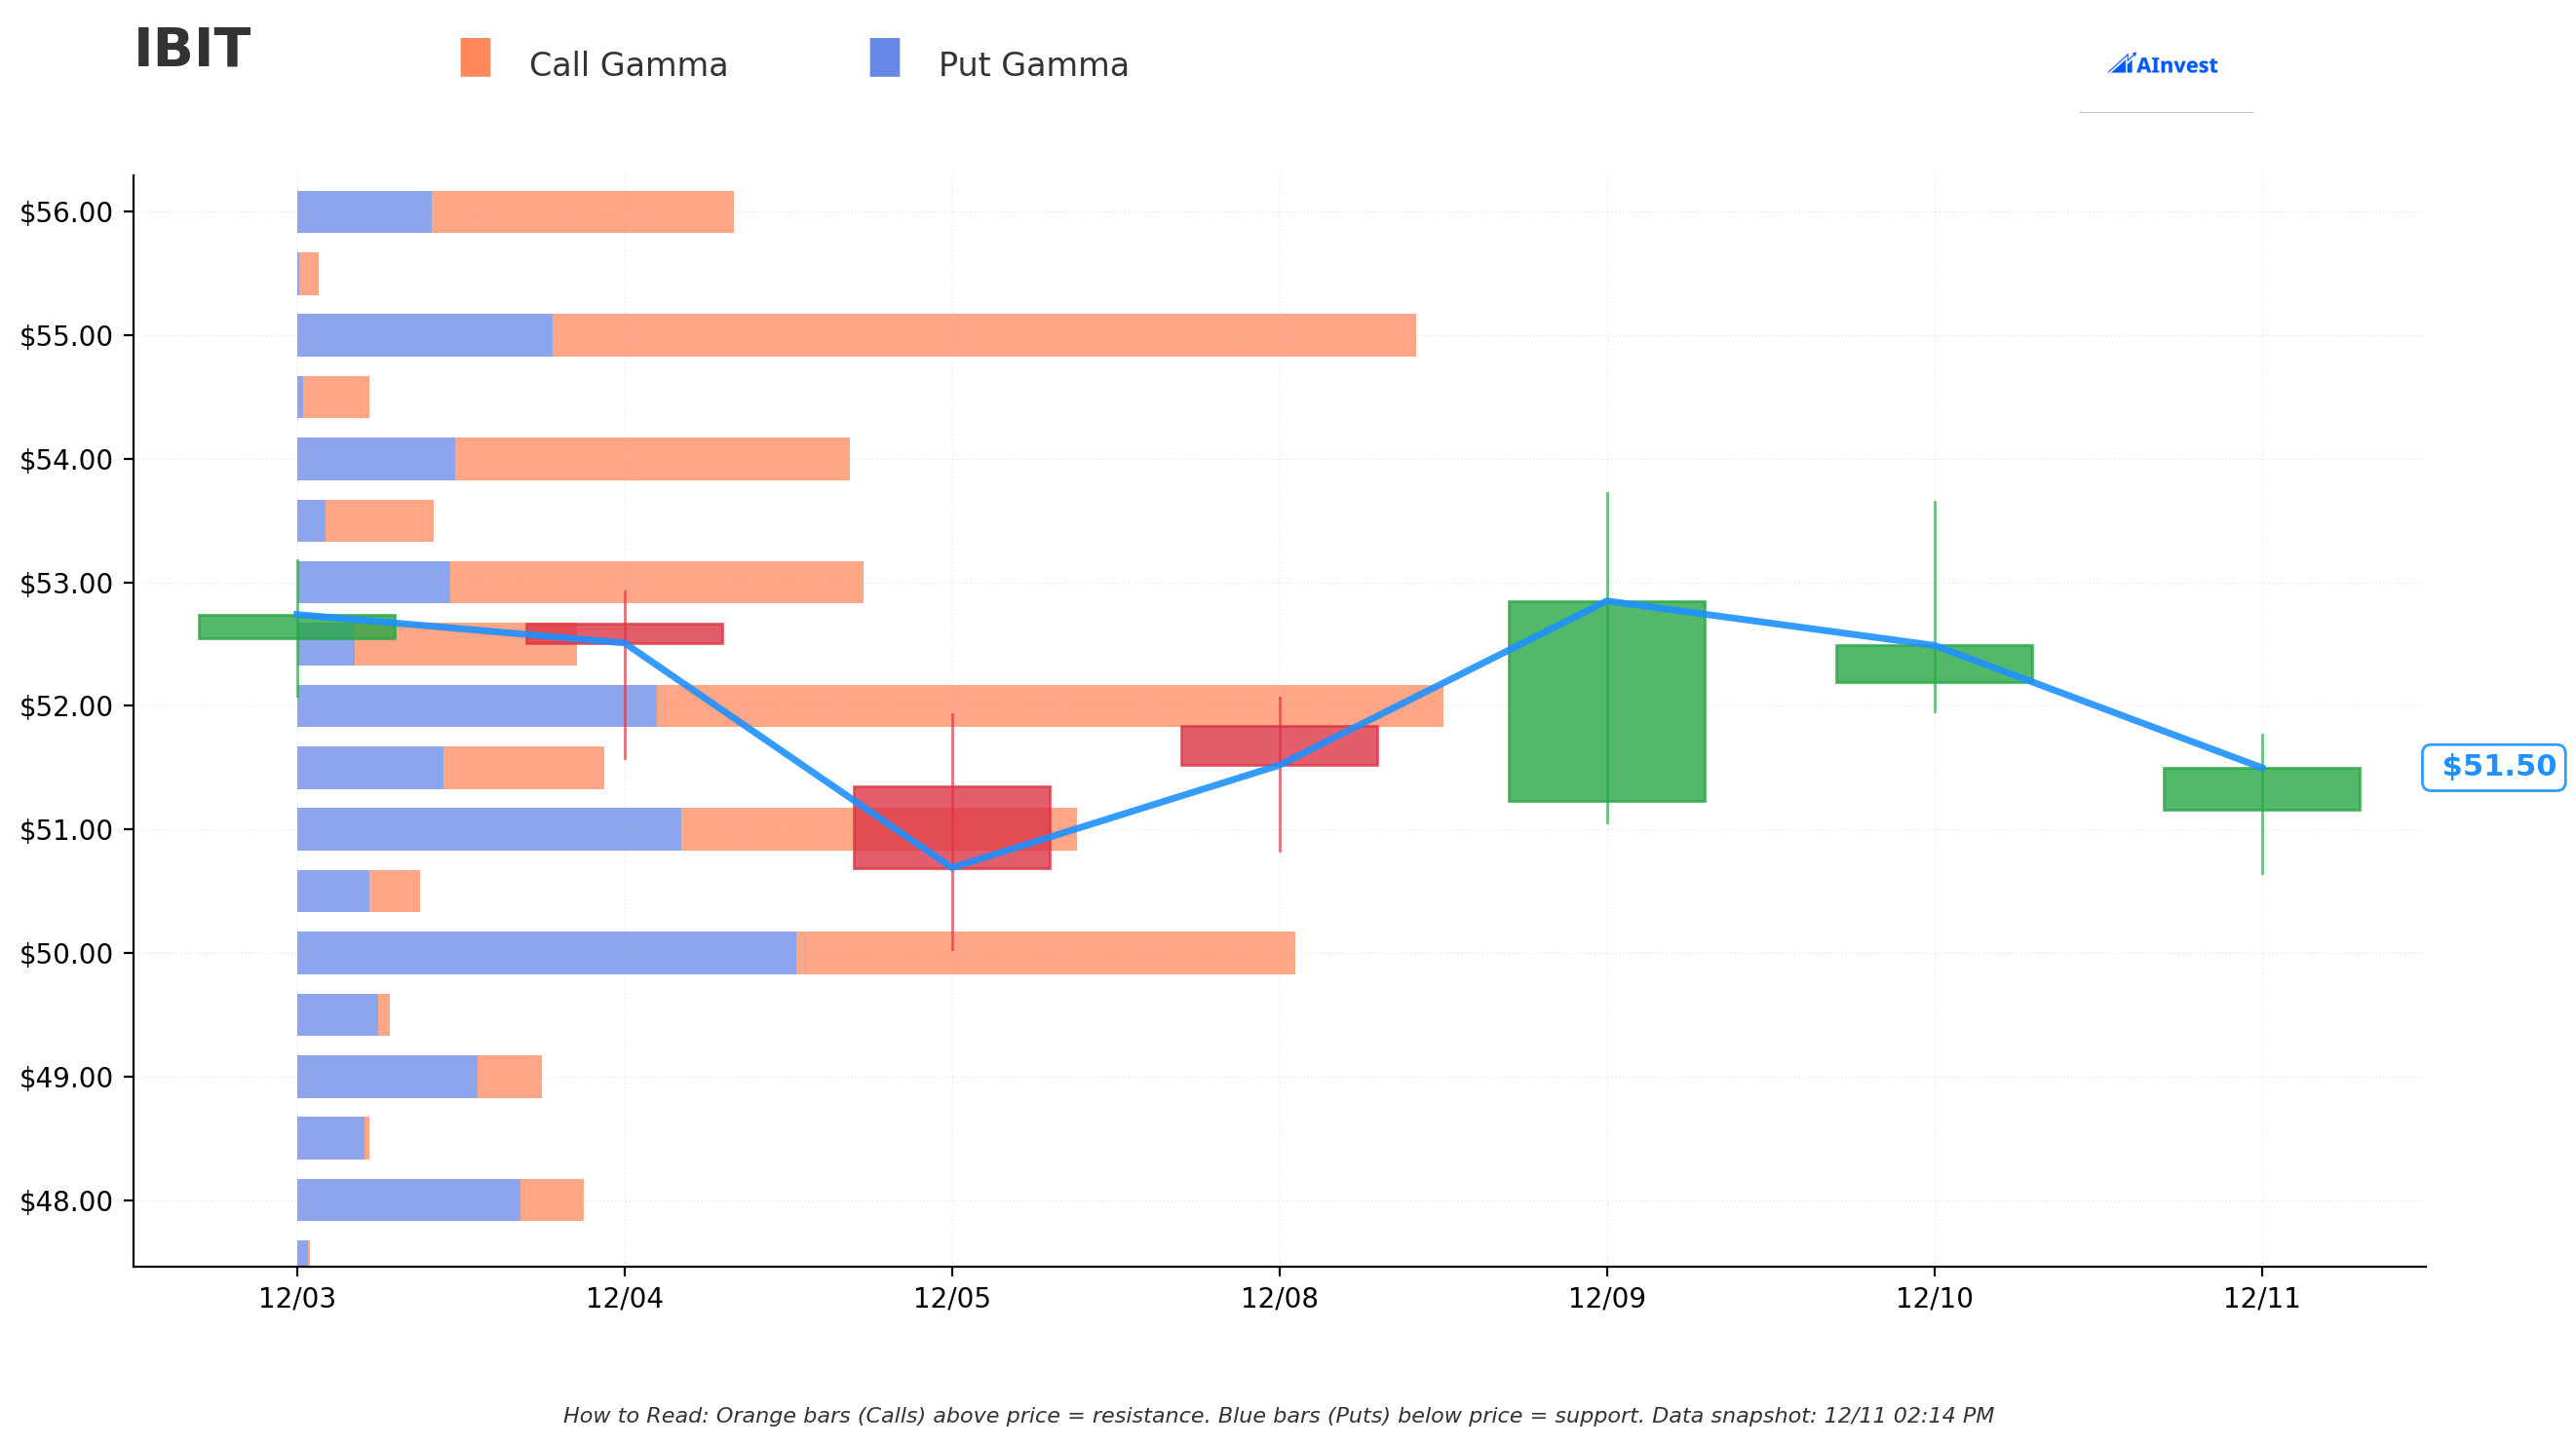
The gamma exposure map shows where options dealers have the most pain, which creates natural support and resistance zones:
🔵 Support Levels (Put Gamma - Blue Bars):
- $51.50: Strongest nearby support with 24.1M in total gamma exposure
- Just 0.05% below current price - we're literally sitting on top of this
- Heavy put writing here suggests institutions expect this to hold
- $51.00: Secondary support at 60.9M total gamma
- About 1% lower - first major bounce zone if we dip
- $50.00: Critical psychological support with 78.1M gamma
- Nearly 3% below current - this is the "do not break" level
- $45.00: Deep support at 32.8M gamma
- 12.7% lower - breakdown level where things get ugly
🟠 Resistance Levels (Call Gamma - Orange Bars):
- $52.00: Monster resistance at 88.9M total gamma
- Less than 1% above current price
- This is THE level to break - exactly where the big trade positioned
- Net gamma of +33.5M (heavily call-skewed) means dealers will fight this
- $55.00: Major resistance at 86.4M gamma
- About 6.7% higher - significant breakout target
- Clearing $55 would signal all-systems-go for bulls
- $60.00: Extended resistance at 67.5M gamma
- 16.4% upside - long-term bull target
Net GEX Bias: Bullish (562.5M call gamma vs 374.9M put gamma)
The options market is positioned for upside, with call gamma dominating. The $52 strike concentration is fascinating - it's both massive resistance AND the exact strike where $28M just got deployed. Someone wants to force IBIT through this level.
Implied Move Analysis
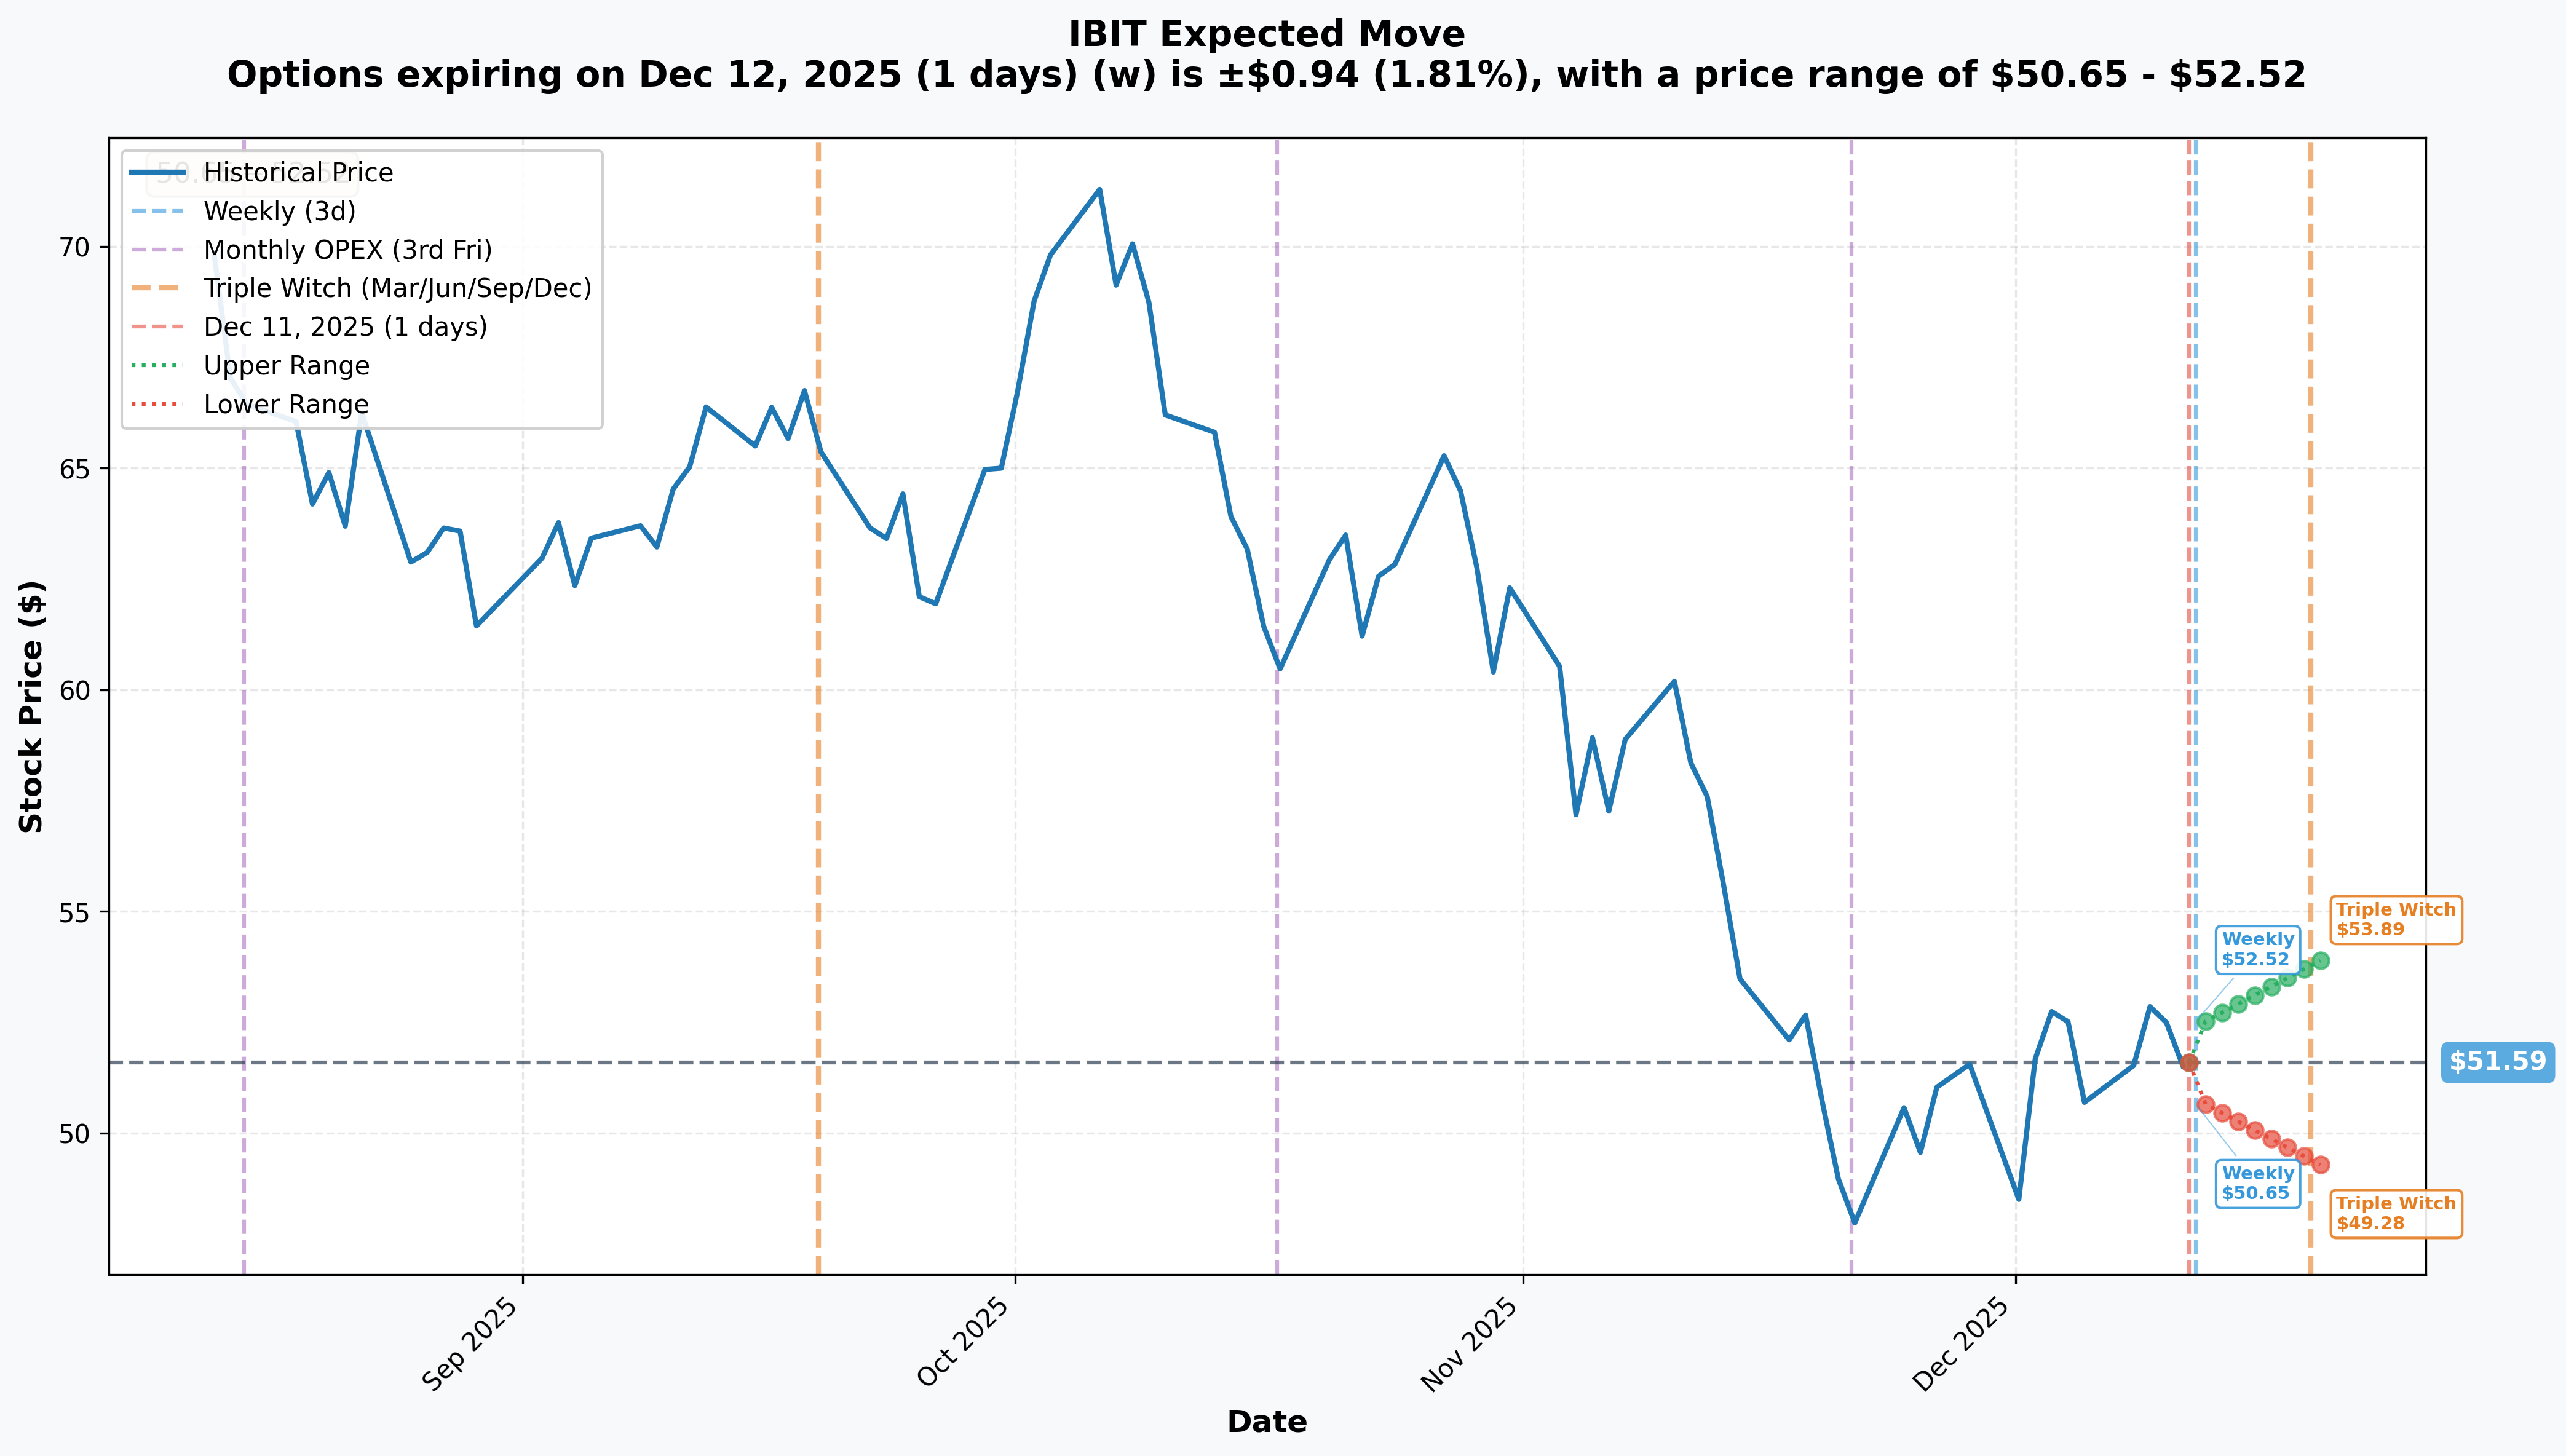
Options pricing reveals what the market expects for upcoming expirations:
📅 Weekly (December 12, 2025 - Tomorrow!):
- Implied Move: ±1.81% ($0.94)
- Expected Range: $50.65 - $52.52
- Translation: Market expects IBIT to stay range-bound through Friday
- Reliability: High (1-day moves are fairly predictable)
📅 Monthly OPEX (December 19, 2025):
- Implied Move: ±4.47% ($2.31)
- Expected Range: $49.28 - $53.89
- Translation: Options are pricing moderate volatility through month-end
- Key Level: Upper range of $53.89 aligns with next gamma resistance
📅 Triple Witch (December 19, 2025):
- Same as monthly OPEX - markets expect a $49-$54 trading range for the next week
- The $52 strike on our big trade sits right in the middle of expected range
What This Means: The implied move calculations suggest IBIT will likely chop around current levels through December OPEX. But here's the kicker - the $28M June 2026 trade isn't about next week. It's about the next 6 months. The trader doesn't care about December volatility; they're positioning for major catalysts in Q1-Q2 2026.
🎪 Catalysts
🔜 Upcoming Events (Why This Trade Makes Sense)
Bank of America Adviser Access - January 5, 2026 🏦 This is the big one. Bank of America will authorize 15,000 financial advisers[^17_1] to allocate Bitcoin to wealth clients starting January 5, 2026. BofA manages $2.67 trillion in assets across 3,600+ branches[^17_3]. Even if advisers recommend just 1-2% Bitcoin exposure (which they are[^17_2]), we're talking $26-53 billion in potential inflows. IBIT's 40% market share suggests $10-21B could flow into this ETF alone.
SEC Innovation Exemption - Expected January 2026 📜 SEC Chair Paul Atkins announced[^18_1] the regulator is "on track" to roll out innovation exemptions for crypto activities in January 2026. This creates a regulatory on-ramp for more institutional crypto products and legitimizes the space for conservative allocators who've been waiting for clearer rules.
Federal Reserve Rate Policy - Ongoing 💵 The Fed just cut rates by 25 bps to 3.5%-3.75% on December 10, 2025[^4_1], marking the third cut in 2025. White House economic adviser Kevin Hassett indicated "plenty of room" to cut further[^19_1]. Lower rates = more liquidity = more capital chasing risk assets like Bitcoin. The June 2026 expiration on the big trade suggests expectations for multiple additional cuts through mid-2026.
Bitcoin Halving Cycle Peak Window (Mid-2025) ⛏️ Bitcoin's fourth halving occurred April 19, 2024. Historical patterns suggest price peaks occur 12-18 months post-halving. Bitfinex analysts project[^20_3] "$140,000-$200,000 around mid-2025" as a minimum target. The June 2026 expiration captures this entire window plus aftermath.
Major Crypto Conferences (December 2025 - April 2026) 🎤
- Global Blockchain Show Abu Dhabi: December 10-11, 2025[^21_3]
- The Bitcoin Conference 2026: April 27-29, 2026 in Las Vegas[^21_4]
- Consensus 2026: May 5-7, 2026 in Miami[^21_5]
These events historically drive media hype, partnership announcements, and price volatility.
📌 Recent Events (Already Happened)
Vanguard Platform Opens - December 2, 2025 🚪 Vanguard began allowing crypto ETFs[^2_1] on its brokerage platform starting December 2, granting 50+ million clients access to Bitcoin products. The firm manages approximately $11 trillion in assets. Bitcoin surged above $93,000 within 36 hours of the announcement[^2_3], and BlackRock's IBIT hit $1 billion in trading volume[^2_4] within the first 30 minutes on December 3.
IBIT Options Top 10 Ranking - December 2025 📊 IBIT options cracked the top 10 U.S. list[^5_1] with 7.7M active contracts, ranking 9th among all U.S.-listed stocks, ETFs, and indices. Open interest reached nearly $38 billion, surpassing Deribit[^5_2] to become the largest venue for Bitcoin options globally. IBIT now accounts for 45% of global BTC options open interest[^5_3].
Record Bitcoin ETF Outflows - November 2025 📉 IBIT experienced its longest outflow streak since launch[^6_1]: six consecutive weeks totaling $2.7 billion through early December. The single-day record hit $523.2M on November 18[^11_1]. However, analysts attribute this to "basis trade" unwinding[^10_1] rather than capitulation - meaning leveraged arbitrage positions closed out, not genuine selling.
Bitcoin Recovery - December 9, 2025 📈 Bitcoin soared back above $94,000[^7_1] in morning U.S. trading on December 9, gaining more than $3,000 in less than an hour. After weeks of decline following the 35% correction from $126K[^7_2], Bitcoin jumped around 11% in just two days[^7_3]. Current price: ~$92,300.
BlackRock Bitcoin Revenue Milestone - November 2025 💰 Bitcoin ETFs became BlackRock's top revenue source[^13_1], with allocations nearing $100 billion. IBIT generated an estimated $245 million in annual fees by October 2025[^13_2] and became the fastest ETF in history to reach $70 billion in assets (341 days)[^13_3].
🎲 Price Targets & Probabilities
Based on gamma levels, implied move analysis, catalysts, and Bitcoin correlation, here are three scenarios for IBIT through the June 2026 expiration:
🚀 Bull Case: IBIT $60-65 (16-26% upside)
Probability: 35%
The Setup:
- Bitcoin reaches $140,000-$150,000 on halving cycle peak (Bitfinex/Bernstein targets[^20_3][^20_4])
- Bank of America allocations inject $10-20B into IBIT starting January 5
- Fed cuts rates 2-3 more times through mid-2026
- Vanguard's $11 trillion platform drives sustained institutional inflows
- IBIT reclaims market dominance, outflows reverse to strong inflows
Technical Path:
- Break through $52 resistance (our big trade strike) → $53-54
- Clear the $55 gamma wall → $56-58 range
- Momentum accelerates into $60+ (major gamma resistance at $60)
- Extended rally to $63-65 mirrors Bitcoin's blow-off top
Why It Could Happen: The confluence of institutional access (BofA advisers, Vanguard platform), regulatory clarity (SEC innovation exemption), and favorable macro (rate cuts) creates the perfect storm for Bitcoin adoption. 75% of institutions plan to increase crypto allocations in 2025[^26_4], and we're still early in this wave. If Bitcoin hits even the conservative $140K target, IBIT easily trades above $60.
The $28M Trade Wins: At $60, the calls are worth $8+ ($16M profit on $14.4M invested). The short puts expire worthless. Total P&L: +$16M+ (over 100% return on capital).
⚖️ Base Case: IBIT $52-55 (1-7% upside)
Probability: 45%
The Setup:
- Bitcoin trades range-bound $90,000-$110,000 through Q1-Q2 2026
- BofA allocations materialize but at lower-than-hoped levels ($5-10B vs $20B+)
- Outflows stabilize but don't reverse meaningfully
- Competition from other Bitcoin ETFs intensifies (fee compression)
- Fed pauses rate cuts if inflation reaccelerates
- Post-halving rally proves muted vs historical cycles
Technical Path:
- IBIT grinds through $52 resistance but fails to hold $55
- Trades in a choppy $50-$54 range for most of 2026
- Eventually settles near $52-53 at June expiration
Why This Is Likely: Markets rarely deliver the extremes. Bitcoin's 4-year halving cycle may be weakening[^20_6] due to institutional demand smoothing volatility. IBIT's annualized volatility dropped 75% year-over-year[^26_5], suggesting a more stable, less explosive regime. The recent outflow streak, even if arbitrage-driven, shows IBIT isn't a one-way train anymore.
The $28M Trade Status: At $52-53, the position roughly breaks even (calls slightly in-the-money, puts expire worthless or take small loss). This isn't a disaster - the trader basically got free leverage for 6 months.
😰 Bear Case: IBIT $42-48 (-6% to -17% downside)
Probability: 20%
The Setup:
- Bitcoin breaks below $85,000 and cascades to $70,000-$75,000
- Institutional allocations disappoint (BofA advisers stay cautious)
- MicroStrategy forced to liquidate Bitcoin holdings (CEO hinted at this[^23_5])
- 251 corporate entities holding $344B in Bitcoin[^22_1] start selling to lock profits
- Fed turns hawkish, pauses rate cuts, or hints at hikes
- Regulatory uncertainty resurfaces (Congressional pushback on SEC crypto policies)
- IBIT outflows accelerate beyond basis trade unwind
Technical Path:
- Fail to reclaim $52 → retest $50 support
- Break $50 → panic selling to $48
- Test $45 deep support zone (12.7% lower)
- Worst case: flush to 52-week low near $43
Why It Could Happen: The Fear & Greed Index sits at 29 (Fear)[^28_2], and Bitcoin remains down 30% from its October ATH. IBIT's six-week outflow streak is unprecedented[^6_1] - if this signals genuine institutional rotation OUT of Bitcoin rather than just arbitrage unwind, the selling pressure could intensify. Corporate holders like MicroStrategy trade below their Bitcoin NAV[^23_4], creating liquidation risk.
The $28M Trade Loses: Below $52 at expiration, both the long calls and short puts lose money. At $45, the position could be down $7-10M. This is the nightmare scenario for the trade.
💡 Trading Ideas
🛡️ Conservative: "Wait and Watch" Strategy
The Play: Don't chase this trade right now. Wait for IBIT to decisively break $52 with volume.
Specific Setup:
- Entry Trigger: IBIT closes above $52.50 on heavy volume (80M+ shares)
- Long Shares: Buy 100-500 shares of IBIT at $52.50-53.00
- Stop Loss: $50.00 (roughly 5% risk)
- Target: $55.00 (5-6% gain)
- Holding Period: 1-3 months
Why This Works: You're letting the big money prove their trade first. If IBIT breaks $52 (exactly where the $28M trade positioned), it validates the bullish thesis. You get favorable risk/reward: 5% downside vs 6%+ upside to $55 resistance. If it doesn't break $52, you lose nothing by staying in cash.
Size Guidance: Risk no more than 2-3% of portfolio capital. At $52.50 entry with $50 stop, that's 4.7% risk per share. Position accordingly.
⚖️ Balanced: "Mini Synthetic Long" Strategy
The Play: Replicate the big trade at a retail-friendly size.
Specific Setup (per 10 contracts):
- Buy: 10 IBIT June 2026 $52 calls at ~$7.00 = $7,000
- Sell: 10 IBIT June 2026 $52 puts at ~$6.80 = $6,800 credit
- Net Cost: $200 debit (plus margin requirement of ~$15,000)
- Expiration: June 18, 2026
- Breakeven: $52.02 (strike + net debit)
Risk/Reward:
- Max Gain: Unlimited above $52
- Max Loss: Substantial below $52 (you're synthetically long 1,000 shares)
- If IBIT = $60: Profit = $7,980 (nearly 4x return on capital at risk)
- If IBIT = $45: Loss = -$7,020 (ouch)
Why This Works: You get massive leverage and capital efficiency. You're controlling $52,000 worth of IBIT for $200 upfront + margin. If the institutional thesis plays out (BofA flows, Bitcoin rally), you participate fully in upside. The 6-month duration gives catalysts time to materialize.
Who Should Do This: Traders comfortable with margin, understand options mechanics, and believe in the Bitcoin bull case. This is NOT a set-and-forget trade - you'll need to monitor it, especially if IBIT breaks below $50.
🚀 Aggressive: "Leveraged Long Call" Strategy
The Play: Go all-in on June 2026 calls, no hedges.
Specific Setup:
- Buy: 20-50 IBIT June 2026 $55 calls at ~$5.50-6.00 each
- Total Cost: $11,000-$30,000 (for 20-50 contracts)
- Expiration: June 18, 2026
- Breakeven: $60.50-61.00
Risk/Reward:
- Max Gain: Massive if Bitcoin explodes (10x+ possible if IBIT hits $70+)
- Max Loss: 100% of premium (you could lose your entire $11K-$30K)
- If IBIT = $65: Profit = $9,000+ per 10 contracts (82% return)
- If IBIT = $50: Loss = 100% (calls expire worthless)
Why This Is Aggressive: You're betting on the bull case coming true. If Bitcoin hits $140K+ and IBIT rallies to $60-65, these $55 calls go from $5.50 to $10+ (100% gain). If Bitcoin halving cycle peak materializes, you could see 200-300% returns. But if we're wrong and IBIT stays below $55, you lose everything.
Position Sizing: This is a YOLO allocation - don't risk more than 5-10% of your total portfolio. This is your "Bitcoin moon shot" bet.
Who Should Do This: Die-hard Bitcoin bulls who believe the halving cycle thesis, have strong conviction in institutional adoption, and can stomach 100% loss. This is speculation, not investing.
⚠️ Risk Factors
Bitcoin Correlation Risk 🪙 IBIT moves with Bitcoin, period. If Bitcoin dumps, IBIT dumps. The current Bitcoin price around $92K is down 27% from the October peak of $126K[^15_1]. There's no diversification here - you're making a levered bet on a single volatile asset.
Outflow Momentum Risk 📉 IBIT just suffered its worst outflow streak in history[^6_1] - six consecutive weeks, $2.7B withdrawn. While analysts blame arbitrage unwind[^10_3], what if it's more than that? What if institutions are genuinely rotating OUT of Bitcoin? Sustained outflows put downward pressure on IBIT regardless of Bitcoin's price.
MicroStrategy Overhang 🏢 MicroStrategy (now "Strategy") holds 650,000 BTC[^23_1] but trades at a discount to NAV ($49B market cap vs $56B in Bitcoin holdings[^23_4]). CEO Phong Le's November comments about potential Bitcoin sales[^23_5] tanked Bitcoin below $86K. If corporate holders start liquidating (for taxes, margin calls, profit-taking), it creates an avalanche scenario.
Halving Cycle "Over" Thesis ⛏️ Bitcoin's up only ~40% one year after the April 2024 halving[^20_9], far below previous cycles. Some analysts argue the 4-year cycle is over[^20_6] due to changing market structure (institutions smooth volatility, 94.5% of supply already mined[^20_7]). If the post-halving rally doesn't materialize, the $140K-$200K targets are fantasy, and IBIT stays range-bound or lower.
Federal Reserve Hawkish Surprise 📊 The Fed cut rates December 10[^4_1], but what if they pause in Q1 2026? What if inflation reaccelerates and they hint at hikes? Bitcoin thrives in easy money environments; it wilts when liquidity tightens. A hawkish Fed pivot would crush risk assets, including crypto.
Options Leverage Risk ⚡ The $28M trade used synthetic longs - this is MAX leverage. If the trader needs to unwind before June (for any reason), they'll move the market. Plus, IBIT now has 340,000 BTC in options vs 770,000 BTC held[^5_5] - nearly 50% of underlying exposure is derivatives. High leverage amplifies volatility in both directions.
Regulatory Uncertainty 📜 While the SEC innovation exemption[^18_1] sounds bullish, the World Federation of Exchanges (Nasdaq, Cboe, CME) warned it could "dilute" investor protections[^18_2]. Political winds shift fast - what if Congress pushes back? What if new crypto scandals (exchange hacks, fraud) trigger regulatory backlash?
Fee Compression Risk 💸 IBIT generates $245M in annual fees[^13_2], but as the Bitcoin ETF market matures, competition intensifies. Vanguard's low-cost culture[^16_2] may pressure industry pricing. Lower fees mean lower BlackRock revenue, potentially less marketing support for IBIT.
Black Swan Events 🦢 Bitcoin exchange hacks, quantum computing breakthroughs threatening blockchain security, governments banning Bitcoin (China-style crackdowns spreading), Satoshi's coins moving, etc. Crypto has a history of 50-80% drawdowns on unexpected news.
🎯 The Bottom Line
Here's the deal: Someone with serious capital just made a $28 million bet that IBIT rallies over the next 6 months. This isn't a Hail Mary - it's a calculated play timed around massive institutional catalysts (BofA advisers getting access January 5, Vanguard's $11 trillion platform opening, potential Bitcoin halving cycle peak).
If you own it: Hold through the noise. The recent outflows are likely arbitrage unwind, not capitulation[^10_3]. Key support at $50-51 has held. If we break above $52 with conviction, the path to $55-60 opens up. Mark your calendar for January 5, 2026 (BofA adviser access) - that's when we'll know if institutional flows are real or hype.
If you're watching: Don't chase it here at $51. Wait for a decisive break above $52 on volume, or wait for a dip to $49-50 to enter. The $52 level is critical - it's both gamma resistance AND where the big trade positioned. A clean break through $52 validates the bull thesis; failure keeps us range-bound.
If you're bearish: Watch the $50 level like a hawk. A break below $50 triggers technical selling and could flush us to $45-48. Also watch Bitcoin - if BTC can't hold $88K support, IBIT won't hold either.
Risk Management: Whether you're going conservative (shares with stops), balanced (synthetic long), or aggressive (long calls), size your position so you can sleep at night. IBIT can easily move 5-10% in a day when Bitcoin gets volatile. Don't risk money you can't afford to lose.
The Opportunity: If the bull case plays out - Bitcoin hits $140K+, institutions allocate meaningfully, IBIT soars to $60-65 - this is a legitimate 20-30% gain opportunity over 6 months. That beats the S&P by a mile. The catalysts are real, the timing lines up, and big money is positioning.
The Reality Check: This is Bitcoin. It's volatile. It's speculative. It's gone from $69K to $16K before (2022 crash) and could do it again. The halving cycle might not save us. Corporate sellers could overwhelm institutional buyers. The Fed could stay hawkish. Trade accordingly.
⚖️ Disclaimer
This analysis is for informational and educational purposes only and does not constitute financial advice, investment recommendations, or an offer to buy or sell any securities. Options trading involves substantial risk of loss and is not suitable for all investors. The strategies discussed involve complex financial instruments that can result in the loss of your entire investment and, in some cases, losses exceeding your initial investment (especially with naked short options or margin-based strategies).
Past performance is not indicative of future results. The unusual options activity and technical analysis presented here represent historical data and do not guarantee future price movements. Cryptocurrency and cryptocurrency-related ETFs are highly volatile and speculative investments that can experience rapid and substantial price swings.
All price targets, probabilities, and catalyst assessments are subjective opinions based on available information as of December 11, 2025, and are subject to change. The author and AInvest may hold positions in the securities discussed. Always conduct your own research, understand the risks involved, and consider consulting with a licensed financial advisor before making any investment decisions.
By reading this analysis, you acknowledge that you understand the risks associated with options trading and cryptocurrency investments, and you accept full responsibility for any trading decisions you make.
Learn More:
Analysis generated December 11, 2025 | Data sources: ThetaData, Polygon.io, Bloomberg, CoinDesk, SEC filings