IBIT: $4.2M LEAP Call Position Closes - Someone Cashes Out Before Bitcoin's Next Move!
January 13, 2026 | Unusual Activity Detected
The Quick Take
Someone just closed out a $4.2 million position in IBIT January 2027 $60 calls - that's a LEAP trade more than a year out. This isn't your typical day trade; this is institutional money taking chips off the table on their bullish Bitcoin bet. With IBIT sitting at $52.91 (15% below the $60 strike), this could signal profit-taking, risk management, or a change in long-term Bitcoin outlook ahead of major catalysts.
Company Overview
iShares Bitcoin Trust ETF (IBIT) is BlackRock's flagship Bitcoin spot ETF, launched January 11, 2024 on NASDAQ. The fund provides direct exposure to Bitcoin without the complexity of crypto custody.
| Metric | Value |
|---|---|
| AUM | $70.84B |
| Market Share | ~59% of spot Bitcoin ETF market |
| Expense Ratio | 0.25% |
| Underlying Asset | Bitcoin (~$92,000) |
| Primary Exchange | NASDAQ |
| 1-Year Net Flows | +$24.68B |
IBIT dominates the Bitcoin ETF space with institutional-grade infrastructure and Coinbase custody. It's the go-to vehicle for institutions looking to gain Bitcoin exposure without direct crypto holdings.
The Option Flow Breakdown
What Just Happened
| Date | Time | Symbol | Direction | Type | Expiration | Strike | Volume | OI | Size | Premium | Spot | Option |
|---|---|---|---|---|---|---|---|---|---|---|---|---|
| 2026-01-13 | 12:21:12 | IBIT | BUY | CALL | 2027-01-15 | $60 | 5,100 | 16,000 | 5,000 | $4.2M | $52.91 | IBIT20270115C60 |
Trade Details:
- Strategy Detected: Close Long Call (BTC - Buy to Close)
- Z-Score: 5.15 (EXTREMELY UNUSUAL)
- Volume/OI Ratio: 0.32 (Moderate Activity)
- Volume Signal: CLOSE (indicating position exit)
What This Actually Means
Translation for us regular folks: Someone who had been long 5,000 IBIT January 2027 $60 calls just bought them back to close their position. At $8.31 per contract, that's $4.2M to exit this LEAP trade.
Why Close Now?
- Profit-Taking: If they bought these when IBIT was lower (it hit $42.98 at the 52-week low), they could be locking in gains
- Risk Management: Bitcoin dropped 27% from its October 2025 ATH of $126,198 - they might be cutting exposure
- Capital Reallocation: Freeing up $4.2M to deploy elsewhere
- Changed Outlook: Less confident Bitcoin/IBIT hits $60+ by January 2027
The $60 strike is currently 13% out-of-the-money with IBIT at $52.91. This isn't a panic exit, but it's definitely someone deciding they don't want to wait around for that bullish thesis to play out.
Technical Setup / Chart Check-Up
YTD Price Action
IBIT has had a volatile start to 2026, following Bitcoin's sharp correction from its October 2025 all-time high. The ETF is currently trading at $52.91, down from its 52-week high of $71.82 but well above its low of $42.98.
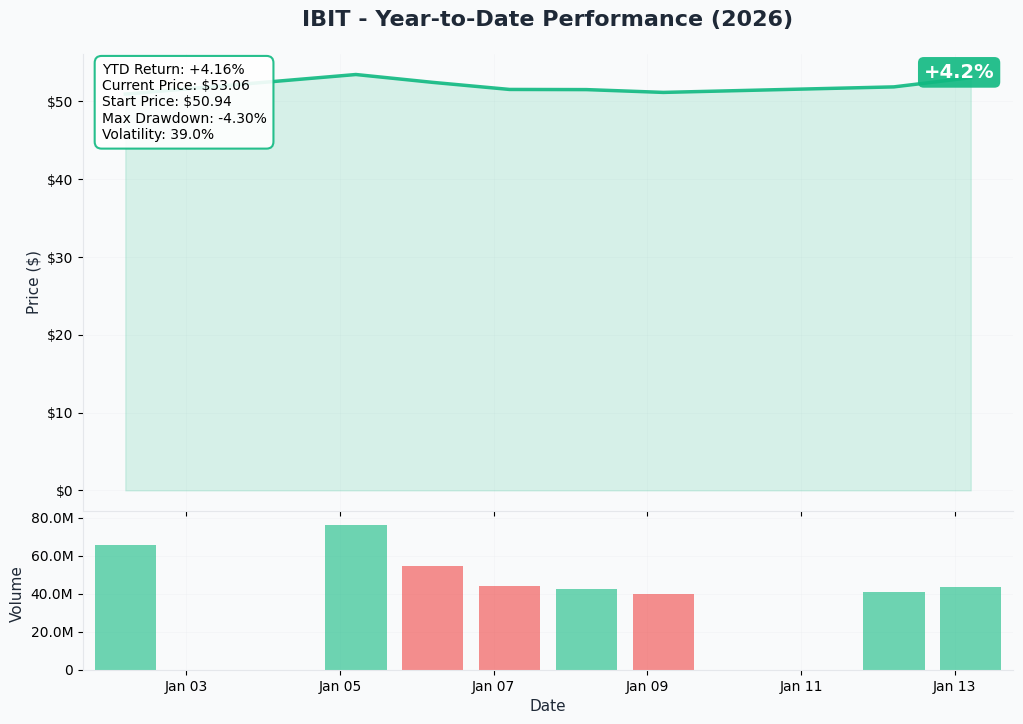
Key observations:
- Bitcoin corrected 27% from October 2025 ATH ($126,198)
- IBIT trading mid-range between 52-week extremes
- Early 2026 ETF inflows resuming (+$1.2B in first 2 trading days)
Gamma-Based Support & Resistance Analysis
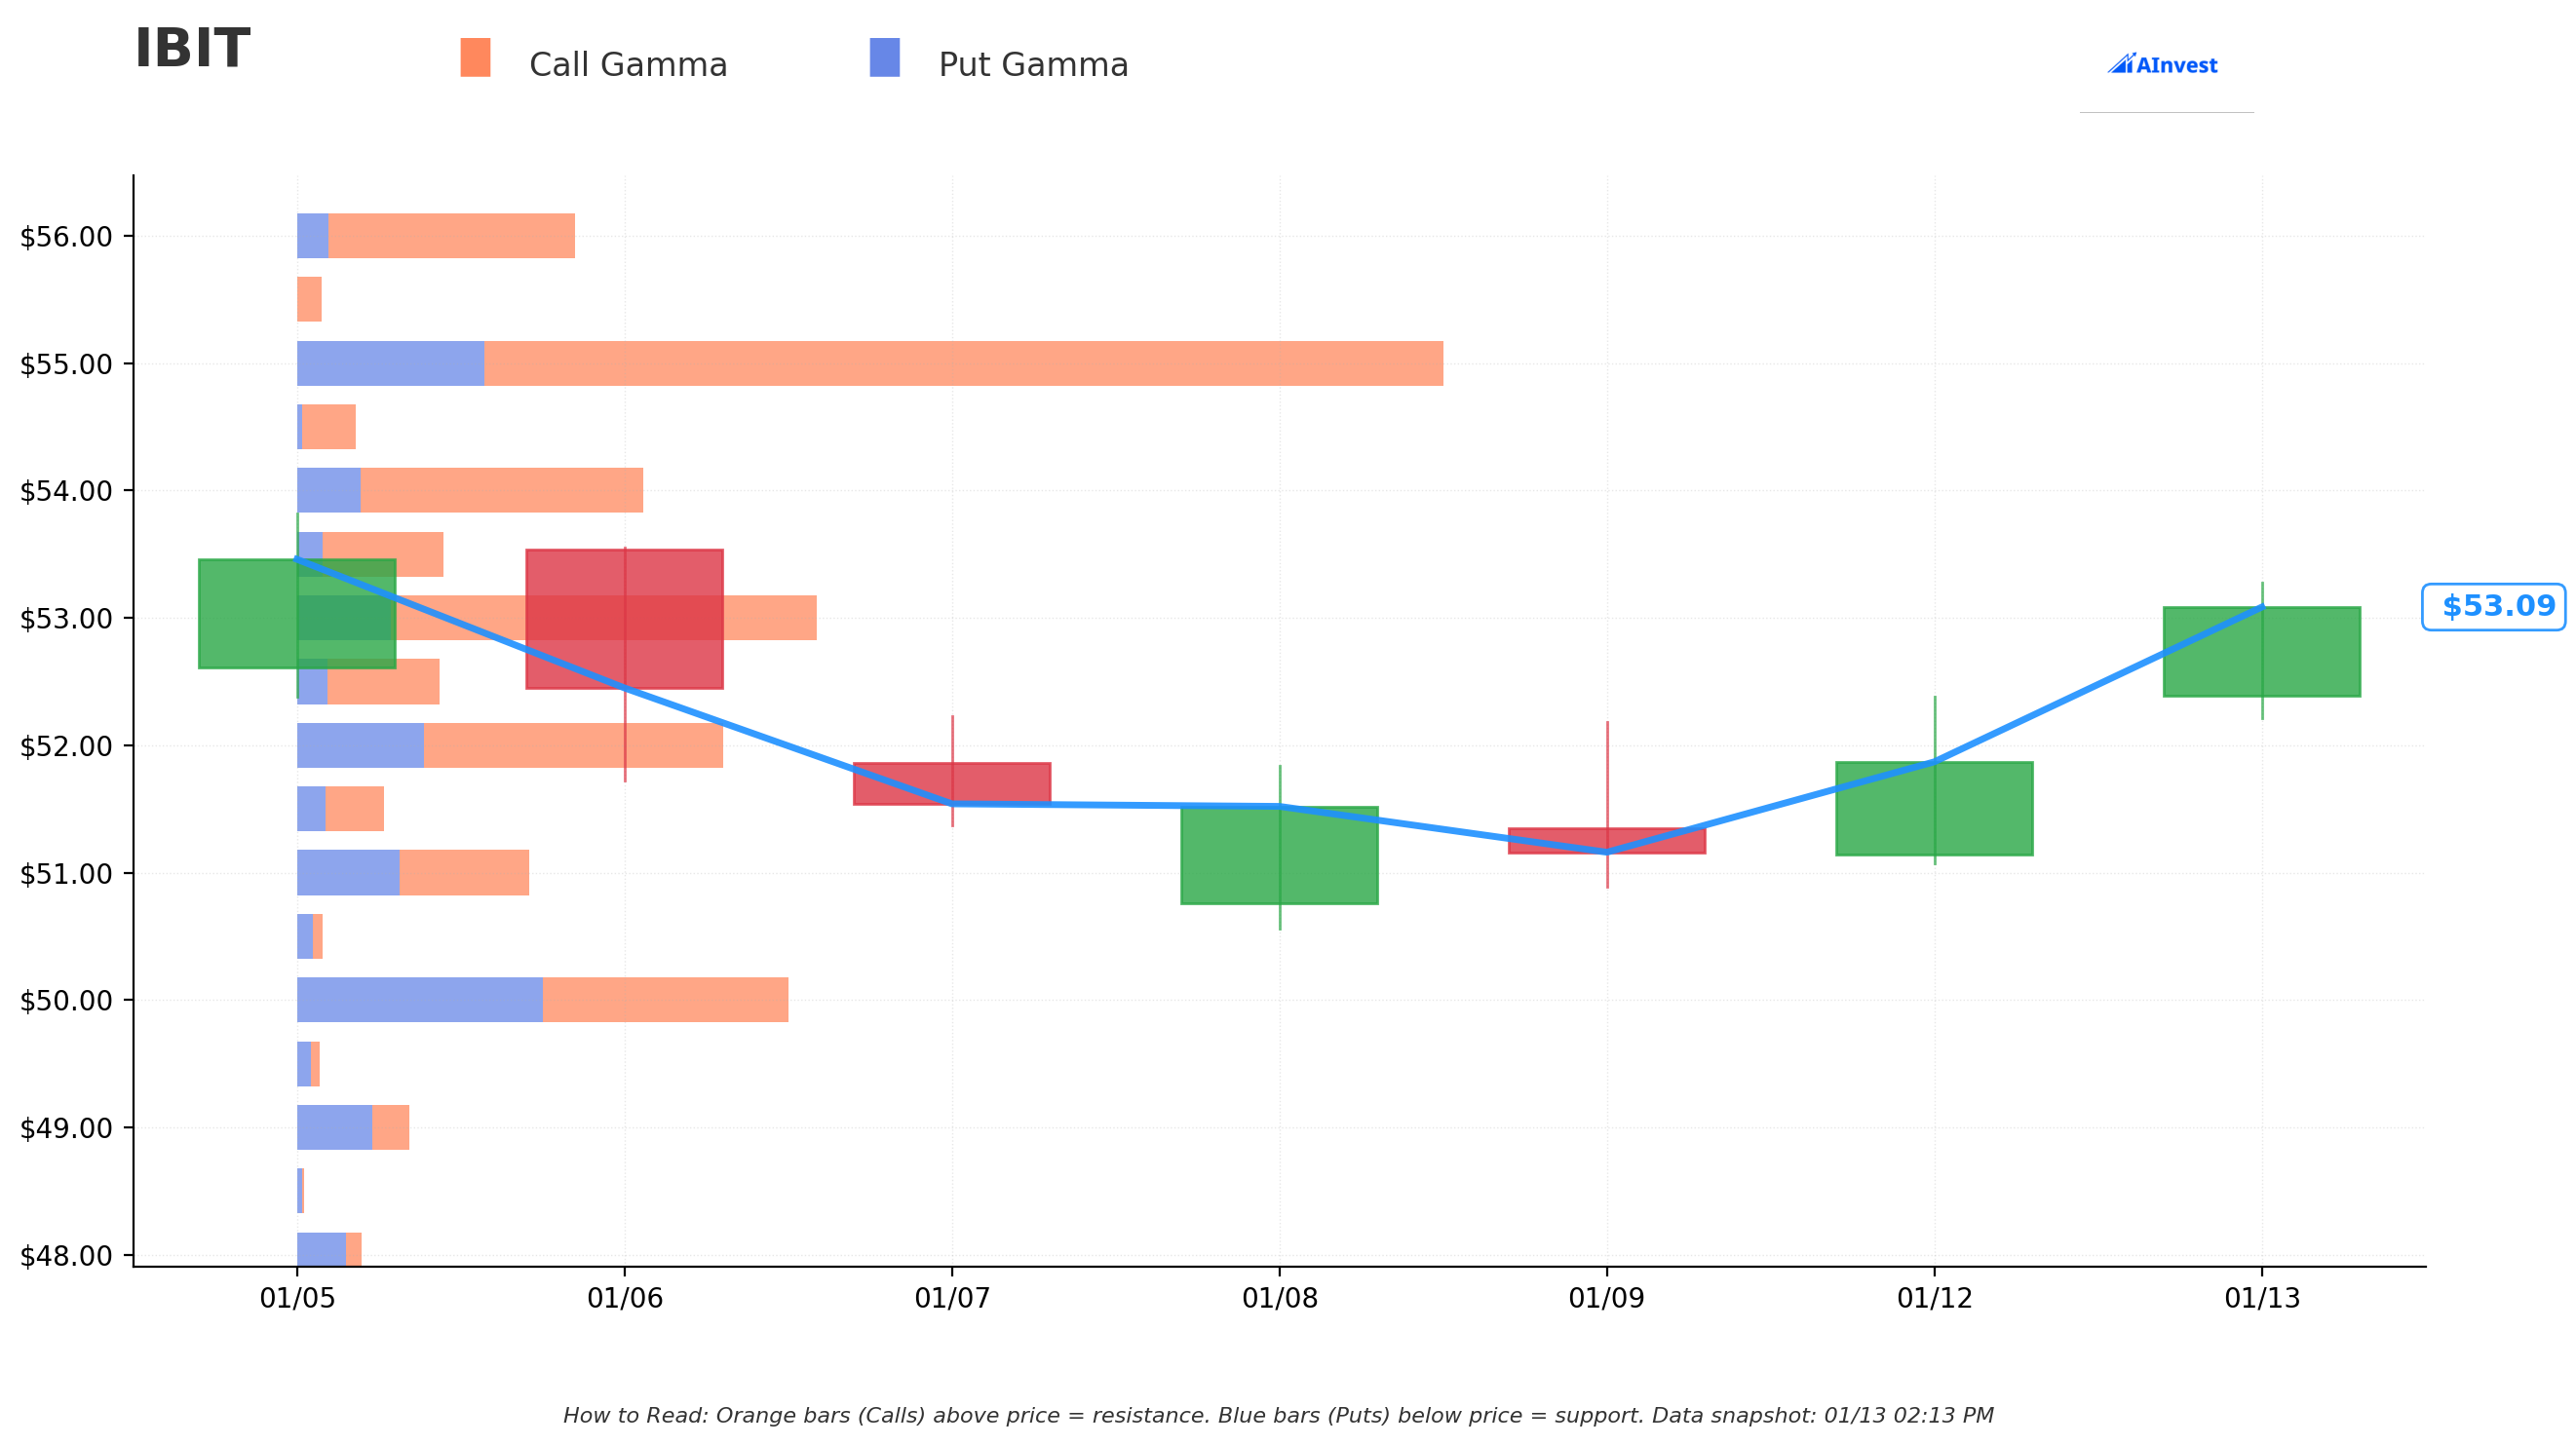
Current Price: $53.09
Key Resistance Levels (Call Gamma):
| Strike | Net GEX | Distance | Significance |
|---|---|---|---|
| $55 | 92.6 | +3.6% | Strongest Resistance - Massive call gamma wall |
| $54 | 26.3 | +1.7% | First hurdle above current price |
| $56 | 26.0 | +5.5% | Secondary resistance |
| $60 | 27.8 | +13% | The strike being closed today |
Key Support Levels (Put Gamma):
| Strike | Net GEX | Distance | Significance |
|---|---|---|---|
| $53 | 39.9 | -0.2% | Immediate Support - Right at current price |
| $52 | 20.4 | -2.1% | Next support zone |
| $51 | 3.2 | -3.9% | Light support |
| $50 | -0.1 | -5.8% | Neutral zone - can flip either way |
Gamma Summary:
- Total Call GEX: 558.2 (Bullish positioning)
- Total Put GEX: 221.7
- Net Bias: BULLISH
- The $55 Wall: This is where the action is - 92.6 net GEX creates serious resistance
Translation: The options market shows bullish positioning overall, but $55 is going to be tough to crack. Below $53, support thins out quickly toward $50.
Implied Move-Based Support & Resistance
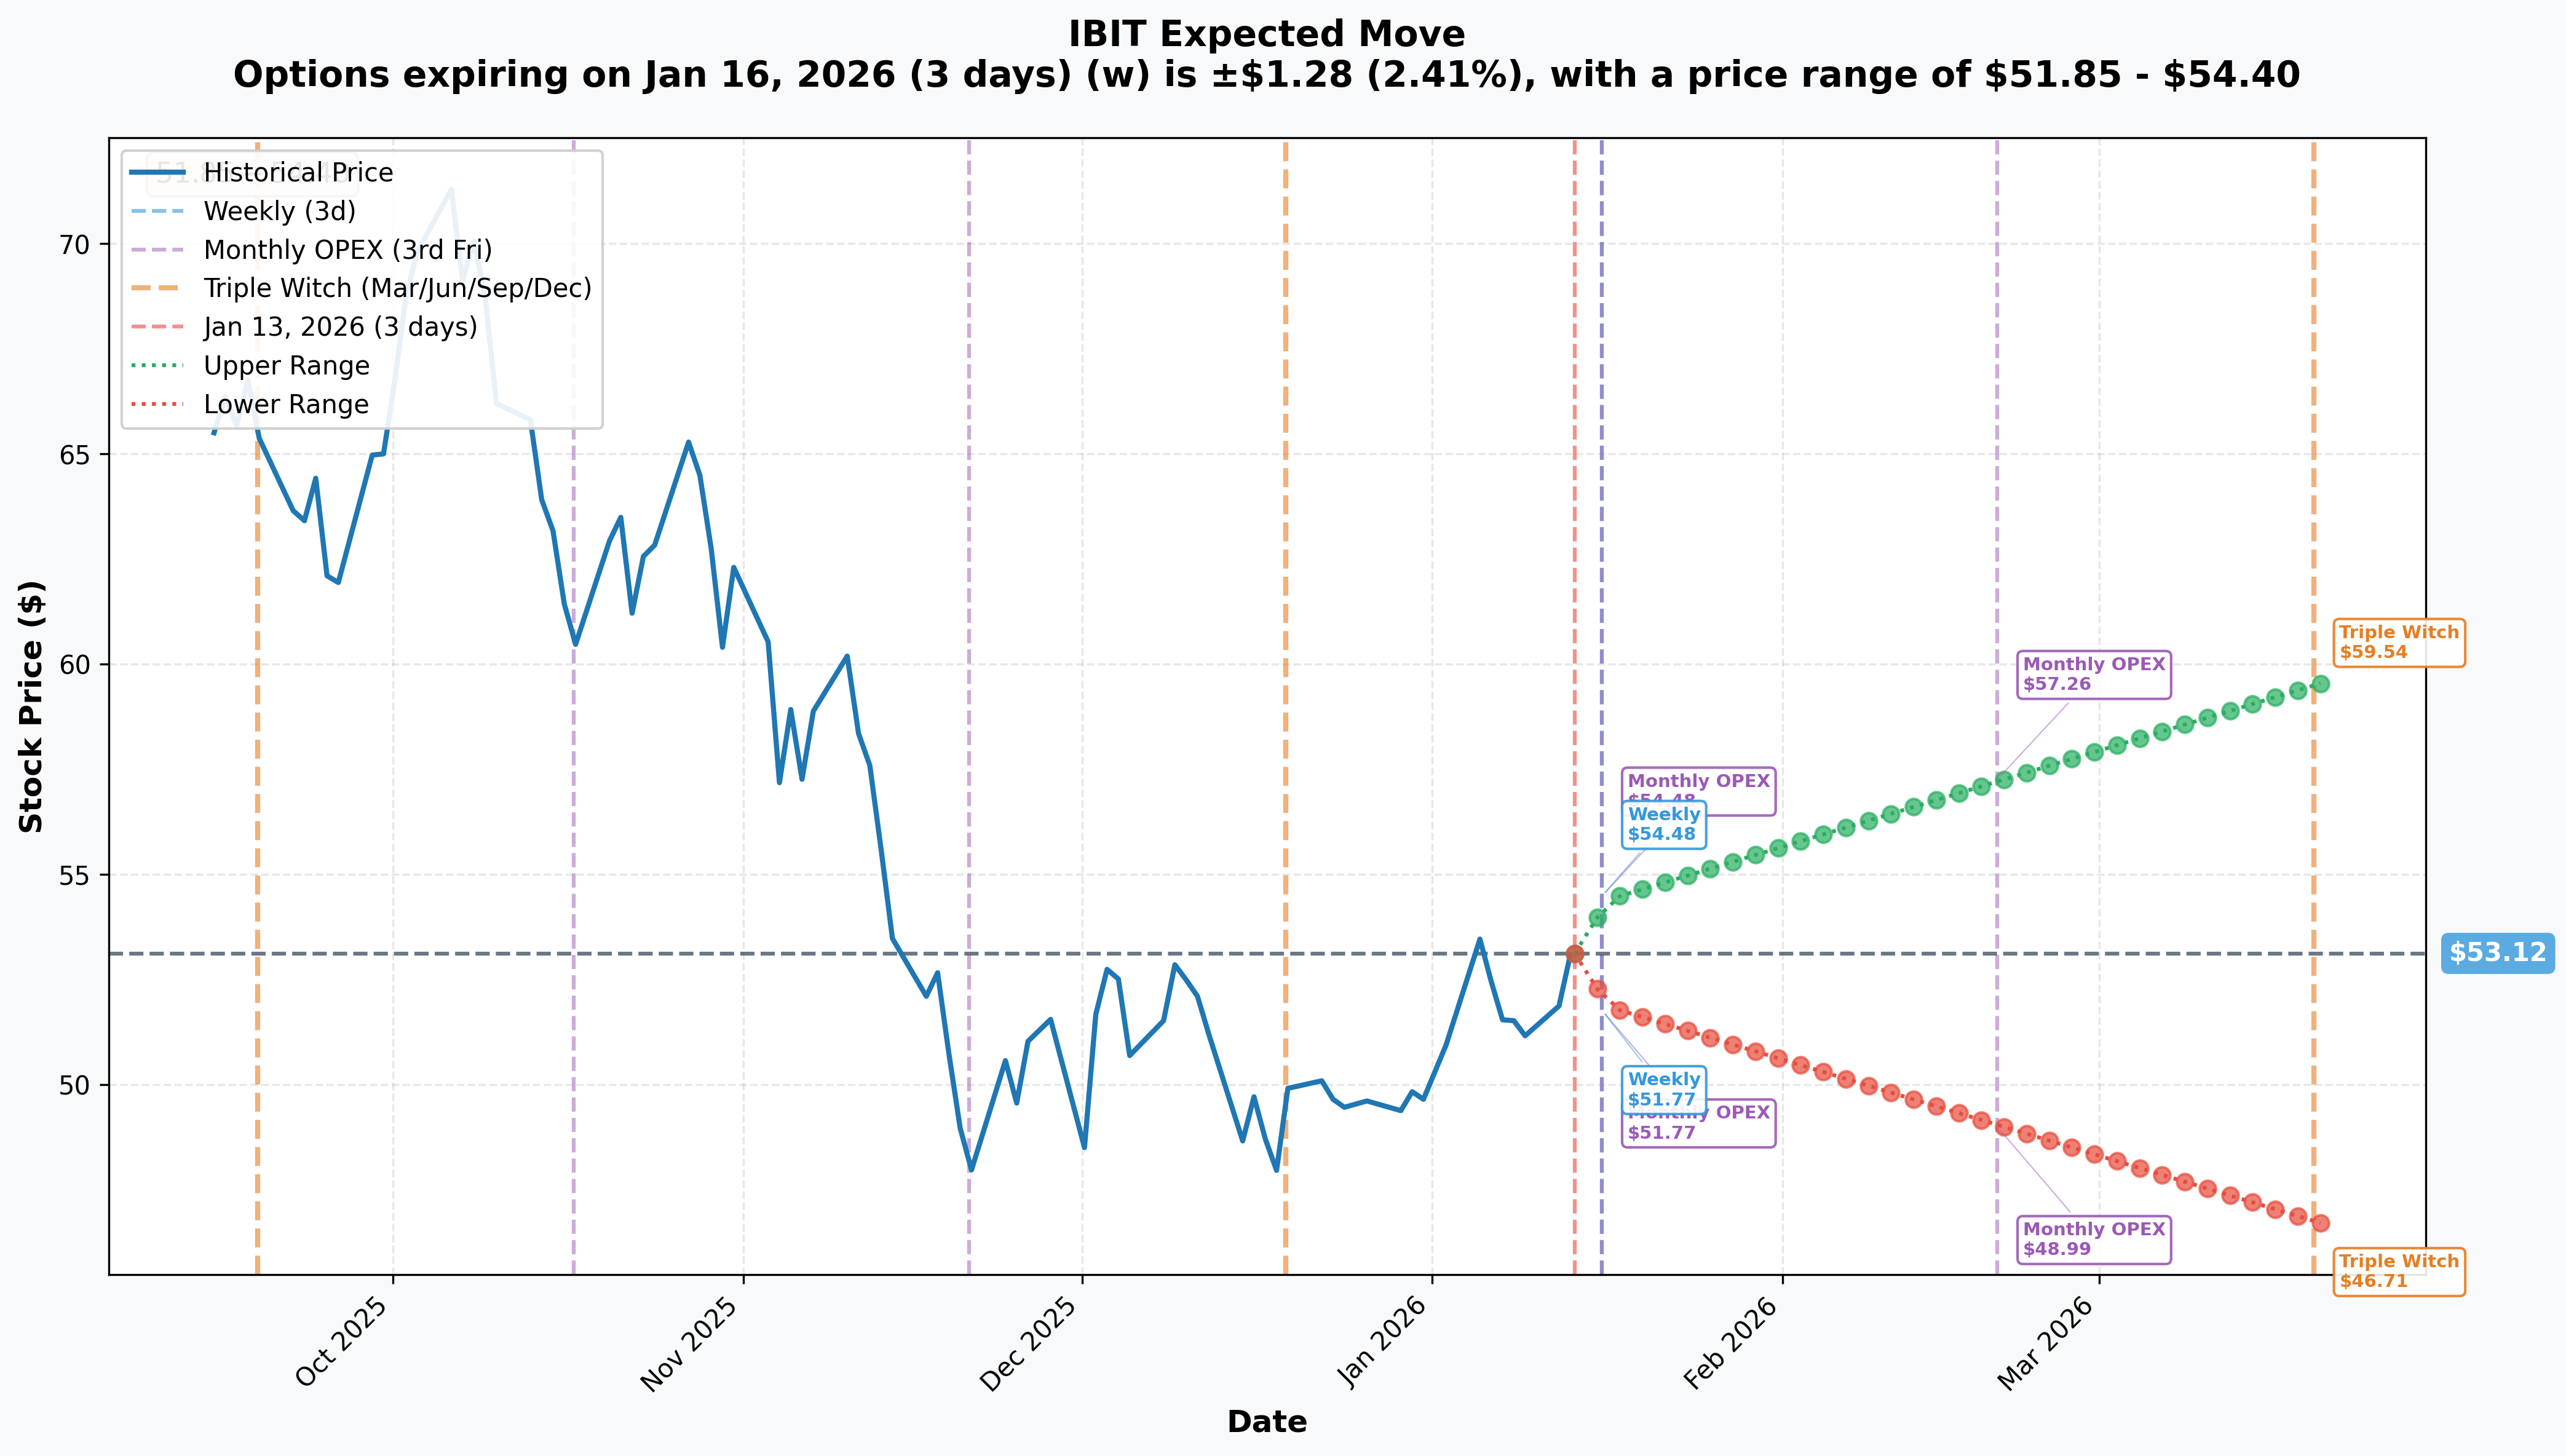
Weekly Implied Move (Expires 2026-01-16):
- Upper Range: $54.40 (+2.4%)
- Lower Range: $51.85 (-2.4%)
- Expected Range: $51.85 - $54.40
Monthly OPEX (January 16, 2026):
- Upper: $54.48
- Lower: $51.77
Quarterly Triple Witch (March 20, 2026):
- Upper Range: $59.54 (+12.1%)
- Lower Range: $46.71 (-12.1%)
- Wide range reflects Bitcoin's volatility
What This Tells Us: The LEAP trade being closed ($60 strike, Jan 2027) is well outside even the quarterly implied move. For IBIT to reach $60 by January 2027, Bitcoin would need to rally roughly 15% from current levels. The quarterly triple witch upper bound of $59.54 suggests the market sees this as achievable in a bullish scenario.
Catalysts
Upcoming Catalysts
| Date | Event | Potential Impact |
|---|---|---|
| Jan 13, 2026 | U.S. CPI Release | Fed policy expectations; risk sentiment |
| Jan 15, 2026 | CLARITY Act Markup | Major regulatory clarity catalyst |
| Jan 15, 2026 | MSCI Index Decision | Could force $10-15B in institutional sales if BTC treasury companies excluded |
| Jan 29, 2026 | FOMC Meeting | Rate decision and forward guidance |
| Q1 2026 | SEC IBIT Options Decision | Enhanced institutional hedging if approved |
| May 2026 | Fed Chair Transition | Potential policy shift under new leadership |
| H1 2026 | Potential Govt BTC Purchases | Strategic Reserve expansion |
| Nov 3, 2026 | U.S. Midterm Elections | Congressional control affects crypto policy |
Recent Catalysts (Already Happened)
| Event | What Happened | Impact |
|---|---|---|
| Oct 2025 ATH | Bitcoin hit all-time high of $126,198 | Peak before correction |
| Nov-Dec 2025 | $4.57B in ETF outflows | Sharp correction period |
| Jan 2, 2026 | IBIT led $287.4M inflows | Inflows resuming |
| Jan 6, 2026 | Largest ETF inflow in 3 months ($697M) | Institutional bid returning |
| March 2025 | Strategic Bitcoin Reserve established | Government holding 200,000+ BTC |
| July 2025 | GENIUS Act signed into law | First federal stablecoin framework |
Price Targets & Probabilities
Based on gamma levels, implied move data, and upcoming catalysts:
Bull Case: $59-60 (Target by Q1 2026)
Probability: 25%
- Requires CLARITY Act passage unlocking institutional flows
- Grayscale expects new ATH in H1 2026
- Government Bitcoin purchases would be massive catalyst
- Needs to break through $55 gamma wall first
Base Case: $51-55 (Range-Bound)
Probability: 55%
- Currently sitting between gamma support ($53) and resistance ($55)
- Implied move suggests $51.85-$54.40 range this week
- Bitcoin consolidating after 27% correction
- Most likely scenario near-term
Bear Case: $46-50 (Breakdown Scenario)
Probability: 20%
- Key support at $74,400-$78,200 BTC level
- MSCI exclusion could trigger forced selling
- Inflation stickiness (2.7% CPI) limiting Fed flexibility
- MicroStrategy's $8.22B debt overhang
Trading Ideas
Conservative: Cash-Secured Put Write
Strategy: Sell IBIT Feb 2026 $50 Put
- Premium: ~$1.50-2.00
- Max Profit: Premium received
- Breakeven: ~$48
- Why This Works: Collect premium while waiting for entry. If assigned, you own IBIT at effectively $48 - below current price and near quarterly implied move low of $46.71
Best For: Premium collectors who want Bitcoin exposure at a discount
Balanced: Covered Call Enhancement
Strategy: Own IBIT shares + Sell Feb 2026 $55 Calls
- Current Price: $52.91
- Call Premium: ~$1.00
- Upside Cap: $55 (limited by gamma wall anyway)
- Why This Works: The $55 gamma wall makes breakout unlikely. Collect income while holding. If called away, you sell at resistance.
Best For: Swing traders already holding IBIT
Aggressive: Call Spread on Clarity Act
Strategy: Buy IBIT Jan 16 $53 Call / Sell $55 Call
- Net Debit: ~$0.80
- Max Profit: $1.20 (150% return)
- Breakeven: $53.80
- Why This Works: Plays the CLARITY Act markup catalyst on Jan 15. Limited risk, leveraged upside if crypto regulation clarity sparks a move.
Best For: YOLO traders betting on the regulatory catalyst
Risk Factors
What Could Go Wrong:
- Bitcoin Breakdown: If BTC falls below $74,400-$78,200 support, could see cascade to $50,000+ (Seeking Alpha analysis)
- MSCI Exclusion: January 15 decision could force $10-15B in institutional selling of Bitcoin treasury companies
- Inflation Sticky: CPI at 2.7% vs 2% target limits Fed rate cut flexibility
- MicroStrategy Risk: 59% stock decline and $8.22B debt could force BTC sales
- Midterm Elections: November 2026 could flip Congressional control and stall crypto-friendly policy
- Volatility: Bitcoin 30-day volatility exceeded 45 in November 2025
Why Someone Closed This LEAP: The fact that someone exited a $4.2M bullish position a full year before expiration suggests caution. They may see:
- Near-term headwinds outweighing long-term thesis
- Better risk/reward opportunities elsewhere
- Need to reduce portfolio volatility
The Bottom Line
Real talk: This $4.2M LEAP position close isn't a panic signal - it's a calculated exit. Someone who bet big on Bitcoin hitting $60+ by January 2027 decided today was the day to cash out.
What This Means For You:
If You Already Own IBIT: Consider the $55 gamma wall as your near-term ceiling. This is a consolidation phase. Selling covered calls against your position makes sense here. The catalyst calendar is loaded (CLARITY Act, MSCI decision, Fed meetings), so expect volatility.
If You're Watching From The Sidelines: Wait for a cleaner entry. The $50-52 zone offers better risk/reward based on gamma support. The quarterly implied move low of $46.71 could come into play if we see a broader risk-off move.
If You're Bearish: The person who just exited might agree with you. Key levels to watch: Break below $50 could accelerate toward $46. But be careful - Goldman Sachs sees regulation driving next wave of institutional adoption.
Mark Your Calendar:
- January 15: CLARITY Act Markup + MSCI Decision (Double catalyst day)
- January 29: FOMC Meeting
The Trade Signal: A 5,000-contract LEAP position close is meaningful but not alarming. This is someone managing risk, not running for the exits. The bullish long-term case for Bitcoin remains intact (Strategic Reserve, institutional adoption, halving cycle), but near-term uncertainty is elevated.
Track IBIT: AInvest ETF Page
Option Chart: IBIT Jan 2027 $60 Call
Disclaimer: This analysis is for educational purposes only and does not constitute financial advice. Options trading involves substantial risk of loss and is not suitable for all investors. Past performance does not guarantee future results. Always do your own research and consider your risk tolerance before trading.