🎯 IBM Options Analysis: Big Money Makes a Big Bet
September 26, 2025 | Unusual Options Activity Alert
💼 Quick Company Overview
International Business Machines (IBM) 📊 Market Cap: $262.17 billion 🏢 Sector: Computer & Office Equipment 💡 What They Do: IBM provides software, IT consulting services, and hardware to help business customers modernize their technology workflows
🚨 Unusual Options Activity Detected
Someone just dropped $3.8 million on IBM puts today! Let's break down what we saw on the tape:
Options Tape Analysis
| Time | Symbol | Buy/Sell | Type | Expiration | Premium | Strike | Volume | OI | Size | Spot Price | Option Price |
|---|---|---|---|---|---|---|---|---|---|---|---|
| 12:16:42 | IBM20251121P285 | BUY | PUT | 2025-11-21 | $3.8M | $285 | 2,900 | 278 | 2,500 | $285.23 | $15.35 |
📈 Unusual Score Calculation
- Premium Size: $3.8M (Massive institutional-sized trade)
- Volume/OI Ratio: 10.4x (2,900 volume vs 278 open interest)
- Unusual Score: 9.5/10 - This is serious money making a serious bet!
📊 Technical Analysis
YTD Performance
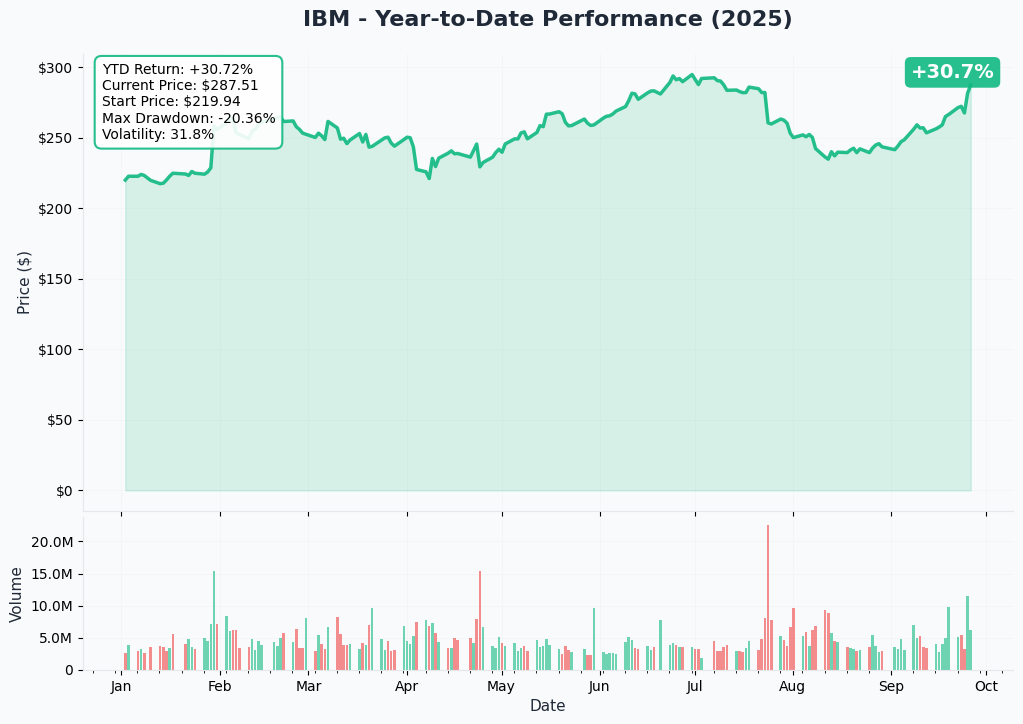
Looking at IBM's year-to-date chart, here's what jumps out:
- Current Price: $287.51
- YTD Return: +30.72% (Crushing it! 🚀)
- Start of Year: $219.94
- Peak: Around $300 (touched briefly)
- Volatility: 31.8% (Pretty normal for a tech giant)
The stock has been on a tear this year, up over 30%! But notice how it peaked around $300 and has been pulling back. That's where our big put buyer might be seeing opportunity.
Gamma Levels (Support & Resistance)
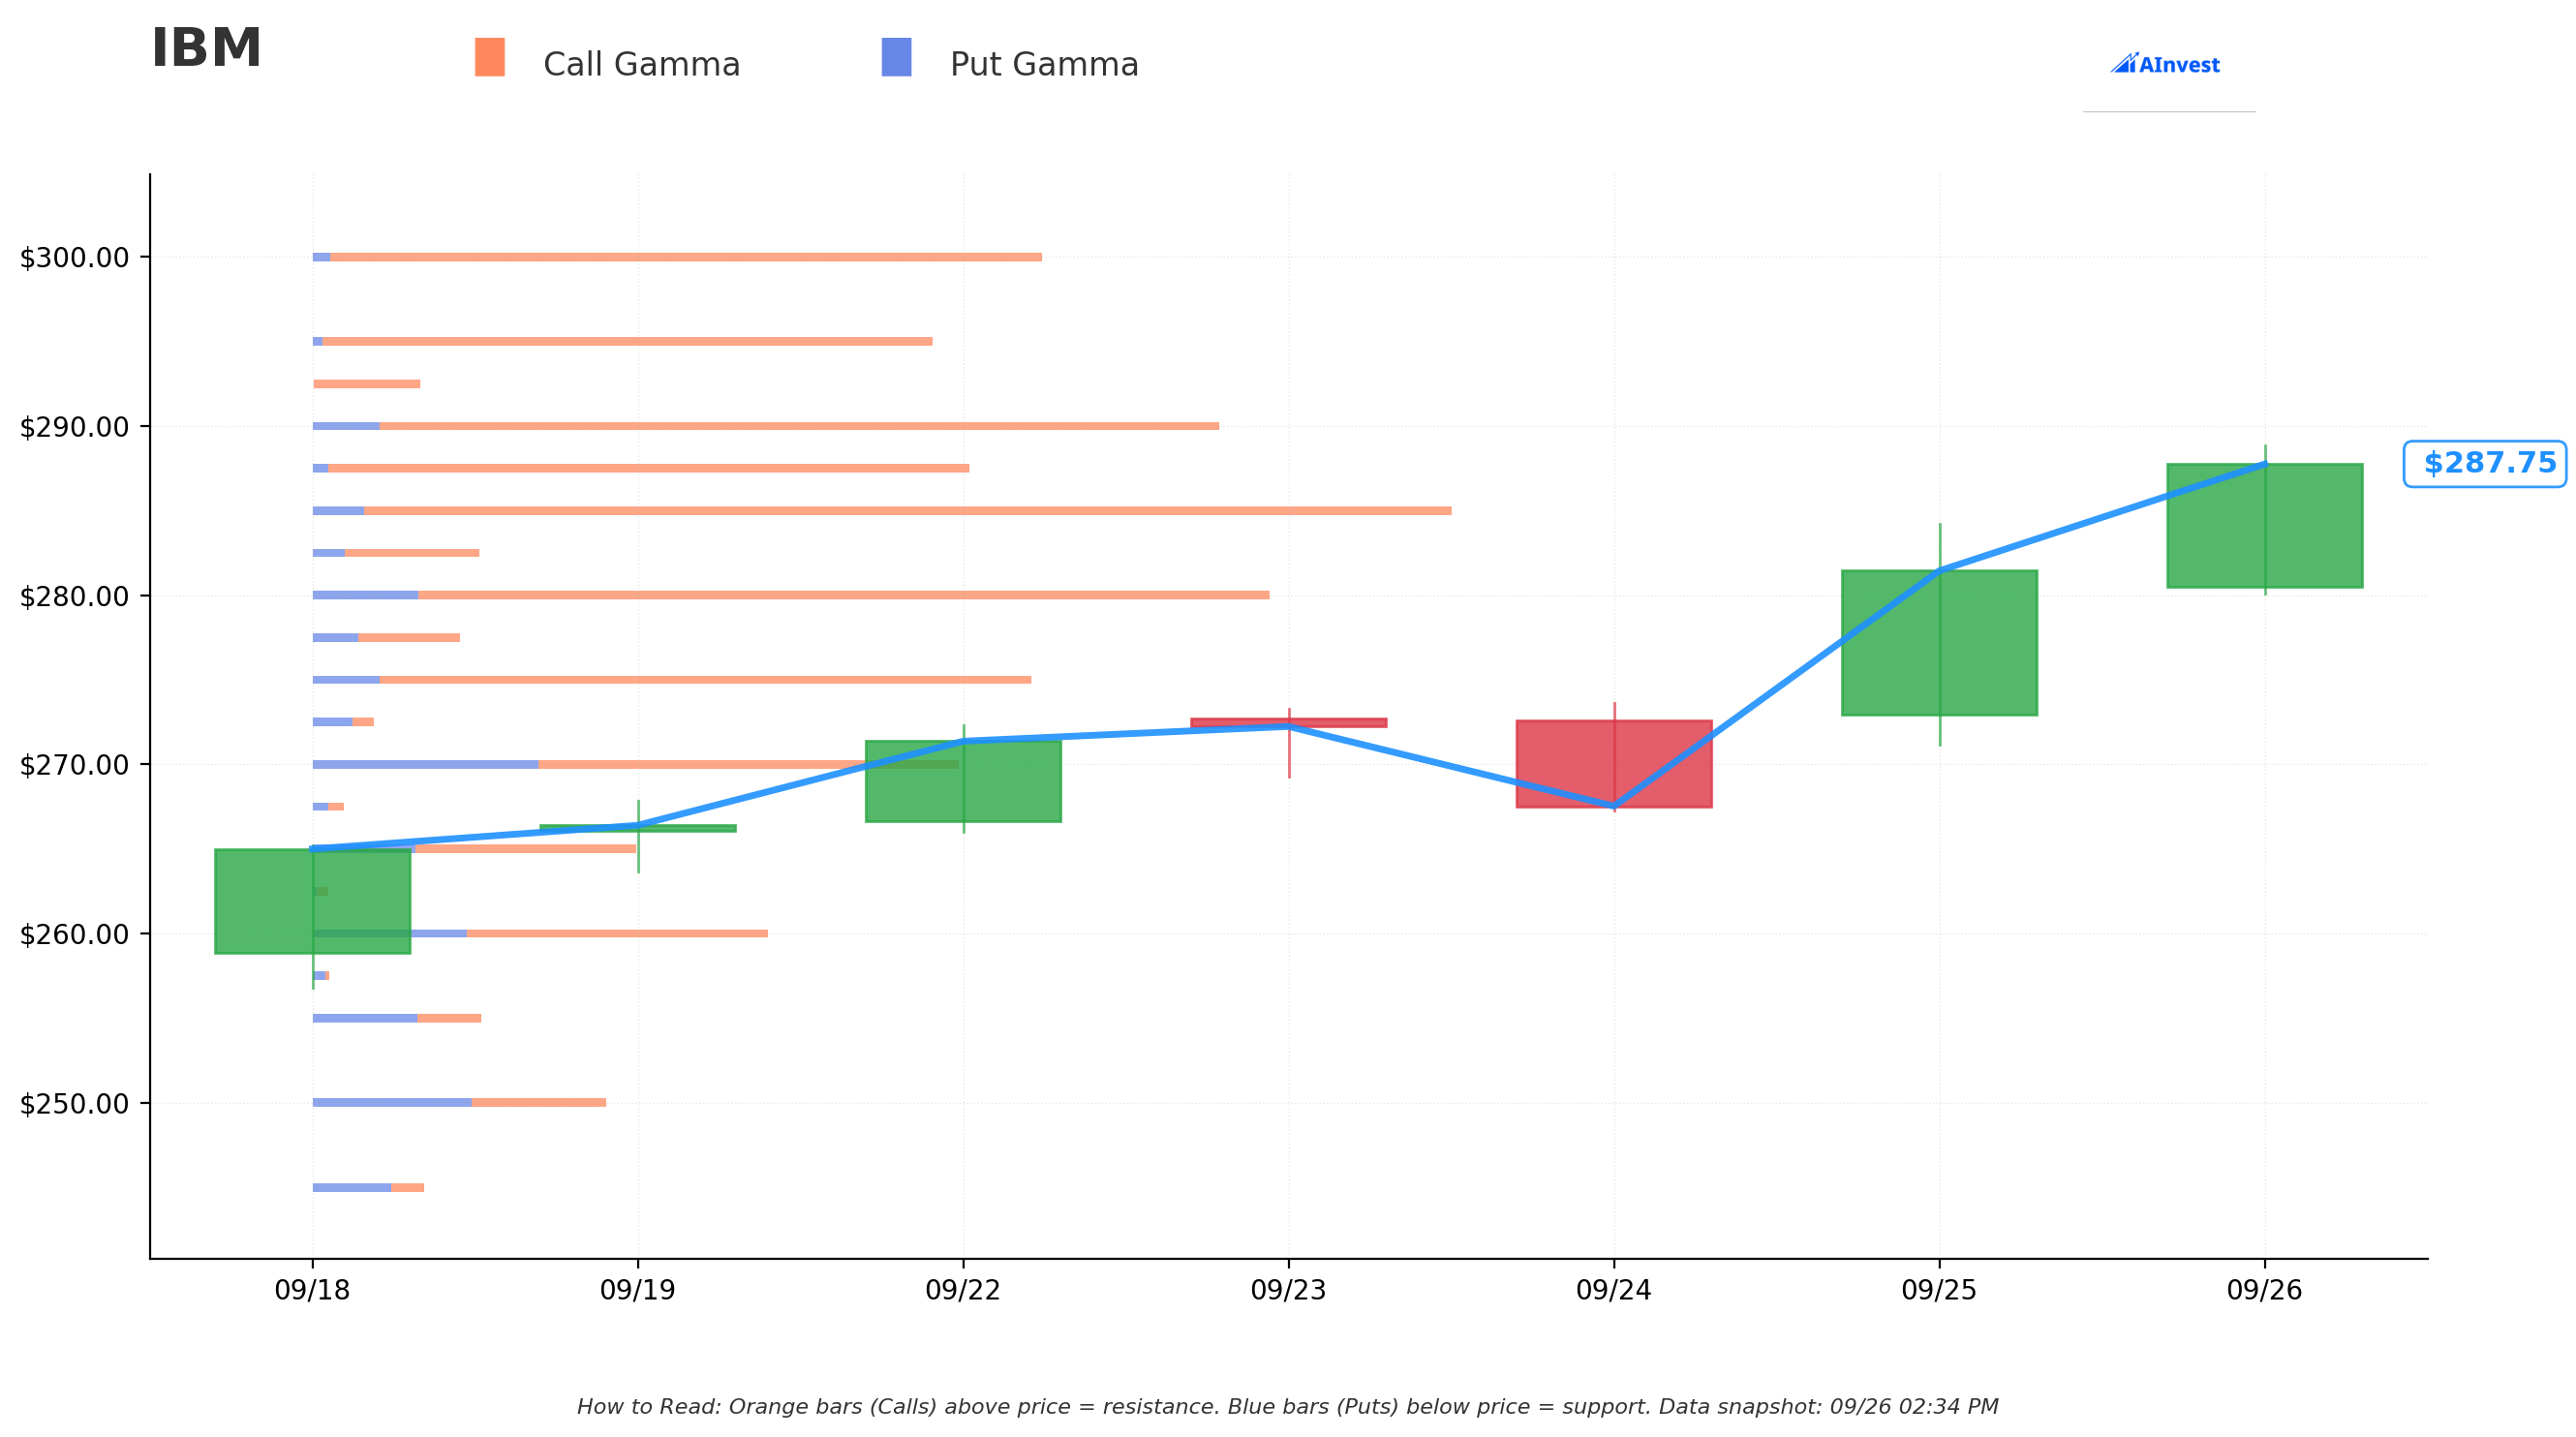
Looking at the gamma chart, here's what the options market is telling us about key price levels:
🛡️ Support Levels (Where the stock might find buyers):
- $287.50: Strongest support (we're basically sitting right on it!)
- $285: Major support with high gamma concentration
- $280: Next significant support level
- $275: Strong floor if things get ugly
🚧 Resistance Levels (Where selling might kick in):
- $290: First major resistance (just $2.50 away)
- $295: Secondary resistance
- $300: The big psychological level and recent peak
The gamma chart shows massive call gamma (orange bars) above the current price, which means market makers will likely sell if we rally. Meanwhile, put gamma (blue bars) below suggests they'll buy on dips. We're stuck in a range!
🔮 Upcoming Catalysts
Near-Term Events
🗓️ Q3 2025 Earnings - October 22, 2025 (Less than a month away!)
- Expected EPS: $2.44
- Expected Revenue: $16.09 billion
- IBM raised full-year free cash flow guidance to above $13.5 billion Source
Major Growth Drivers
💻 Quantum Computing Breakthrough
- IBM just achieved world's first quantum-enabled algorithmic trading with HSBC
- 34% improvement in bond trading predictions! Source
- Target: Fault-tolerant quantum computer by 2029
🤖 AI Explosion
- WatsonX order book surged from $2B to $7.5B in just one year! Source
- AI-enabled workflows expected to grow from 3% to 25% by end of 2025
- Consulting AI pipeline now exceeds $6 billion
☁️ Hybrid Cloud Leadership
- Red Hat delivering 7 consecutive quarters of high-teens growth
- OpenShift hit $1.7 billion annual recurring revenue (+25% growth)
- Global hybrid cloud market projected to reach $558.6 billion by 2032 Source
🖥️ New Mainframe Cycle
- z17 mainframe revenue jumped 67% year-over-year in Q2 2025! Source
- For every $1 in mainframe hardware, IBM generates $3-4 in software/services
🎯 Price Targets & Scenarios
Based on gamma levels and technical analysis:
🐂 Bull Case (30% probability)
- Target: $300
- Catalyst: Beat on earnings + strong AI guidance
- Timeline: Post-earnings (late October)
📊 Base Case (50% probability)
- Target: $285-290 range
- Catalyst: In-line earnings, market consolidation
- Timeline: Next 30 days
🐻 Bear Case (20% probability)
- Target: $275
- Catalyst: Earnings miss or weak guidance
- Timeline: Post-earnings selloff
💡 Trading Ideas
Conservative Play 🛡️
Sell Cash-Secured Puts
- Strike: $280
- Expiration: October 18, 2025 (before earnings)
- Premium: ~$2.50
- Why: Collect premium while waiting to buy at support
Balanced Strategy ⚖️
Put Spread (Following the Smart Money)
- Buy: $285 Put (November expiration)
- Sell: $275 Put (November expiration)
- Net Cost: ~$4.50
- Max Profit: $5.50 if IBM closes below $275
- Why: Similar to the big trade but with defined risk
Aggressive Play 🚀
Call Butterfly
- Buy: 1x $285 Call
- Sell: 2x $290 Calls
- Buy: 1x $295 Call
- Expiration: November 15, 2025
- Max Profit: At $290 (right at resistance)
- Why: Profit from range-bound action
🤔 What's the Big Trade Telling Us?
That massive $3.8M put purchase isn't necessarily bearish - here's why:
- Hedge Position: With IBM up 30% YTD, big funds might be protecting gains
- Earnings Play: Positioning for volatility around October 22 earnings
- Technical Setup: Stock rejected at $300, now testing support at $287.50
The November expiration gives them time through earnings. The $285 strike is right at major support - smart positioning!
📝 Final Thoughts
IBM isn't your grandpa's boring tech stock anymore! They're making real moves in AI and quantum computing. But after a 30% run, some consolidation is healthy.
That big put buyer might know something, or they might just be protecting massive gains. Either way, the $285-290 zone is the battlefield to watch.
My Take: The stock's extended but fundamentally strong. I'd look to sell puts at $280 for income or follow the smart money with put spreads if you're bearish. Just remember - earnings are coming October 22nd, and that's when the real fireworks happen!
Disclaimer: This is analysis, not financial advice. Options trading is risky - you can lose your entire investment. Always do your own research and never trade more than you can afford to lose!
Have questions? Drop them in the comments! Let's learn together! 💪
Last Updated: September 26, 2025 | 2:34 PM ET