🐋 IBM: $37.4M Calendar Spread Roll Signals Institutional Confidence Through Earnings Season!
February 4, 2026 | Unusual Activity Detected
🎯 The Quick Take
Someone just rolled a $37.4 MILLION calendar spread position on IBM - buying May 2026 $220 calls while selling October 2026 $230 calls in a coordinated 6-trade block at exactly 09:44:48. This is classic institutional positioning ahead of Q1 earnings (April 29) and Think 2026 (May 4-7), suggesting big money expects IBM to rally into the $220-$230 range by mid-year before momentum potentially slows. With IBM fresh off a Q4 beat that sent shares up 5%+, the whales are extending their bullish thesis.
💰 The Option Flow Breakdown
📊 What Just Happened
| Time | Action | Strike | Expiration | Premium | Volume |
|---|---|---|---|---|---|
| 09:44:48 | BUY CALL | $220 | 2026-05-15 | $14M | 2,900 |
| 09:44:48 | SELL CALL | $230 | 2026-10-16 | $14M | 2,200 |
| 09:44:48 | BUY CALL | $220 | 2026-05-15 | $2.4M | 416 |
| 09:44:48 | BUY CALL | $220 | 2026-05-15 | $2.4M | 772 |
| 09:44:48 | SELL CALL | $230 | 2026-10-16 | $2.3M | 2,600 |
| 09:44:48 | SELL CALL | $230 | 2026-10-16 | $2.3M | 2,900 |
Total Premium: ~$37.4M Strategy: Complex Roll (Calendar Spread) Net Position: Long May $220 calls (4,088 contracts) / Short October $230 calls (7,700 contracts)
🤓 What This Actually Means
Let me break this down for you. This trader is executing a diagonal calendar spread - they're:
-
Buying near-term $220 calls (May 2026) - Betting IBM stays above $220 by mid-May, capturing upside through two major catalysts: Q1 earnings (April 29) and IBM Think conference (May 4-7)
-
Selling longer-dated $230 calls (October 2026) - Collecting premium by selling $10 higher strikes 5 months out, essentially financing part of the trade while capping upside at $230
Translation: This institution believes IBM will rally 23%+ from current levels (~$288) to at least $220... wait, that doesn't make sense. The $220 strike is already deep in-the-money!
This is actually a bullish continuation play. By buying deep ITM calls expiring in May, they get delta exposure (moves almost 1:1 with the stock) through earnings. By selling the October $230s (which are ~$58 OTM), they're collecting time premium while betting IBM won't blow past $230 by fall. Classic "I'm bullish but not THAT bullish" positioning.
📈 Technical Setup / Chart Check-Up
YTD Chart Analysis
IBM has been on a tear since the Q4 2025 earnings beat on January 28, 2026. The stock jumped 5.13% post-earnings and is now consolidating near 52-week highs around $288.
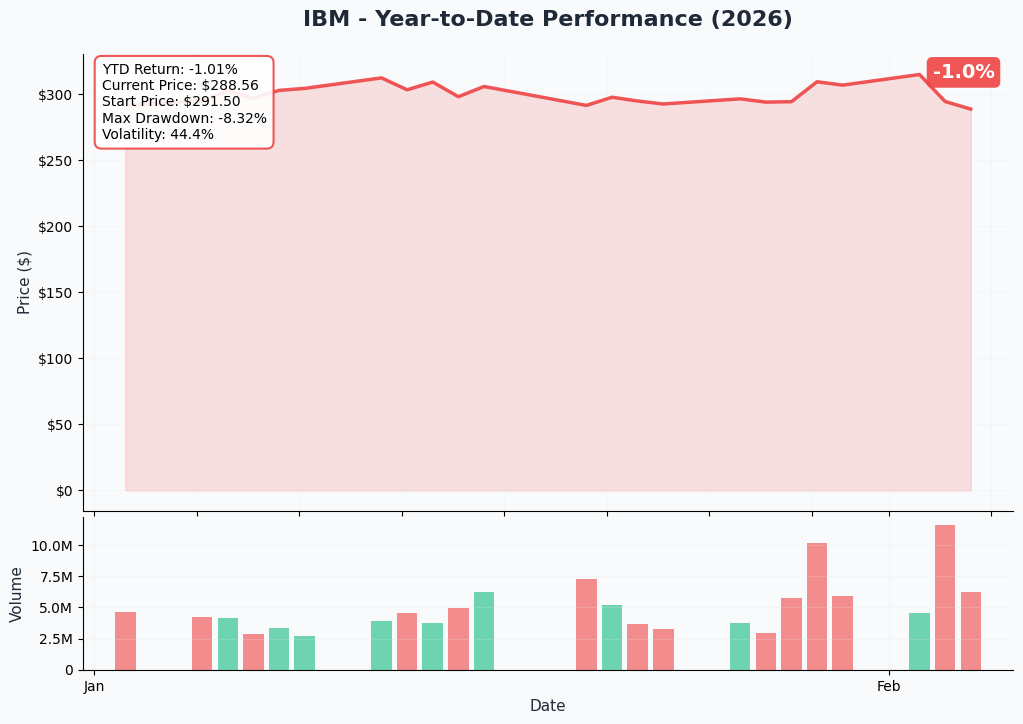
Key observations from the YTD chart:
- 📈 Stock is trading above all major moving averages
- 💪 Strong support established after the post-earnings gap up
- 🎯 Current consolidation between $285-$295 range
- 📊 Volume confirmation on the breakout
Gamma-Based Support & Resistance Analysis
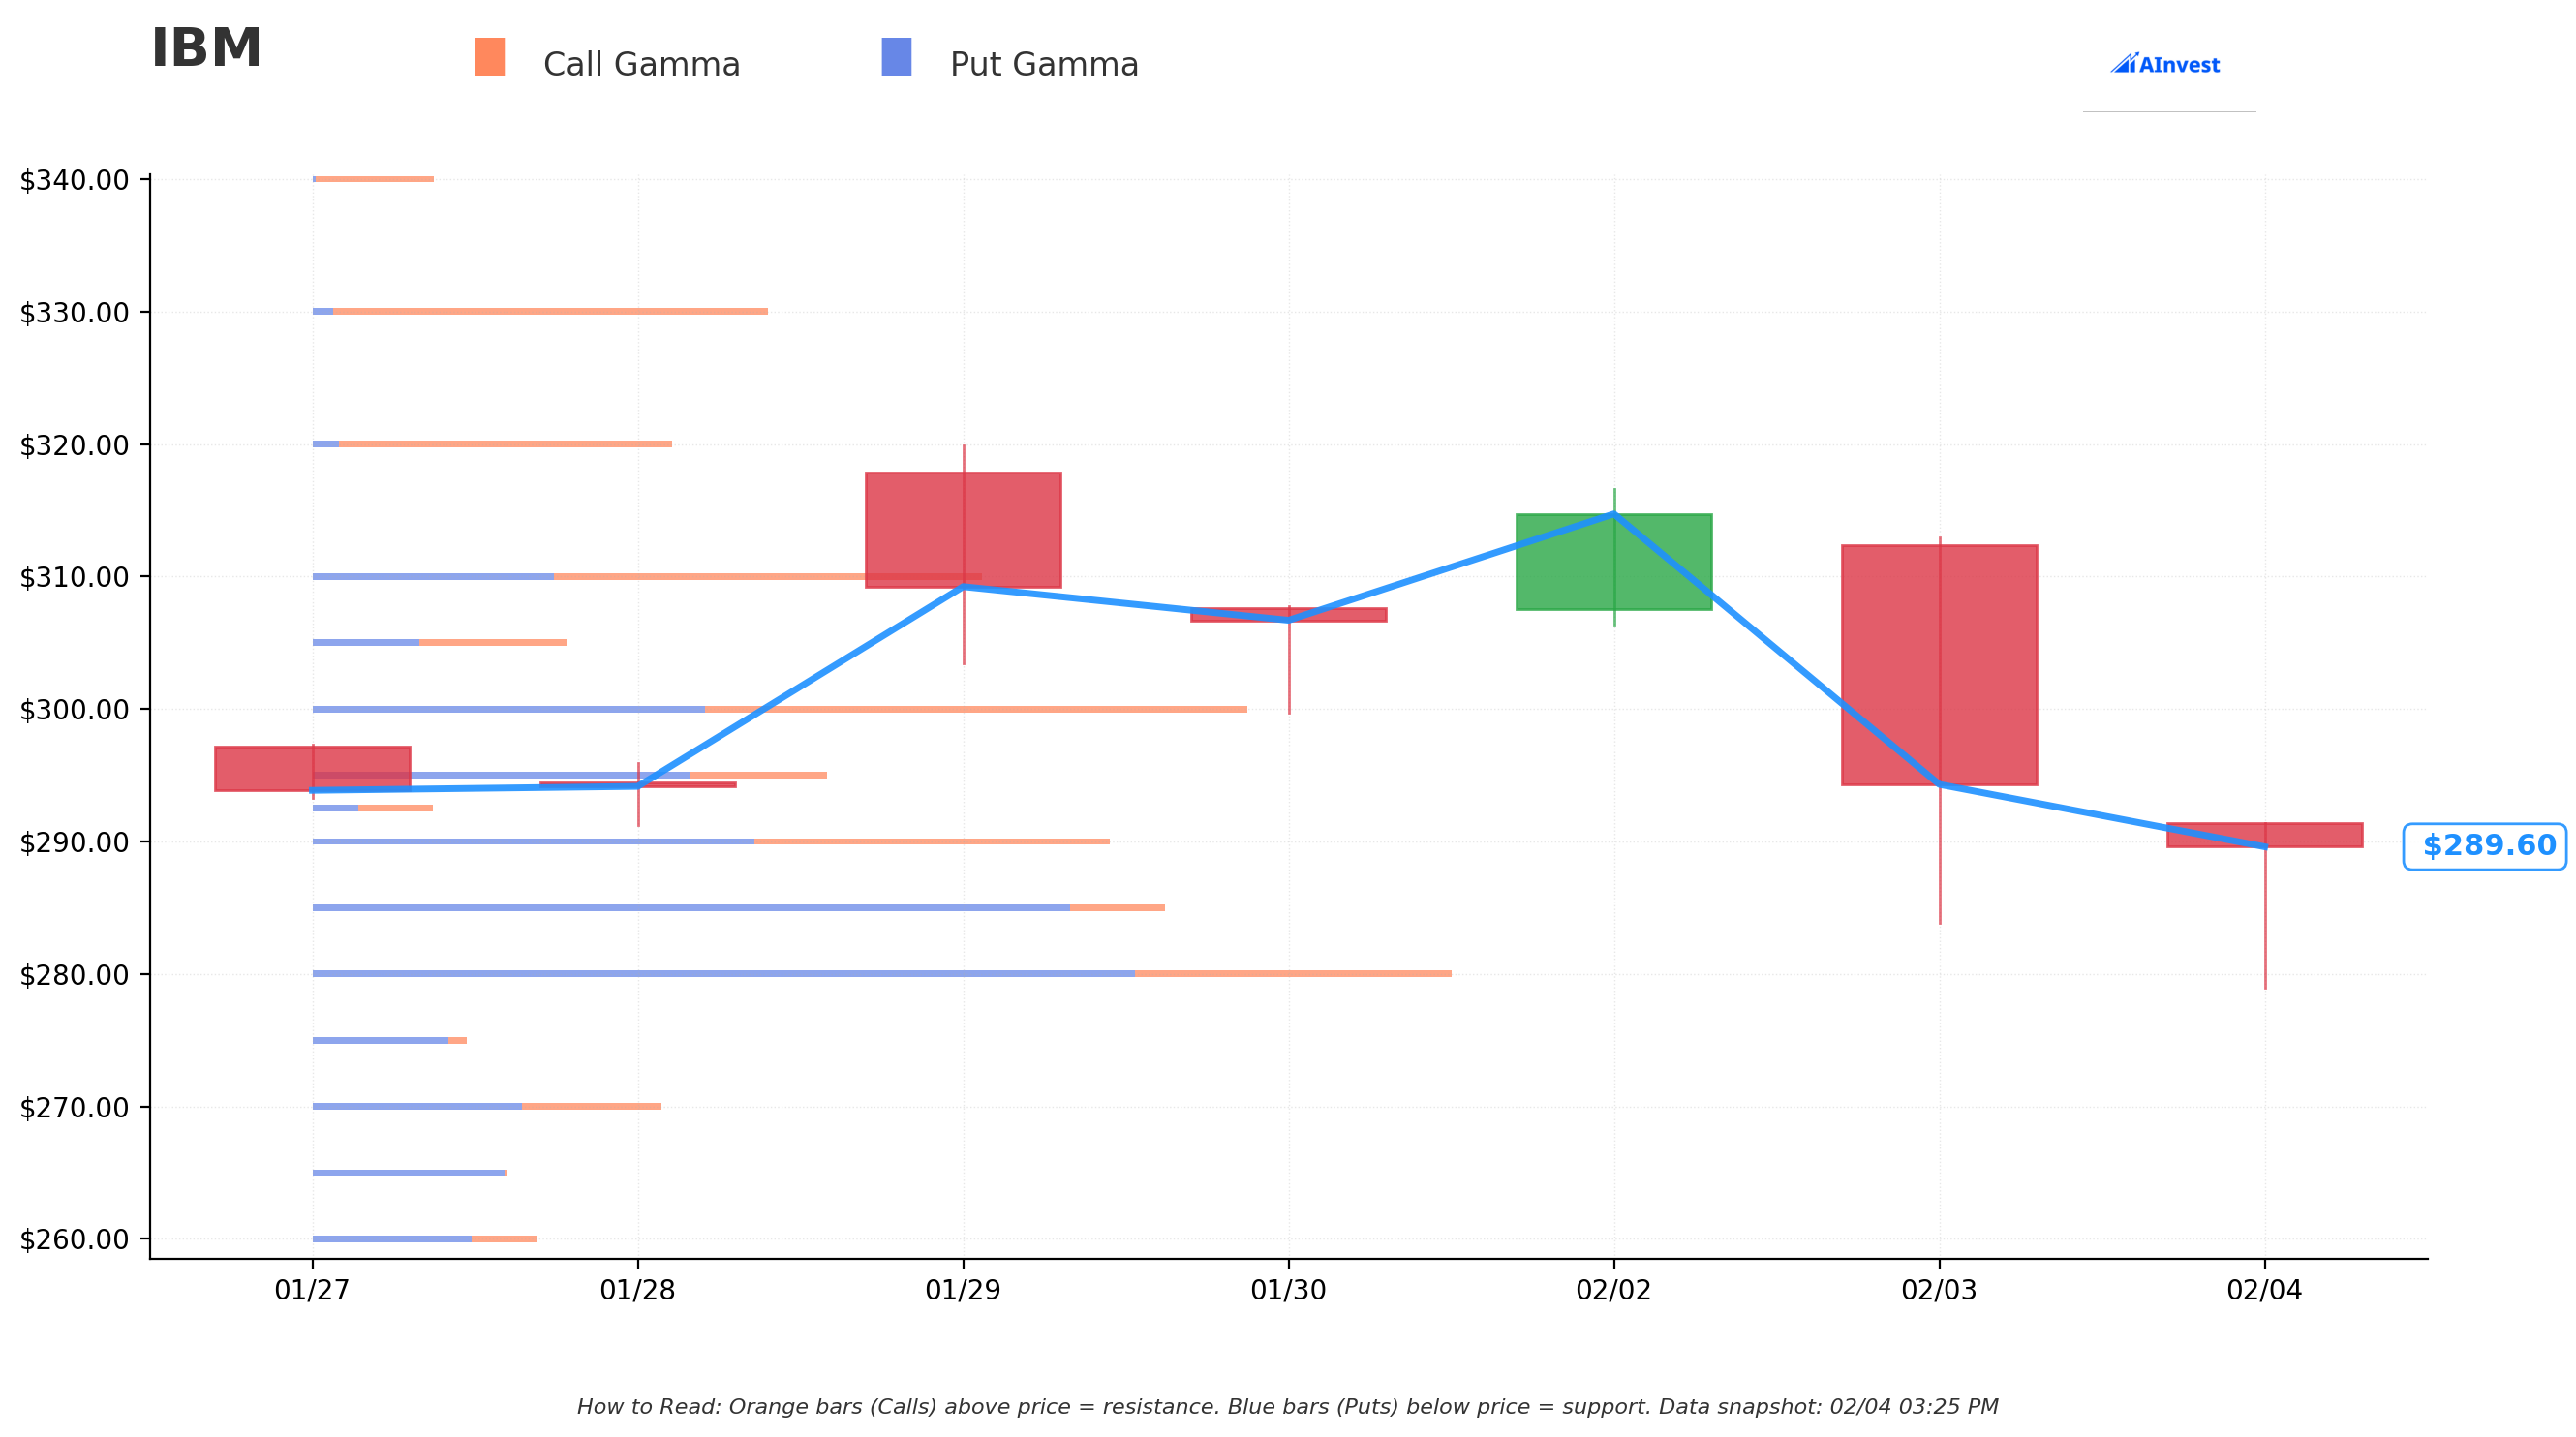
Based on the options market maker positioning (GEX data):
Support Levels (Where Dealers Buy):
| Strike | Distance from Current | Gamma Strength |
|---|---|---|
| $285 | -1.1% | Strongest - Net GEX: -5.39 |
| $280 | -2.9% | Strong - Net GEX: -4.03 |
| $270 | -6.3% | Moderate - Net GEX: -0.57 |
Resistance Levels (Where Dealers Sell):
| Strike | Distance from Current | Gamma Strength |
|---|---|---|
| $290 | +0.6% | Near-term wall |
| $300 | +4.1% | Key psychological level |
| $310 | +7.5% | Strong resistance |
| $320 | +11.0% | Major ceiling |
| $330 | +14.5% | Extended target |
What the gamma levels tell us: The options market has built a floor around $285 with heavy put gamma. Market makers will need to buy stock to hedge as price approaches this level, creating natural support. On the upside, $290 is immediate resistance, but the real battle is at $300 - a psychological barrier with significant gamma exposure.
Net GEX Bias: Bearish - Put gamma ($36.08M) exceeds call gamma ($30.57M), suggesting downside hedging flows could accelerate any selloff. But the support at $285 looks solid.
Implied Move Analysis
The options market is pricing in the following expected moves:
| Timeframe | Expiry | Move % | Price Range |
|---|---|---|---|
| Weekly | Feb 6, 2026 | +/-2.5% | $281.36 - $295.77 |
| Monthly OPEX | Feb 20, 2026 | +/-4.9% | $274.35 - $302.78 |
| Triple Witch | Mar 20, 2026 | +/-7.7% | $266.36 - $310.77 |
Key Insight: The market expects IBM to trade in a $274-$303 range through February options expiration. The $300 level coincides with both gamma resistance AND the upper implied move bound - making it a critical battleground.
🎪 Catalysts
Upcoming Events (Watch These Dates!)
| Date | Event | Potential Impact |
|---|---|---|
| Feb 10, 2026 | Dividend Ex-Date ($1.68/share) | Minor positive |
| Feb 12, 2026 | Confluent Shareholder Vote | Low risk (62% pledged support) |
| Apr 29, 2026 | Q1 2026 Earnings | HIGH - Key for May calls |
| May 4-7, 2026 | IBM Think 2026 Conference | HIGH - New AI product announcements |
| Mid-2026 | Confluent Deal Close ($11B) | HIGH - Accretive to data segment |
Recent Catalysts (Already Happened)
| Date | Event | Impact |
|---|---|---|
| Jan 28, 2026 | Q4 2025 Earnings Beat | +5.13% - Revenue $19.7B vs $19.22B expected |
| Dec 8, 2025 | $11B Confluent Acquisition Announced | Created smart data platform for GenAI |
| Oct 7, 2025 | Anthropic Partnership | Claude AI integrated into IBM enterprise software |
| June 2025 | Z17 Mainframe Launch | Best annual Z revenue in 20+ years |
The Q4 results were stellar: $4.52 EPS (beat by 5.36%), +67% mainframe revenue (highest Q4 in 20+ years), and $12.5B GenAI book of business (doubled YoY). CNBC's earnings coverage highlighted the AI momentum.
🎲 Price Targets & Probabilities
Based on gamma levels, implied moves, and upcoming catalysts:
🐻 Bear Case: $270-$275 (15% probability)
- Trigger: Q1 earnings miss, consulting segment weakness persists, or broader tech selloff
- Support floor: $270 (gamma support) / $266 (implied move floor for March)
- Why it's unlikely: Strong institutional positioning, dividend yield provides floor
⚖️ Base Case: $290-$305 (60% probability)
- Range: Current consolidation continues through Q1 earnings
- Key levels: $290 (immediate resistance) to $300-$305 (psychological + gamma)
- Catalysts: Steady execution on AI/mainframe, Confluent approval, dividend support
- Aligns with: Analyst consensus PT of $311-$315
🚀 Bull Case: $320-$330 (25% probability)
- Trigger: Blowout Q1 earnings, major AI announcement at Think 2026, or Confluent synergies exceed expectations
- Target zone: $320 (11% upside) to $330 (14.5% upside)
- Why it could happen: GenAI momentum accelerating, z17 cycle continuing, multiple analyst upgrades post-earnings
💡 Trading Ideas
🛡️ Conservative: "The Dividend Collector"
Strategy: Buy shares + sell covered calls
- Entry: Buy IBM shares at ~$288
- Sell: March 2026 $305 calls for ~$3.50 premium
- Dividend: Collect $1.68 ex-Feb 10
- Max profit: $305 - $288 + $3.50 + $1.68 = $22.18/share (7.7%)
- Breakeven: $282.82
- Why this works: You get paid to wait while collecting the dividend. If IBM rallies past $305, great - you make 7.7% in 6 weeks. If it sits here, you keep the premium and dividend.
⚖️ Balanced: "Follow the Whale"
Strategy: Diagonal calendar spread (mimicking institutional flow)
- Buy: May 2026 $280 calls (~$18.00)
- Sell: October 2026 $310 calls (~$8.50)
- Net debit: ~$9.50/contract ($950 per spread)
- Max profit: Unlimited above $310 if held through May; capped at ~$20/spread if October shorts held
- Why this works: You're following the institutional playbook - getting exposure through Q1 earnings and Think 2026 while offsetting cost. The May $280s are slightly ITM, giving you ~0.70 delta exposure.
🚀 Aggressive: "Earnings YOLO with Training Wheels"
Strategy: Bull call spread targeting Q1 earnings catalyst
- Buy: April 2026 $290 calls (~$12.00)
- Sell: April 2026 $310 calls (~$5.50)
- Net debit: ~$6.50/contract ($650 per spread)
- Max profit: $20 - $6.50 = $13.50/contract (208% return) if IBM closes above $310 by April expiry
- Breakeven: $296.50
- Why this works: You're betting IBM breaks above the $290 gamma wall and rallies into earnings. The spread caps your risk while giving you 2:1 reward potential.
⚠️ Risk Factors
What Could Go Wrong
-
Consulting Segment Weakness: Q4 showed only +1% growth at constant currency. If this persists in Q1, the stock could give back recent gains. Analysts are watching this closely.
-
Red Hat Deceleration: Growth slowed to 8% in Q4 due to federal business delays. The software segment needs Red Hat firing on all cylinders.
-
Confluent Integration Risk: The $11B acquisition is massive. Integration hiccups or slower-than-expected synergies could weigh on the stock. Market concerns remain.
-
Tech Sector Rotation: If AI hype cools or rates stay elevated, IBM's premium valuation (~20x forward) could compress.
-
Gamma Squeeze Risk: Net bearish GEX means a sharp move lower could accelerate as dealers hedge.
-
Currency Headwinds: IBM reported 3 points difference between reported and constant currency growth - a stronger dollar hurts.
🎯 The Bottom Line
Real talk: A $37.4M calendar spread doesn't happen by accident. This is institutional money positioning for IBM to perform through two major catalysts - Q1 earnings (April 29) and Think 2026 (May 4-7). They're bullish enough to buy deep ITM calls, but hedged enough to sell October $230s. Translation: "We think IBM rallies, but probably not past $230 by fall."
Here's the game plan:
| If You're... | Do This |
|---|---|
| Already Long IBM | Hold your position. Consider selling March $305 calls to enhance yield. The $285 gamma support looks solid. |
| Watching from the Sidelines | The risk/reward is decent here. Wait for a pullback to $285 support or buy the April $290/$310 call spread for earnings exposure. |
| Bearish on Tech | Respect the institutional flow. If you must fade, wait for a rejection at $290-$295 resistance. Don't fight $37M of conviction money. |
Mark Your Calendar:
- 📅 Feb 10: Dividend ex-date (last day to buy for $1.68 payout)
- 📅 Apr 29: Q1 2026 Earnings - the main event
- 📅 May 4-7: Think 2026 - potential AI announcements
The whale's message is clear: IBM's AI transformation is real, the z17 mainframe cycle is extending, and the Confluent deal positions them for enterprise data dominance. But they're not betting the farm - this is a measured bullish position that profits if IBM grinds higher, not if it moonshots.
📊 Company Overview
| Metric | Value |
|---|---|
| Company | International Business Machines (IBM) |
| Industry | Computer & Office Equipment |
| Market Cap | ~$275B |
| Current Price | $288.27 |
| 52-Week Range | $214.50 - $324.90 |
| Dividend Yield | 2.14% ($6.72 annual) |
About IBM: Incorporated in 1911, International Business Machines is one of the oldest technology companies in the world. It provides software, IT consulting services, and hardware to help business customers modernize their technology workflows. The company has pivoted aggressively toward AI with its watsonx platform and maintains dominance in enterprise mainframe computing with the z17 series.
🔗 Quick Links
- Stock Chart: IBM on Ainvest
- May $220 Call Options: IBM20260515C220
- October $230 Call Options: IBM20261016C230
Disclaimer: This analysis is for educational purposes only and does not constitute financial advice. Options trading involves significant risk and is not suitable for all investors. The unusual options activity highlighted may reflect hedging, speculation, or other strategies that may not be replicable. Always conduct your own due diligence and consult with a licensed financial advisor before making investment decisions. Past performance does not guarantee future results.
Analysis Date: February 4, 2026