🛡️ IBM $13M Deep ITM Put Buy - Someone Is Hedging Hard After IBM's Worst Day Since 2000!
📅 March 3, 2026 | 🔥 Unusual Activity Detected
🎯 The Quick Take
Someone just dropped $13 MILLION on deep in-the-money IBM $265 puts expiring March 20th, with the stock trading around $241. This is a buy-to-open long put on a stock that's already down 22% YTD after a brutal 13% single-day crash in February -- the worst day for $IBM since 2000. With 17 days to expiration and $23+ of intrinsic value baked in, this looks like an institutional player locking in downside protection on a large stock position heading into a volatile March and Q1 earnings season.
📊 Company Overview
International Business Machines Corporation (IBM) is one of the oldest and most iconic technology companies in the world, providing enterprise software, IT consulting, and hardware:
- Market Cap: $223.7B
- Industry: Computer & Office Equipment (SIC 3570)
- Exchange: NYSE
- Current Price: ~$241 (down ~22% YTD from ~$307 at year-end 2025)
- Employees: 270,300 worldwide across 175 countries
- Primary Business: Enterprise AI (watsonx), Hybrid Cloud (Red Hat), IT Consulting, Mainframes (IBM Z), and Data Platforms
- Key Clients: 95% of all Fortune 500 companies
IBM has been in the headlines recently after Anthropic announced an AI tool capable of COBOL modernization, triggering a 13% single-day crash on February 23 -- the stock's worst session since 2000, erasing over $31B in market value.
💰 The Option Flow Breakdown
The Tape (March 3, 2026 @ 12:20:55):
| Time | Symbol | Side | Buy/Sell | Call/Put | Expiration | Premium | Strike | Volume | OI | Size | Spot | Option Symbol |
|---|---|---|---|---|---|---|---|---|---|---|---|---|
| 12:20:55 | IBM | ASK | BUY | PUT | 2026-03-20 | $13M | $265 | 5K | - | 5,000 | $241.17 | IBM20260320P265 |
🤓 What This Actually Means
This is a buy-to-open (BTO) long put -- a protective or directional bearish position. Let's break it down:
- 💸 Premium paid: $13M ($26.00 per contract x 5,000 contracts)
- 🎯 Deep in-the-money: $265 strike with IBM at ~$241 means the put has ~$24 of intrinsic value already
- ⏰ Time value: Only ~$2 of extrinsic value remaining with 17 days to expiration
- 📊 Position size: 5,000 contracts = 500,000 shares worth ~$120M notional exposure
- 🔥 Vol/OI ratio: 5.0x -- HIGH ACTIVITY signal, this isn't typical market-making noise
What's really happening here:
This trader paid up $13M for puts that are already $24 deep in the money. That's a deliberate choice. By buying deep ITM puts, they're getting near-delta-one protection (each contract moves almost dollar-for-dollar with the stock) while minimizing time decay risk. There are three likely explanations:
- 🛡️ Institutional hedge: A large IBM shareholder protecting ~$120M worth of stock through March OPEX and the Triple Witch expiration on March 20
- 🐻 Directional bearish continuation: Trader expects the post-crash selling isn't over, betting IBM stays below $265 (or falls further) by March 20
- 📉 Post-crash momentum play: After the 22% drawdown, the buyer may see further downside from DOGE contract cancellations, consulting weakness, or tariff headwinds before April earnings
The deep ITM nature and near-term expiry strongly suggest this is a protective hedge on an existing long stock position rather than a naked speculative bet. You don't pay $24 of intrinsic value on a speculative short unless you're protecting something big.
📈 Technical Setup / Chart Check-Up
YTD Performance Chart
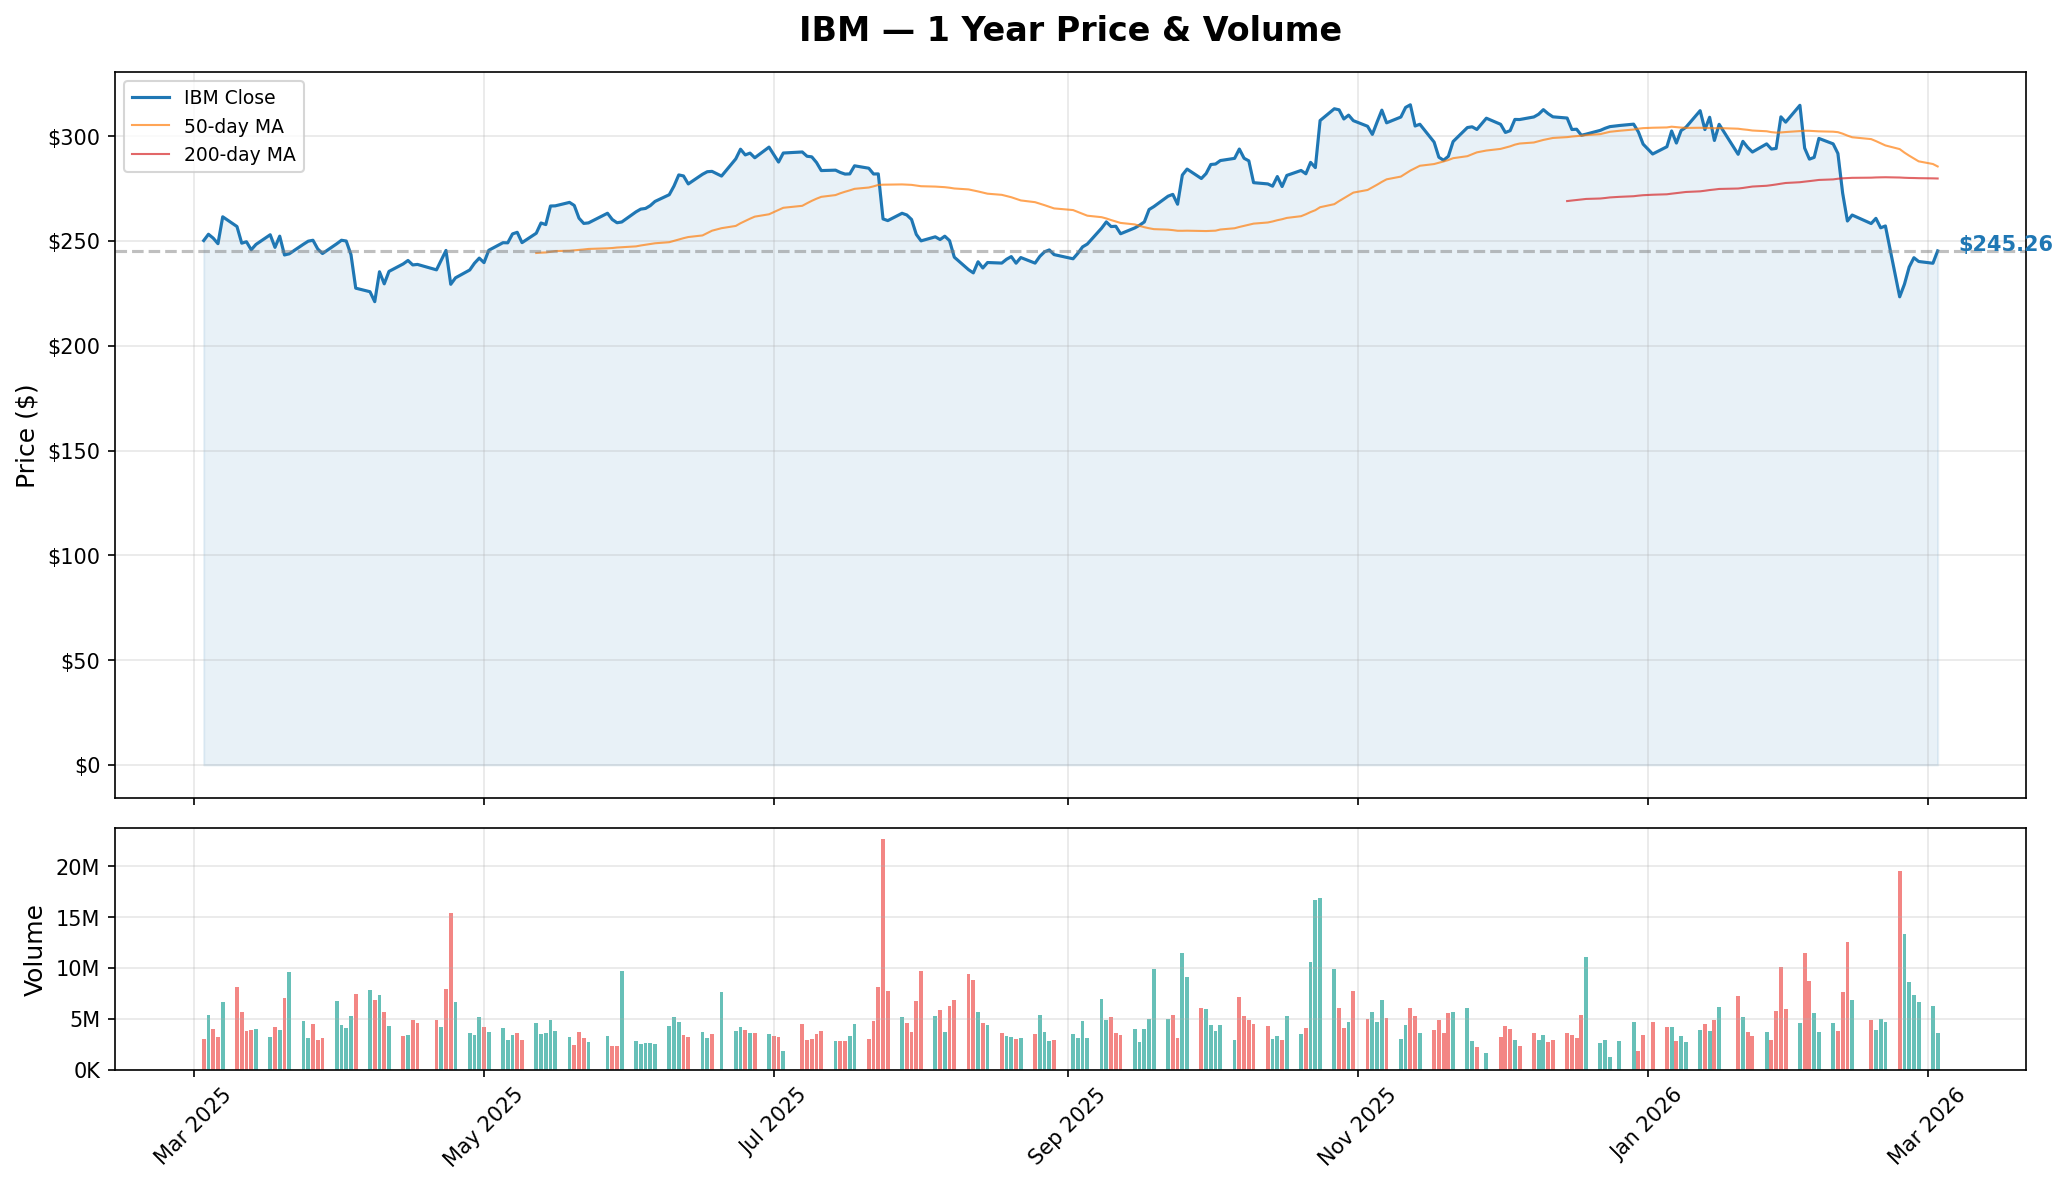
IBM has had a brutal start to 2026, falling from ~$307 at year-end to ~$241 today -- a 22% decline YTD. The chart tells a story of a stock in crisis mode:
- 📉 February 23 crash: IBM dropped 13.2% in a single session after Anthropic announced AI COBOL modernization tools, triggering fears about IBM's consulting revenue moat
- 💹 Hovering near lows: Stock is trading near its 52-week low of $214.50, well below the 52-week high of $324.90
- 🎢 Elevated volatility: The massive gap down on February 23 created a technical void between $241 and $275 that could act as overhead resistance on any bounce
- 📊 $240 support tested: IBM is consolidating around $240, which lines up with the max gamma strike at $250
Implied Move Analysis
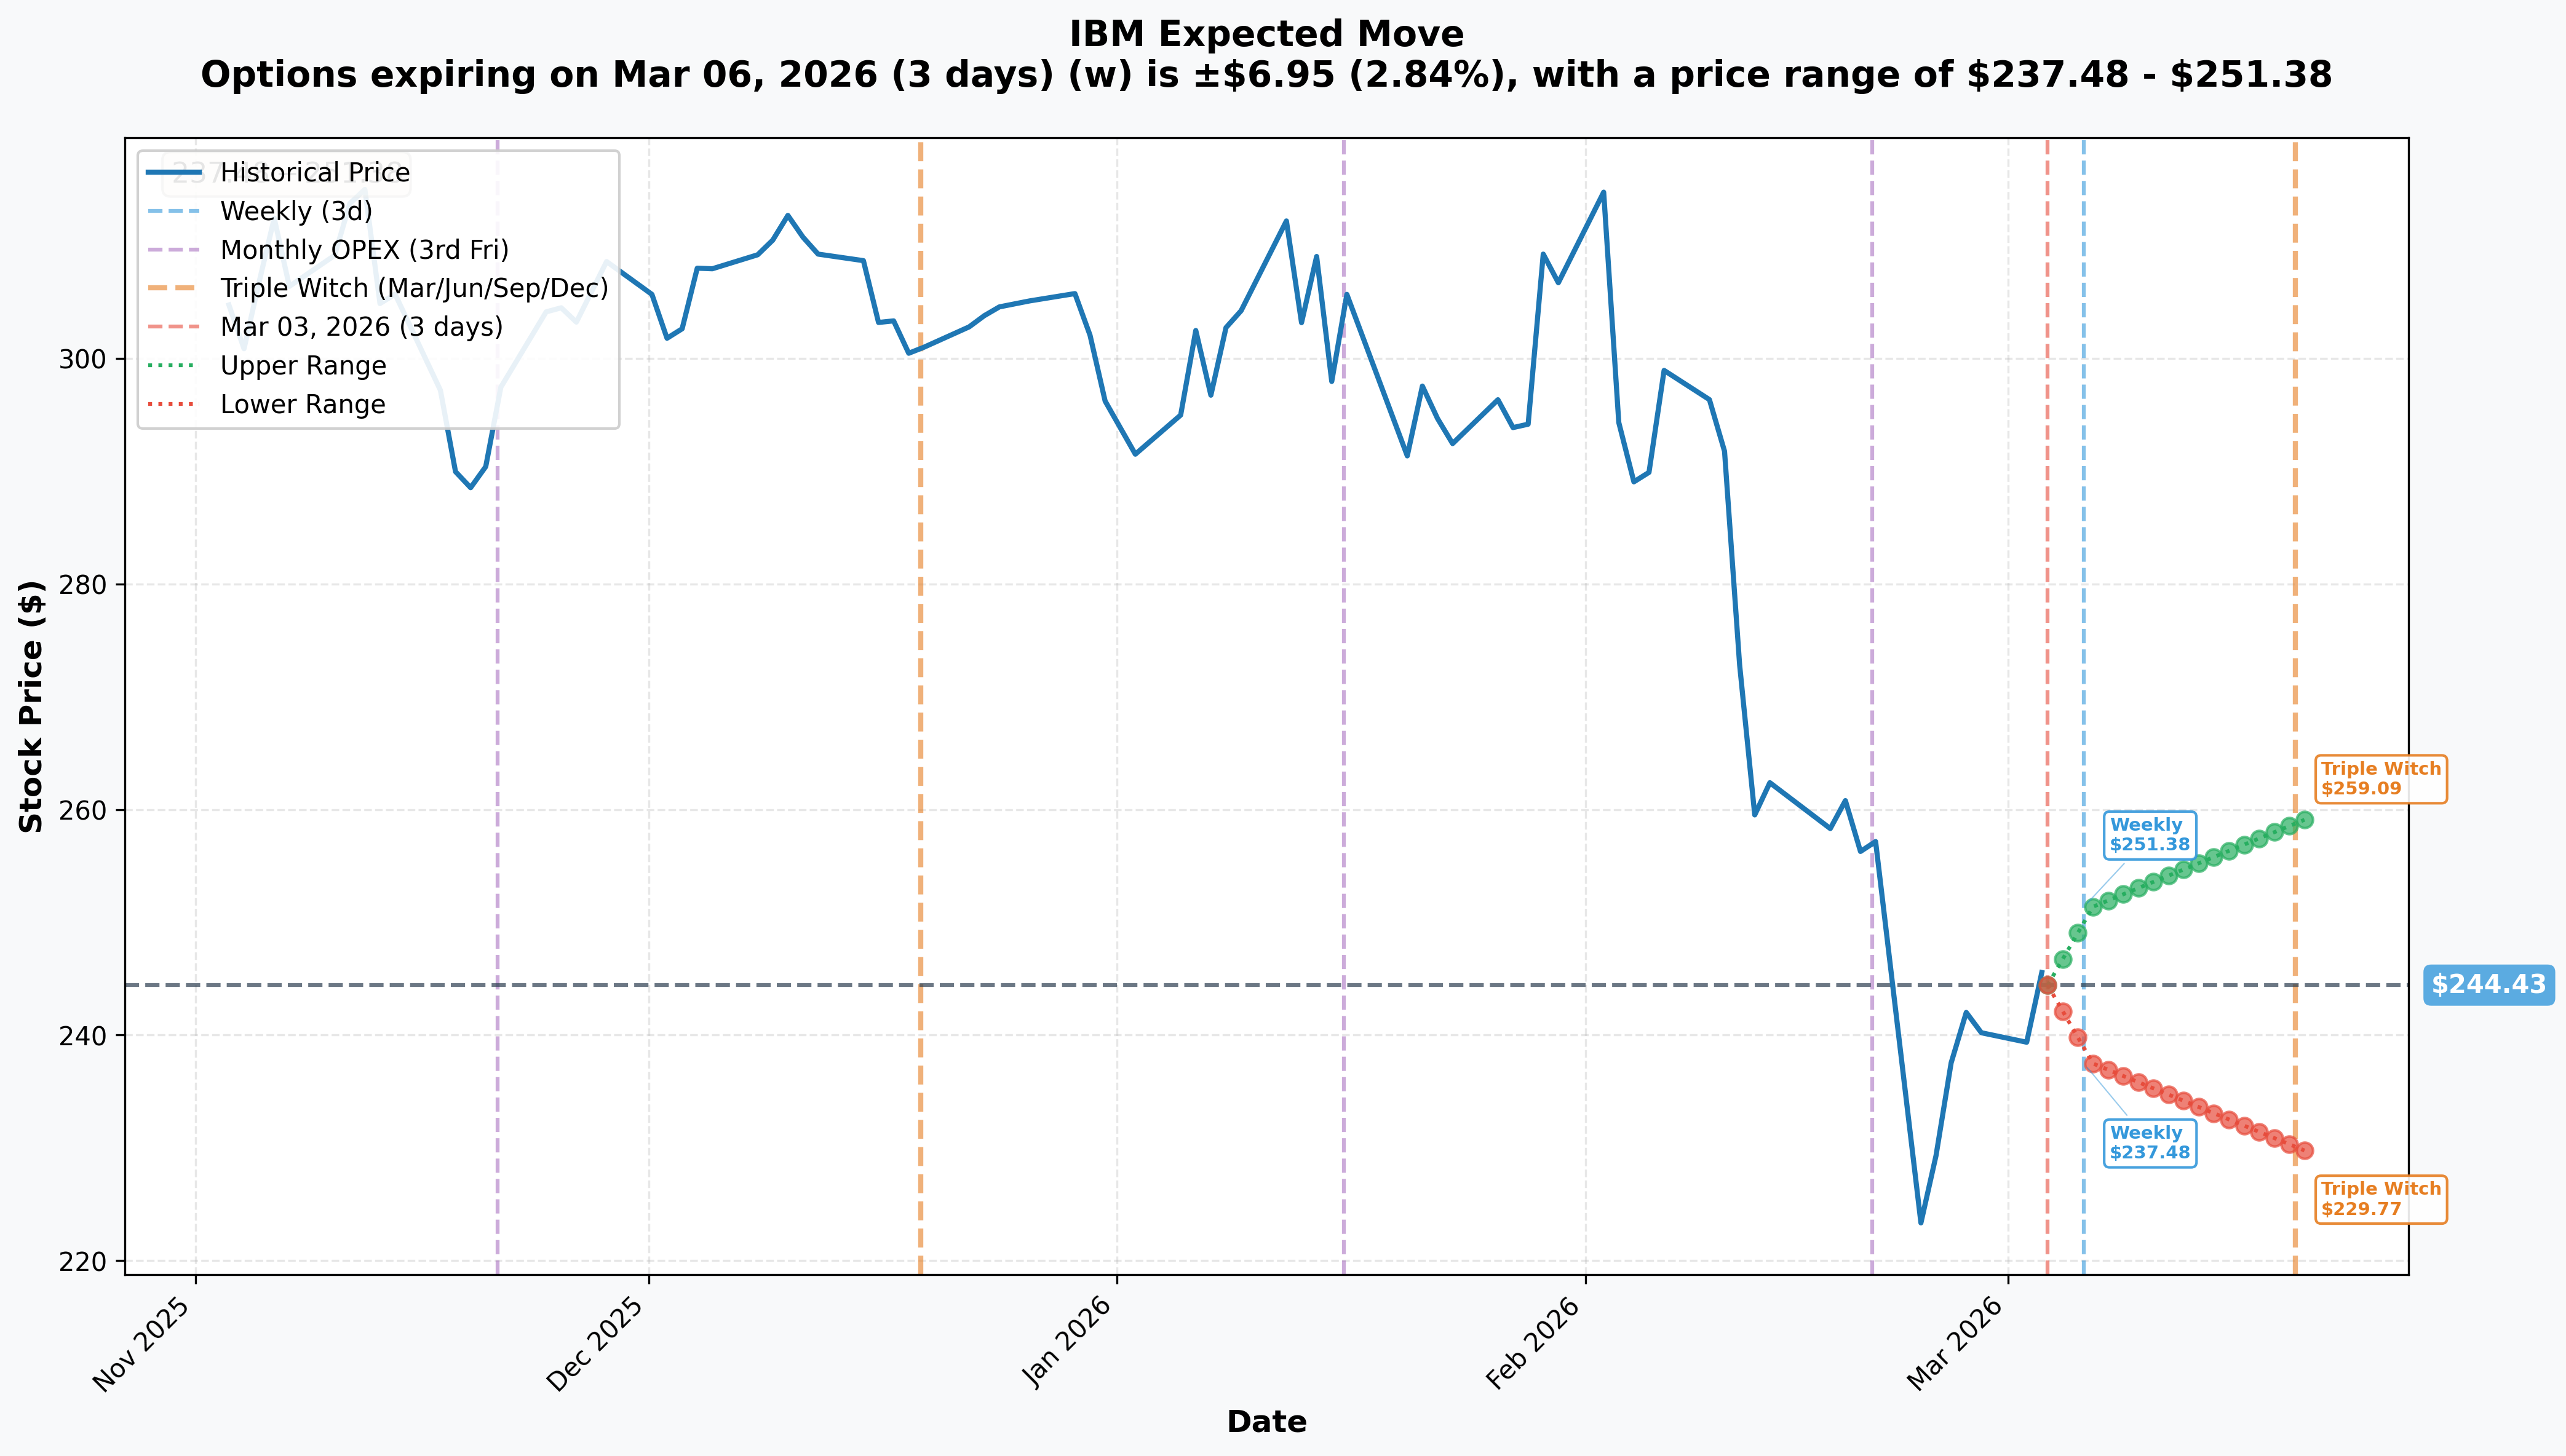
Options market pricing for upcoming expirations:
- 📅 Weekly (Mar 6 - 3 days): +/-$6.95 (+/-2.84%) --> Range: $237.48 - $251.38
- 📅 Monthly OPEX / Triple Witch (Mar 20 - 17 days): +/-$14.66 (+/-6.0%) --> Range: $229.77 - $259.09
Translation for regular folks:
Options traders are pricing in roughly a $7 move by Friday and a $15 move through March OPEX. That 6% implied move for the monthly is elevated for IBM -- this isn't your grandfather's boring blue-chip anymore. The downside range ($229.77) would take IBM to new 52-week lows, while the upside ($259.09) would barely start to fill the February crash gap.
For this specific trade (March 20 expiration), the $265 strike sits above the implied move upper range ($259.09). This means the market doesn't expect IBM to rally back to the put strike by expiration -- the buyer's intrinsic value is essentially locked in unless IBM stages a massive recovery.
Gamma-Based Support & Resistance Analysis
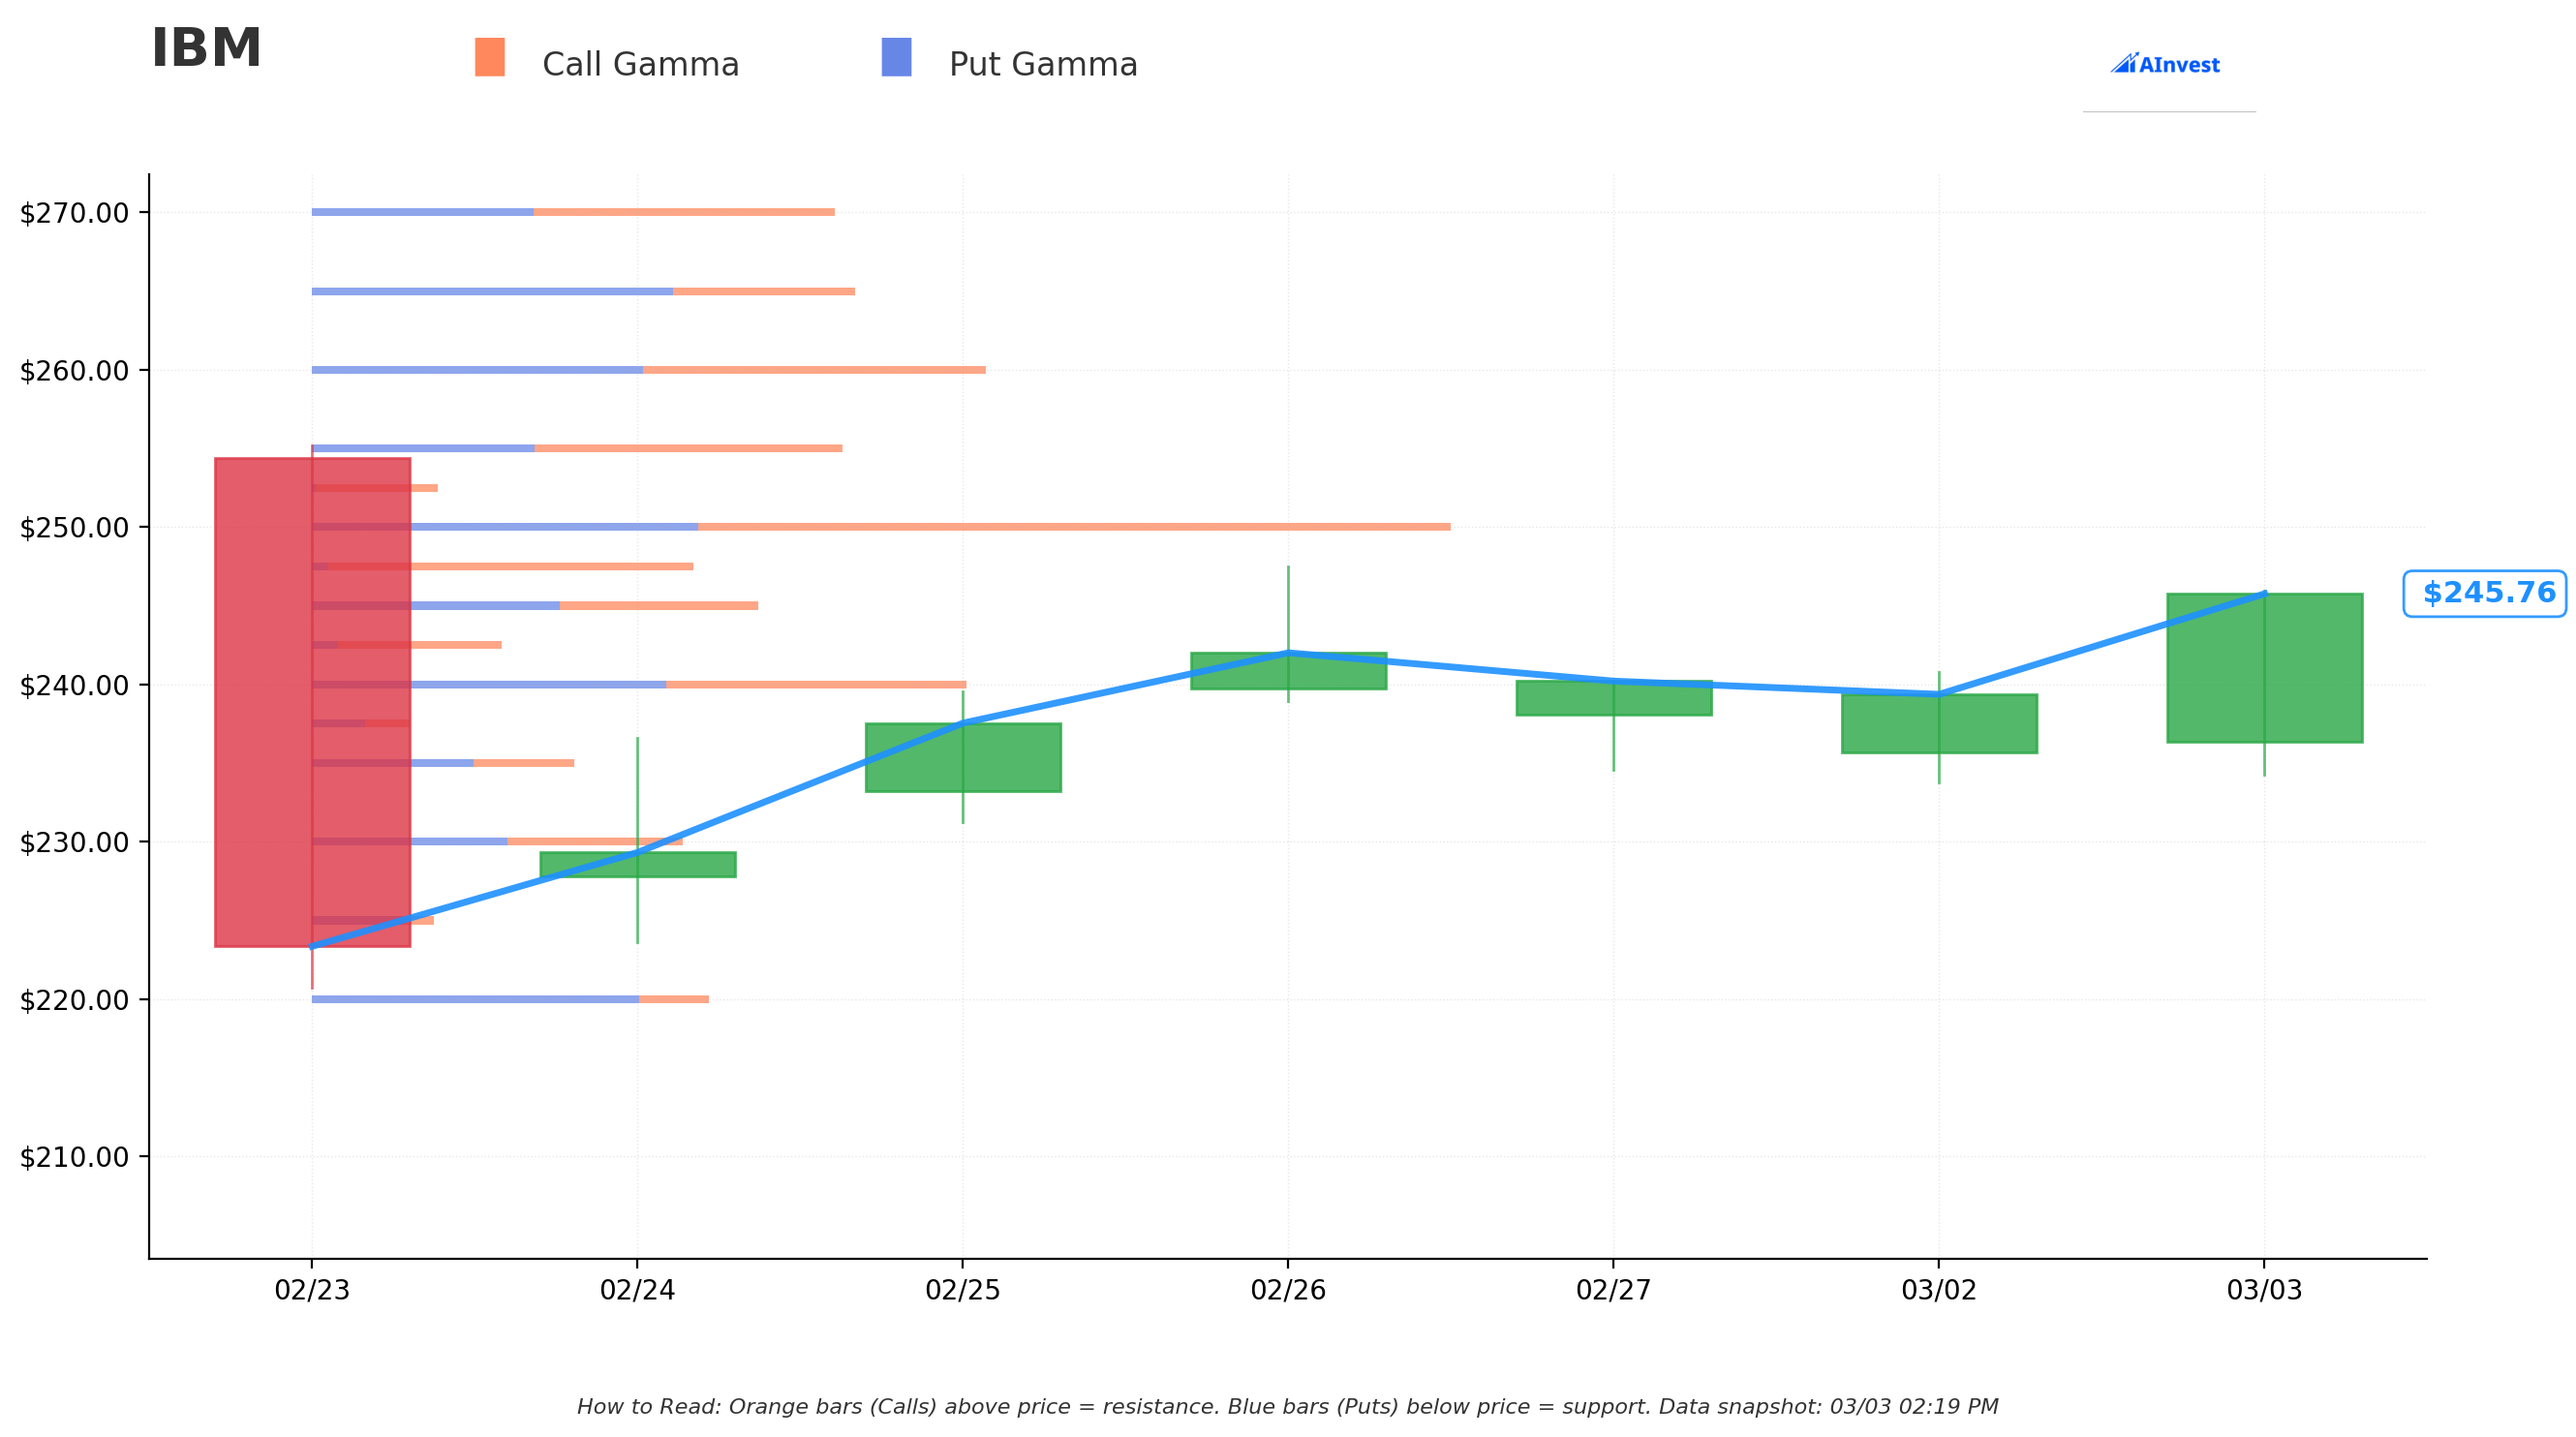
Key Gamma Levels:
The max gamma strike sits at $250, which acts as a gravitational center for price action. Here's how the gamma landscape shapes trading:
🔵 Support Levels:
- $240 - Major gamma level and current price floor; IBM is consolidating here after the crash
- $230 - Implied move lower bound for March OPEX ($229.77); a break below here opens the door to new 52-week lows
- $214.50 - 52-week low and the ultimate line in the sand for bulls
🟠 Resistance Levels:
- $250 - Max gamma strike and key psychological level; expect heavy options hedging activity here
- $259 - Implied move upper bound for March OPEX ($259.09); short-term ceiling
- $265 - The put trade's strike level; also where the February crash gap begins to fill
What this means for traders:
IBM is caught between the $240 support floor and the $250 gamma wall. The max gamma strike at $250 will act like a magnet -- if IBM rallies toward it, dealer hedging flows should intensify, creating resistance. On the downside, a break below $230 (the implied move floor) could trigger a fast move toward the 52-week low at $214.50. The $13M put buyer is positioned perfectly to profit from either continued chop or a further breakdown.
🎪 Catalysts
🔥 Upcoming Catalysts
Q1 2026 Earnings: April 22, 2026 📊
This is the big one. IBM reports Q1 on April 22, and the market will be laser-focused on:
- 📊 Consensus: $15.58B revenue, $1.80 EPS
- 🤖 Can the GenAI book of business sustain the $3B/quarter booking pace?
- 💼 Consulting signings post-COBOL scare -- are clients getting cold feet?
- 🏛️ Federal contract updates after 15 DOGE cancellations
IBM Think 2026: May 4-7, 2026 (Boston) 🤖
IBM's flagship annual conference is the company's chance to reset the AI narrative. Expect major watsonx product announcements, customer case studies, and potentially Confluent integration details. This could be a significant positive catalyst if IBM demonstrates that consulting + AI is additive, not cannibalistic.
Confluent Acquisition Close: Mid-2026 💰
The $11B Confluent deal has cleared all major hurdles -- HSR antitrust clearance and shareholder approval are done. Upon close, this adds ~$1.5B annual revenue to the Software segment and positions IBM's "Smart Data Platform" for enterprise GenAI.
March 20 - Triple Witch OPEX 📅
Major options expiration could create elevated volatility and large hedging flows. The implied move prices a $230-$259 range through this date -- and that's exactly when this $13M put trade expires.
Dividend Ex-Date: ~May 2026 (Q2) 💵
IBM pays $1.68/quarter ($6.72 annual) for a 2.83% yield at current prices. That's solid income while you wait, and the ~52% FCF payout ratio means the dividend is well-covered.
⏪ Recent Catalysts (Already Happened)
The February 23 COBOL Crash (-13.2%) 💥
IBM suffered its worst single-day decline since 2000 after Anthropic announced AI tools for COBOL modernization. The selloff wiped over $31B in market cap. However, multiple analysts have pushed back: The Motley Fool argued the threat is overblown, and VentureBeat called the selloff "built on a misconception" since code translation is just one piece of the modernization puzzle.
Q4 2025 Earnings Beat (January 28, 2026) 📈
IBM crushed Q4 expectations with $19.7B revenue (+9% YoY) vs. $19.22B consensus and $4.52 EPS vs. $4.29 consensus. Free cash flow hit a decade high of $14.7B. The GenAI book of business exceeded $12.5B cumulative with $3B added in Q4 alone.
Analyst Activity Post-Crash:
| Date | Firm | Action | Target |
|---|---|---|---|
| Feb 18 | Erste Group | Downgrade to Hold | N/A |
| Feb 25 | UBS | Upgrade to Neutral (from Sell) | $236 |
| Feb 25 | Morgan Stanley | Maintained Equal Weight | $247 (from $304) |
| Feb 25 | Wedbush | Reiterated Outperform | $340 |
Analyst consensus: 11 Buy, 7 Hold, 3 Sell with an average price target of ~$320 -- implying 33% upside from current levels.
🎲 Price Targets & Probabilities
Using implied move data, gamma levels, and catalyst timing:
📈 Bull Case (20% probability)
Target: $260-$280
How we get there:
- 🤖 Market accepts that the COBOL AI fear was overblown and starts filling the February crash gap
- 📊 Q1 earnings on April 22 show consulting bookings holding steady, proving client relationships are stickier than feared
- 💰 GenAI book of business adds another $3B+, validating the enterprise AI growth story
- 🤝 Confluent acquisition closes on schedule, boosting Software segment growth toward the 10% target
- 📈 Stock breaks above $250 gamma wall, triggering short covering and dealer hedging flows into the $259 implied move ceiling and beyond
- 🎯 Wedbush's $340 target and the ~$320 analyst consensus start pulling price higher
Impact on the trade: The put buyer would see intrinsic value shrink significantly. If IBM rallies above $265, the put expires worthless and they lose the entire $13M premium. But if this is a hedge on a long stock position, the stock gains more than offset the put loss.
🎯 Base Case (55% probability)
Target: $230-$255 range-bound
Most likely scenario:
- ✅ IBM consolidates in the $230-$250 zone as the market digests the February crash and waits for Q1 earnings
- 📊 No major catalyst before April 22 earnings to drive a directional breakout
- ⚖️ DOGE-related contract cancellations and 15% global tariffs keep sentiment cautious
- 🎢 Volatility stays elevated around the $250 max gamma strike and Triple Witch OPEX on March 20
- 💵 The 2.83% dividend yield provides a floor and attracts income-focused buyers
This is the sweet spot for the put buyer: IBM stays well below $265, the put retains most of its intrinsic value, and the hedge does its job. If the stock drops toward $230, the put gains an additional $10+ per contract.
📉 Bear Case (25% probability)
Target: $210-$230
What could go wrong:
- 😰 Pre-earnings whispers suggest consulting bookings are falling as clients pause modernization projects
- 📉 Morgan Stanley's $247 target becomes the ceiling as more analysts cut estimates
- 🏛️ Additional DOGE contract cancellations surface -- federal is ~10% of consulting revenue
- ⚖️ 15% global tariffs cause enterprise clients to defer IT spending, pressuring consulting and infrastructure segments
- 💥 Break below $230 (implied move support) opens the floodgates toward the 52-week low at $214.50
- 🤖 z17 mainframe cycle deceleration accelerates, and Infrastructure revenue drops faster than guided
Impact on the trade: This is where the put buyer profits big. If IBM drops to $220, the $265 put has $45 of intrinsic value -- the buyer nearly doubles their money. Even at $230, the put is worth $35, a $9 gain per contract ($4.5M profit on the position).
💡 Trading Ideas
🛡️ Conservative: The "Sleep Well with Income" Covered Put Write
Play: If you're neutral-to-bullish on IBM, sell cash-secured March 20 $230 puts to collect premium at the implied move floor
Why this works:
- 💰 $230 strike sits at the implied move lower bound -- the market says there's roughly an 84% chance IBM stays above this level
- 📊 IBM's $14.7B free cash flow and 2.83% dividend yield make it a stock worth owning at $230
- 🛡️ If assigned, your effective cost basis drops to ~$226-228 after premium collected
- ⏰ 17 days of theta decay working in your favor through Triple Witch
Estimated P&L:
- 💰 Collect ~$2-3 per contract (~1% yield in 17 days)
- 📈 Max profit if IBM stays above $230: keep the full premium
- 📉 Breakeven: ~$227 (below the 52-week low of $214.50 you'd need further downside)
Risk level: Low-moderate (must be willing to own IBM at $227) | Skill level: Beginner-friendly
⚖️ Balanced: The "Recovery Bet" Bull Put Spread
Play: Sell a put spread below current price to collect premium while defining your risk
Structure: Sell April $235 puts / Buy April $225 puts
Why this works:
- 🎯 $235 support sits above the implied move floor, and a 22% selloff likely has the worst behind it near-term
- 📊 11 analysts have Buy ratings with a $320 average target -- the consensus says IBM is deeply oversold
- ⏰ 45 days of time decay before April earnings, expires before the April 22 report
- 💰 Collect ~$2.50-3.50 per spread (~25-35% of width)
- 🛡️ Max loss defined at $10 per spread minus premium collected
Estimated P&L:
- 💰 Max profit: ~$250-350 per spread if IBM stays above $235
- 📉 Max loss: ~$650-750 per spread if IBM below $225 at expiration
- 🎯 Breakeven: ~$232 (near the implied move lower bound)
Risk level: Moderate (defined risk) | Skill level: Intermediate
🚀 Aggressive: The "Crash Gap Fill" Call Diagonal
Play: Bet on IBM recovering toward the February crash gap with a time-spread structure
Structure: Buy June $245 calls / Sell April $260 calls
Why this works:
- 📈 Analyst consensus of ~$320 implies massive upside from $241 -- but you need a catalyst
- 🤝 IBM Think 2026 (May 4-7) and the Confluent close are catalysts that could spark a narrative reset
- 💰 Short April call defrays cost of long June call, reducing breakeven
- 📊 The February crash gap between $241 and $275 is a technical magnet -- gap fills happen more often than not
- 🤖 IBM's GenAI story ($12.5B cumulative bookings) hasn't changed -- only the fear narrative has
Why this could go wrong:
- 💥 If IBM drops below $230 and stays there, the long call loses value fast
- 📉 If April earnings disappoint, both legs could get crushed by IV collapse
- ⚠️ If COBOL AI fears prove well-founded, the consulting business could face structural decline
Estimated P&L:
- 💰 Net debit: ~$5-7 per spread
- 📈 Max upside after April expiration: significant if IBM recovers toward $260-$275 by June
- 📉 Max loss: Net premium paid (~$500-700 per spread) if IBM collapses below $230
- 🎯 Sweet spot: IBM at $255-$260 at April expiration, then rallies into Think 2026
Risk level: High (directional recovery bet) | Skill level: Advanced
⚠️ Risk Factors
Don't get caught off guard by these potential landmines:
-
🤖 AI disruption of consulting is structural, not cyclical: The COBOL modernization threat from AI coding tools may not just be headline noise. If enterprises can use AI to automate 30-50% of legacy modernization tasks, IBM Consulting's most profitable service line faces margin compression over the next 2-3 years. Even IBM's own watsonx Code Assistant offers COBOL modernization, which cannibalizes its own consulting revenue.
-
🏛️ DOGE federal contract cuts are ongoing: IBM has already seen 15 federal contracts canceled worth ~$100M. Federal revenue is ~5% of IBM total and ~10% of Consulting. With the FY2026 defense budget still in flux, more cancellations could surface in the Q1 earnings call.
-
⚖️ 15% global tariffs squeeze margins: The reintroduction of global tariffs adds cost pressure on hardware (Infrastructure segment) and could cause enterprise clients to defer IT spending. IBM's consulting contracts often have fixed pricing, limiting the ability to pass costs through.
-
📉 z17 mainframe cycle is peaking: IBM guided Infrastructure revenue down low-single digits for FY2026 as the z17 cycle, launched June 2025, begins decelerating. Mainframe cycles historically peak in year one, and the Infrastructure segment's +21% Q4 growth is unlikely to repeat.
-
💸 $11B Confluent deal adds execution risk: The acquisition must deliver on the "Smart Data Platform" promise. Integration missteps could drag on Software margins and distract management during a critical period.
-
📊 Analyst targets may be stale: The ~$320 consensus target was set before the COBOL crash. Several firms have already slashed targets (Morgan Stanley from $304 to $247), and more downgrades could follow if Q1 consulting numbers disappoint.
-
💰 Interest rate pressure on acquisition debt: Higher-for-longer rates increase financing costs on IBM's acquisition spree (HashiCorp $6.4B + Confluent $11B), compressing free cash flow that's earmarked for debt service and the $6.72 annual dividend.
🎯 The Bottom Line
Real talk: A sophisticated player just spent $13M on deep ITM puts to protect against further IBM downside -- and frankly, you can understand the caution. IBM is sitting in the wreckage of a 22% YTD decline, driven by legitimate fears that AI could disrupt its consulting cash cow. The stock that once was the "safe" blue-chip tech play is now in crisis-mode pricing.
What this trade tells us:
- 🛡️ Institutional money is hedging, not running for the exits (buying ITM puts = protection, not speculation)
- 📊 The $265 strike locks in a guaranteed $24+ per contract of intrinsic value -- this is insurance, not a gamble
- ⏰ The March 20 expiry covers Triple Witch OPEX, a period of heightened volatility and hedging activity
- 💰 5,000 contracts on 500,000 shares worth ~$120M notional -- this is a large position holder taking precautions
If you own IBM:
- ✅ The Q4 fundamentals were strong -- $19.7B revenue, $14.7B FCF, $12.5B GenAI backlog. The business hasn't changed, just the narrative.
- 🛡️ Consider adding protection or selling covered calls in the $250-$260 range to generate income during this chop
- 💵 The 2.83% dividend yield provides a cushion while you wait for the recovery
- ⏰ Key dates: March 20 (Triple Witch OPEX), April 22 (Q1 earnings), May 4-7 (Think 2026)
If you're watching from the sidelines:
- 🎯 A pullback to $230 (implied move support) or $215 (52-week low) would be an attractive entry with the ~$320 analyst consensus target implying 33-50% upside
- 📊 Wait for Q1 earnings on April 22 for clarity on consulting bookings and DOGE impact
- 💡 IBM at 16x forward earnings vs. 22x sector average -- if the COBOL fear proves overblown, this is a value trap turning into a value play
If you're bearish:
- 📉 The AI disruption narrative has legs, and ~10% of consulting revenue exposed to DOGE cuts adds to the pressure
- 🎯 Bear put spreads ($240/$230 or $235/$225) offer defined-risk downside plays with 17-45 day expirations
- ⏰ The February crash gap ($241-$275) overhead means rallies will be sold -- wait for a bounce toward $250 before pressing the short side
Mark your calendar -- Key dates:
- 📅 March 6 (Friday) - Weekly options expiration (implied range: $237-$251)
- 📅 March 20 - Triple Witch OPEX (implied range: $230-$259) -- this $13M put trade expires
- 📅 April 22 - Q1 2026 earnings report
- 📅 May 4-7 - IBM Think 2026 (Boston)
- 📅 Mid-2026 - Confluent acquisition expected to close
Final verdict: This $13M put buy is classic institutional risk management -- a large holder paying for downside insurance during one of the most volatile periods in IBM's modern history. The COBOL AI scare may or may not prove to be a real long-term threat, but the market clearly isn't done debating it. With the stock down 22% YTD, a $320 analyst consensus target, and major catalysts (earnings, Think 2026, Confluent) on the horizon, IBM is at an inflection point. The next 7 weeks will tell us if this is a generational buying opportunity or the start of a structural decline. Follow the smart money's lead: protect your downside first, then worry about catching the upside.
Disclaimer: Options trading involves substantial risk of loss and is not suitable for all investors. This analysis is for educational purposes only and not financial advice. Past performance doesn't guarantee future results. The Vol/OI ratio of 5.0x reflects this specific trade's unusualness relative to recent activity -- it does not imply the trade will be profitable or that you should follow it. Always do your own research and consider consulting a licensed financial advisor before trading.
About International Business Machines Corporation: IBM is one of the world's oldest technology companies with a $223.7B market cap, providing enterprise AI (watsonx), hybrid cloud (Red Hat), IT consulting, and mainframe (IBM Z) solutions to 95% of Fortune 500 companies across 175 countries.