🐋 IGV Risk Reversal Unwind: Institutional Player Closes $2.9M Bullish Bet on Software!
📅 2026-03-04 | 🔥 Unusual Activity Detected
🎯 The Quick Take
Someone just unwound a $2.9M risk reversal on IGV, the iShares Expanded Tech-Software Sector ETF, closing both a short $60 put and a long $110 call in a single clip at 12:08 PM. That is 4,964 contracts on each side -- controlling nearly 500,000 shares of software exposure -- exiting a bullish position they had been sitting in for months. When institutional money this size steps away from a directional bet on a sector that is down 29% from its highs, you pay attention. 👀
💰 The Option Flow Breakdown
📊 The Tape
| Time | Symbol | Side | Buy/Sell | C/P | Strike | Expiration | Volume | OI | Size | Premium | Spot | Option Price |
|---|---|---|---|---|---|---|---|---|---|---|---|---|
| 12:08:23 | IGV | MID | SELL | PUT | $60 | 2026-12-18 | 5K | 6.8K | 4,964 | $1.2M | $85.52 | $2.32 |
| 12:08:23 | IGV | MID | BUY | CALL | $110 | 2026-12-18 | 5K | 5.5K | 4,964 | $1.7M | $85.52 | $3.35 |
🤓 What This Actually Means
Let me break this down in plain English. This is a risk reversal unwind -- two trades happening at the exact same second, working as a pair.
The original position (which they are now closing): 🟢 They had sold the December 2026 $60 puts (collecting premium, agreeing to buy IGV at $60 if it crashed) 🟢 They had bought the December 2026 $110 calls (betting IGV could rally to $110+ by year-end)
That combination is called a risk reversal -- it is a classic institutional way to say "I'm bullish." You fund your upside call by selling a downside put. It is leveraged conviction.
What they did today: 🔴 Bought back the $60 puts they were short (cost: $1.2M) 🔴 Sold out of the $110 calls they were long (received: $1.7M)
The math: 💵 Net credit on the close: ~$500K (they collected more from selling the calls than they paid to buy back the puts) 💵 Total premium moved: $2.9M across both legs 📊 Z-Score: 2.0-2.33x (classified as HIGHLY UNUSUAL on both legs) 📊 Volume-to-OI ratio: 73.5% on the puts, 90.9% on the calls -- massive activity relative to existing positions
🔍 Why Are They Closing?
This is the key question. Here are the likely scenarios:
1. Profit-taking on a bounce 📈 -- IGV rallied from its February 5 low of $76.26 to $85.52 today. The $60 puts they sold are now deeply out of the money (30% below spot), so they've captured most of the premium decay. They may be saying: "Good enough, let's book it."
2. Conviction downgrade 🤔 -- The $110 call strike is 29% above the current price. With all major moving averages still above IGV and the AI disruption selloff fresh in everyone's minds, reaching $110 by December may now feel like a stretch. Unwinding the call side signals they are no longer betting on a full recovery.
3. Risk management ahead of catalysts 🛡️ -- Oracle earnings March 10, Adobe earnings March 12, and NVIDIA GTC March 16-19 all hit within the next two weeks. That is ~12% of IGV's weight reporting in a single week. This trader may prefer to reassess after the dust settles.
4. Capital redeployment 💼 -- Freeing up margin and capital to put on a different trade. The $500K net credit plus released margin is now available for the next opportunity.
📈 Technical Setup / Chart Check-Up
YTD Price Action
IGV has been through the wringer this year. Down ~15% YTD, currently sitting at $85.52 after bouncing from the February 5 low of $76.26. The ETF is trading below its 50-day and 200-day moving averages, which is a bearish technical setup. But the bounce off $76 has been encouraging -- about a 12% snapback in under a month.
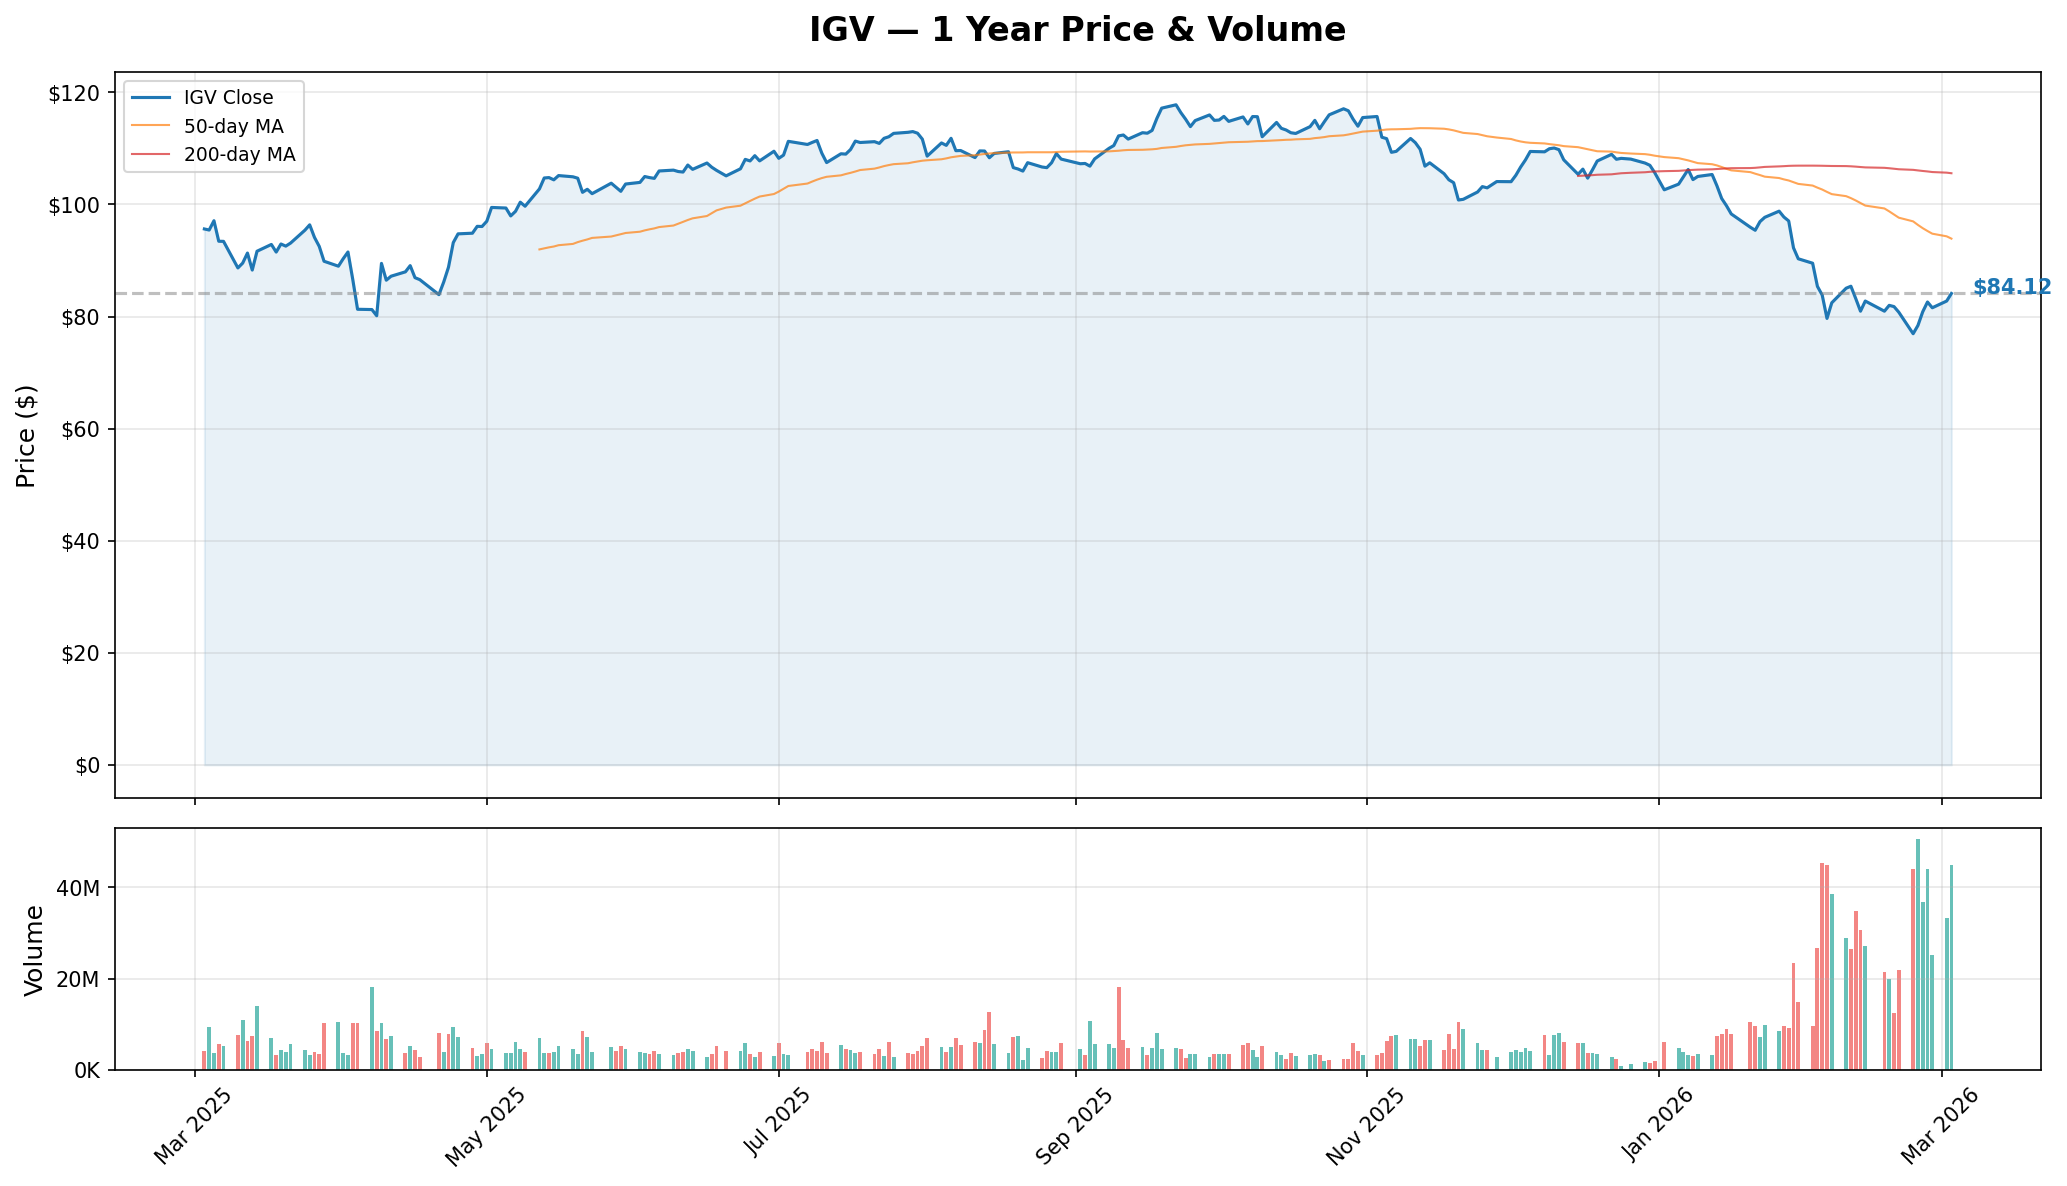
The volume bars tell an interesting story too. Notice the massive spike in trading volume during the February selloff -- that was panic selling. The elevated volume persisting into March suggests active repositioning, not just a dead cat bounce.
Key levels from Intellectia AI's technical analysis: 📍 Immediate resistance: $86.85 -- first level to reclaim for bulls 📍 Broken support (now resistance): $80.22 / $79.50 📍 52-week low: $76.26 -- the critical floor 📍 Downside target if $76 breaks: $70.73 (Fibonacci level)
📊 Gamma-Based Support & Resistance
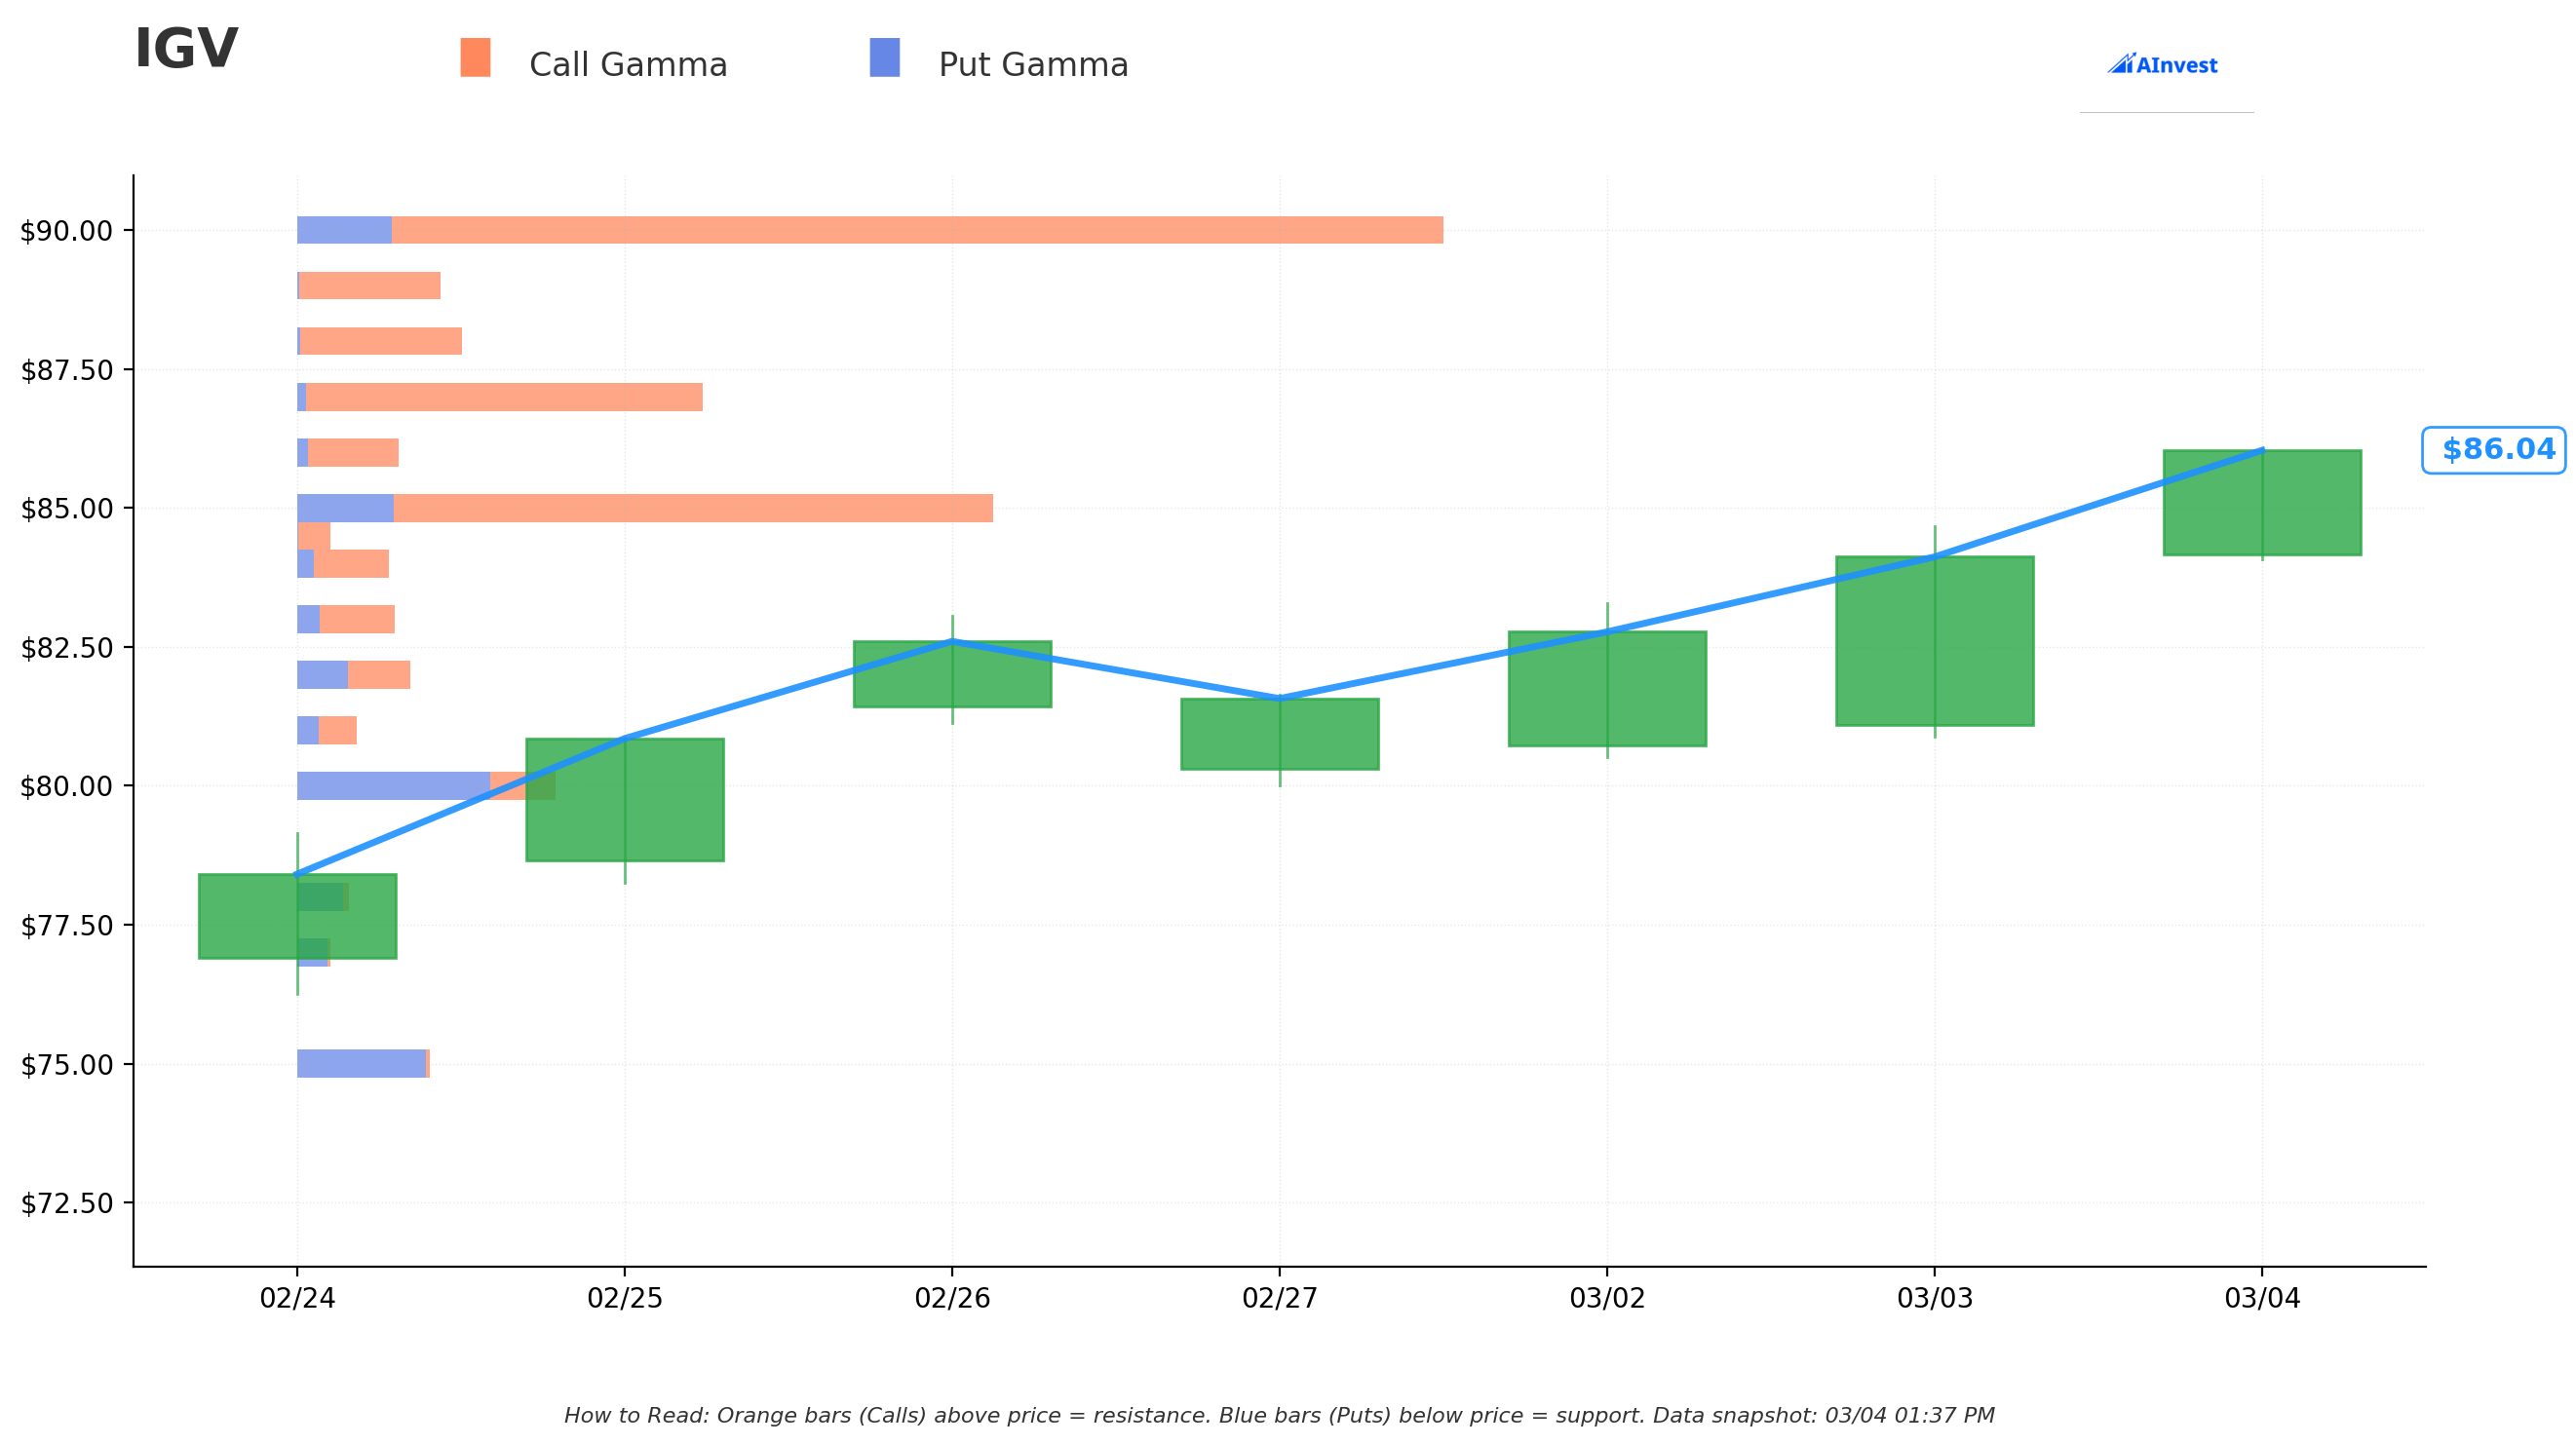
How to read this chart: 🟠 Orange bars (Call Gamma) above the price represent resistance levels where options dealers would need to sell into rallies. 🔵 Blue bars (Put Gamma) below the price represent support levels where dealers would need to buy dips. Bigger bars = stronger levels.
The gamma picture tells us: 🟠 $90 is the big resistance wall -- the largest call gamma bar on the chart sits right at $90. If IGV pushes toward $90, expect heavy dealer hedging to slow the rally. This aligns with the March OPEX implied upper range of $90.42. 🟠 $87.50 and $88 are intermediate resistance -- call gamma stacks up here too, creating a speed bump on the way to $90. 🔵 $85 has mixed gamma -- both put and call gamma converge near the current price, which can create a "sticky" zone. Price tends to chop around high-gamma areas. 🔵 $80 is the put gamma support floor -- significant put-side open interest at $80 would push dealers to buy the dip if IGV pulls back to that level. 🔵 $75 shows put gamma as the last line of defense -- below here, it gets thin.
📊 Implied Move & Expected Range
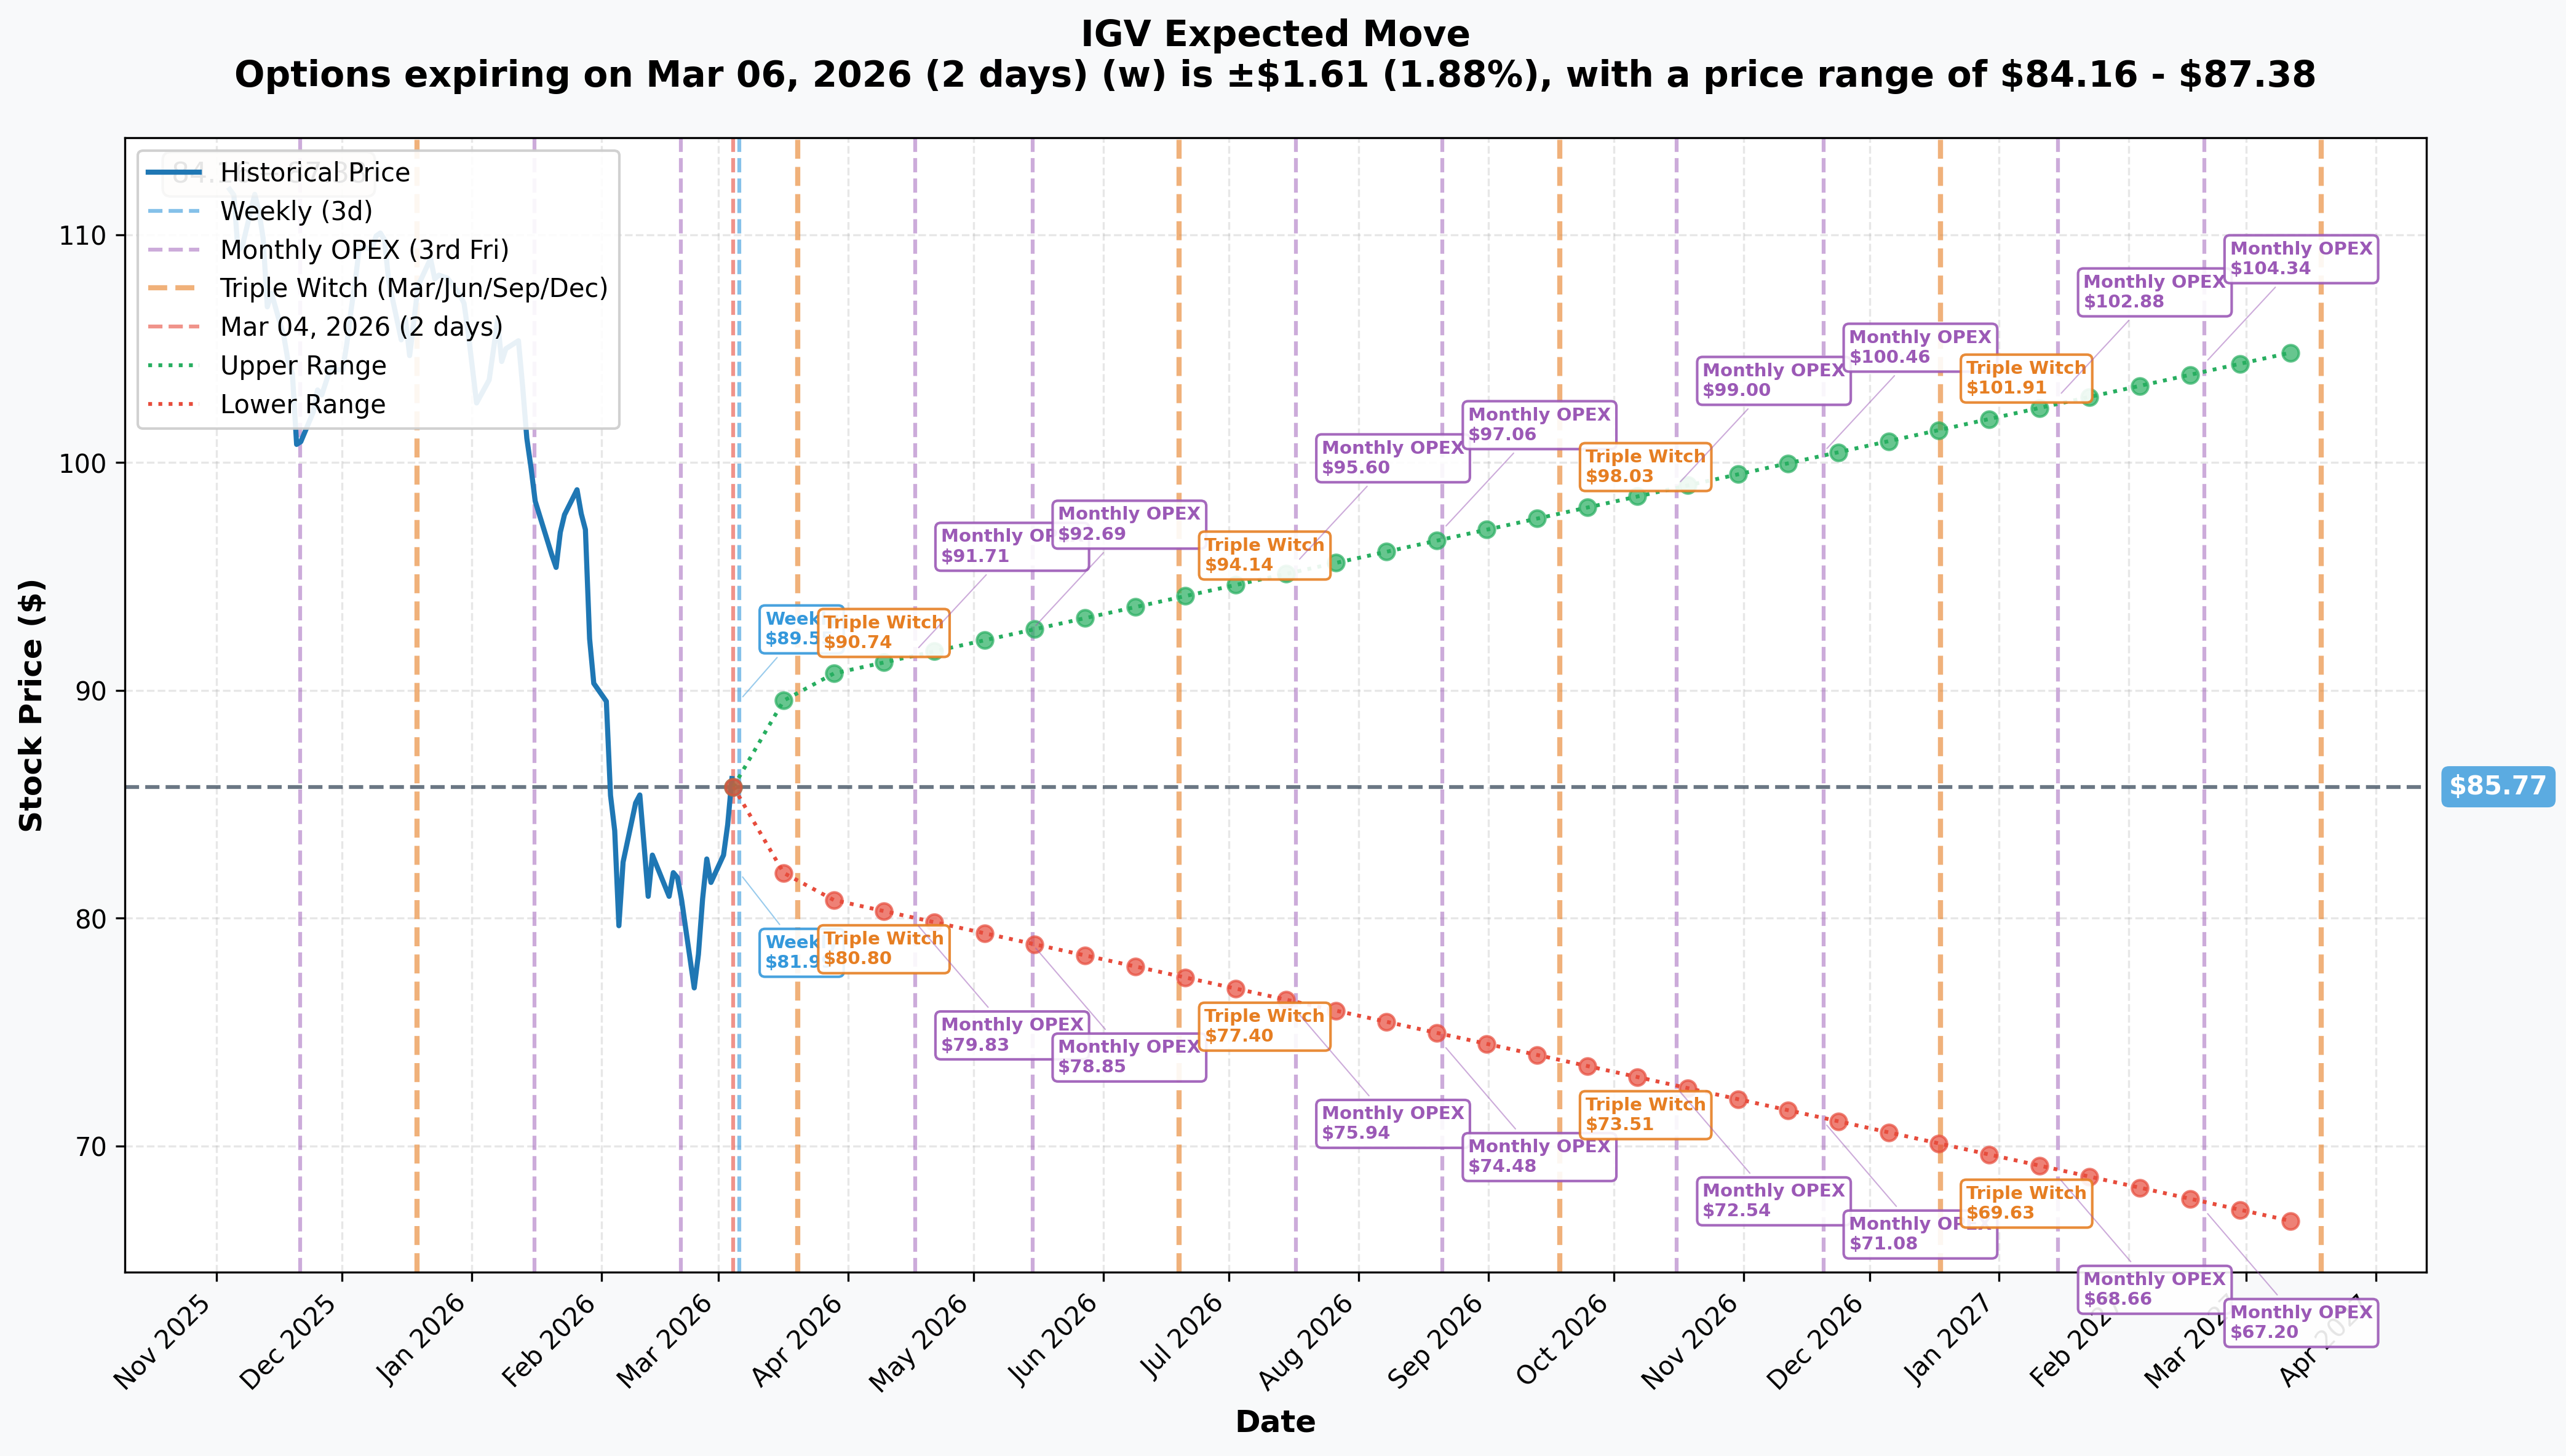
The options market is pricing in substantial movement for IGV across every timeframe:
📅 Weekly (March 6): +/- 1.88% ($84.16 - $87.38) 📅 March OPEX / Triple Witch (March 20): +/- 5.4% ($81.12 - $90.42) 📅 December 2026 Triple Witch (December 18): Range of $69.63 - $101.91 -- that is the exact expiration date of the risk reversal being unwound 📅 LEAPS (March 2027): +/- 22.6% ($66.39 - $105.15)
Notice something important here. The December 2026 implied range tops out at $101.91 -- which is well below the $110 call strike that was being closed. The options market itself is saying $110 by December is a low-probability outcome. That adds context to why this trader decided to close their long $110 calls.
Meanwhile, the $60 put strike they closed sits below even the LEAPS lower range of $66.39. That put was always deep cushion -- but the premium collected on it was essentially "free money" at this point.
🎪 Catalysts
📅 What Already Happened (Past 4 Weeks)
✅ February 3 -- AI Disruption Selloff: Anthropic launched legal AI tools, triggering the worst non-recessionary software drawdown in 30 years. IGV dropped to $76.26 on February 5. This was the defining event -- a $2 trillion software market cap wipeout.
✅ February 17 -- Palo Alto Networks (PANW) earnings: Revenue $2.6B (+15% YoY), EPS beat by 35.5%. Cybersecurity held up as more defensible against AI disruption.
✅ February 20 -- Supreme Court tariff ruling: SCOTUS struck down reciprocal tariffs, but Trump immediately imposed a new 10% global tariff. Software companies are largely exempt since SaaS is intangible, but macro uncertainty lingers.
✅ February 24-25 -- Earnings cluster: Workday beat ($2.47 vs $2.32 EPS), Salesforce crushed it ($3.81 vs $3.04 EPS, fastest revenue growth in 2 years), Snowflake posted +30% product revenue growth. Fundamentals are solid despite the selloff.
✅ March 3 -- CrowdStrike (CRWD) earnings: Revenue $1.31B (+23% YoY), net new ARR surged 47%. Another beat from a major IGV holding.
📅 What is Coming (Next 2-3 Months)
🔜 March 10 -- Oracle (ORCL) Q3 FY2026 earnings (7.53% of IGV): Guided for 19-21% revenue growth with cloud revenue at +34% last quarter. This is the next big swing factor.
🔜 March 12 -- Adobe (ADBE) Q1 FY2026 earnings (4.52% of IGV): Consensus EPS $5.87 with an implied earnings move of +/- 7.7%. AI monetization through Firefly is the narrative.
🔜 March 16-19 -- NVIDIA GTC 2026 (San Jose): Jensen Huang keynote on March 16. Agentic AI frameworks and enterprise AI partnerships could move the entire software complex.
🔜 Late April -- Microsoft (MSFT) Q3 FY2026 earnings (9.37% of IGV, largest holding): Focus on Azure AI trajectory and Copilot adoption. MSFT has a $600B+ RPO backlog but the stock is down 16% YTD.
🔜 Mid-May -- Palantir (PLTR) Q1 2026 earnings (8.70% of IGV, 2nd largest): Trading at 232x P/E. Any guidance miss at this valuation could move IGV materially.
🔜 May 19-20 -- Google I/O 2026: AI-centric event with potential software sector implications.
🎲 Price Targets & Probabilities
Combining the gamma structure, implied move ranges, and catalyst calendar, here is how the scenarios stack up:
🐻 Bear Case: $76 - $80
Probability: ~25%
If Oracle or Adobe disappoint next week, or if NVIDIA GTC triggers fresh AI disruption fears, IGV could retest the February lows. The $80 put gamma support should provide a floor, but a break below $76.26 opens the door to the Fibonacci target of $70.73. The December implied lower range of $69.63 marks the extreme downside.
What triggers this: Another AI disruption catalyst, earnings misses from ORCL/ADBE, macro deterioration, or Palantir blowing up in May at 232x P/E.
⚖️ Base Case: $85 - $92
Probability: ~50%
IGV continues to chop between the $85 sticky gamma zone and the $90 resistance wall through March and into Q2. The earnings results so far have been solid (CRM, CRWD, PANW, SNOW, WDAY all beat), which supports a slow grind higher. The March Triple Witch implied range of $81.12 - $90.42 brackets this scenario well.
What triggers this: Mixed but generally positive earnings from ORCL and ADBE, no surprises from GTC, gradual recovery in sentiment. JPMorgan calling the selloff "broken logic" and Wedbush calling it a "generational opportunity" provide an analyst floor.
🚀 Bull Case: $92 - $102
Probability: ~25%
If Oracle and Adobe both beat, GTC catalyzes an "AI is good for software" narrative flip, and Microsoft delivers in late April, IGV could push through the $90 gamma wall and run toward the December implied upper range of $101.91. The options market's 50-day call/put ratio at 2.79 (100th percentile) shows extreme bullish positioning is already building.
What triggers this: Upside earnings surprises + positive AI narrative shift + improving macro sentiment. Fundstrat notes software is "on the verge of trying to turn" with sellers largely exhausted.
💡 Trading Ideas
🛡️ Conservative: "The Patience Play" -- Cash-Secured Put Write
Strategy: Sell the IGV April 17, 2026 $78 put for approximately $1.00-$1.20
Why this works: You collect premium while agreeing to buy IGV at $78 -- that is 9% below the current price and just above the February 5 low of $76.26. If IGV stays above $78 through April OPEX (which the implied move range of $79.83-$91.71 suggests is likely), you pocket the premium. If you get assigned, you are buying a basket of the best software companies in the world at the absolute bottom of a record drawdown.
📊 Max gain: ~$100-$120 per contract 📊 Breakeven: ~$76.80 (below the 52-week low) 📊 Margin required: ~$7,800 per contract 📊 Best for: Investors who would happily own IGV at a 9% discount
⚖️ Balanced: "The Earnings Bracket" -- April Call Spread
Strategy: Buy the IGV April 17, 2026 $86 call / Sell the April 17, 2026 $92 call for approximately $2.00-$2.50 net debit
Why this works: You capture the upside from the Oracle (March 10), Adobe (March 12), and GTC (March 16-19) catalyst cluster, with a defined risk. The $86 strike is just above current price, and the $92 target aligns with the implied move upper range and sits just above the $90 gamma resistance wall. If catalysts go well and that $90 wall breaks, the spread pays out nicely.
📊 Max gain: ~$350-$400 per spread (at $92+ by April OPEX) 📊 Max loss: $200-$250 per spread (the debit paid) 📊 Breakeven: ~$88-$88.50 📊 Risk/reward: ~1.5:1 📊 Best for: Traders with a moderately bullish view who want defined risk through the catalyst gauntlet
🚀 Aggressive: "The Narrative Flip" -- June $90/$100 Call Spread
Strategy: Buy the IGV June 19, 2026 $90 call / Sell the June 19, 2026 $100 call for approximately $2.50-$3.00 net debit
Why this works: This gives you until the June Triple Witch -- enough time for Oracle, Adobe, GTC, Microsoft earnings, and Palantir earnings all to play out. If the AI narrative flips from "disruption threat" to "growth accelerant" (which multiple analysts expect), IGV has room to push past $90 and toward $100. The June implied range goes up to $94.14, and a strong catalyst sequence could push even higher.
📊 Max gain: ~$700-$750 per spread (at $100+ by June OPEX) 📊 Max loss: $250-$300 per spread (the debit paid) 📊 Breakeven: ~$92.50-$93 📊 Risk/reward: ~2.5:1 📊 Best for: Traders who believe the software selloff was overdone and want exposure to a multi-month recovery. This mirrors the directional view of the original risk reversal that was just unwound -- but with defined risk and a shorter time horizon.
⚠️ Risk Factors
❗ AI disruption is real and accelerating -- The Anthropic legal AI tools launch was not a one-off scare. AI companies are actively moving up the stack from models to applications, directly competing with SaaS incumbents. This could be a secular trend, not just a sentiment blip.
❗ Concentration risk in IGV -- The top 10 holdings are ~60% of the fund. Palantir alone is 8.7% at a 232x P/E multiple. A single bad earnings report from PLTR or MSFT can move the whole ETF.
❗ The unwind itself is a signal -- When institutional money closes a bullish position at a loss (IGV is nowhere near $110 and well above $60), it often means their thesis has changed. Do not ignore the signal just because you like the sector.
❗ Below all moving averages -- IGV is trading below its 5-day, 10-day, 20-day, 60-day, and 200-day SMAs. Technically, this is a downtrend until proven otherwise. $86.85 is the first level that needs to break.
❗ Macro headwinds persist -- The new 10% global tariff has a 150-day limit but creates enterprise spending uncertainty. Software companies may guide conservatively.
❗ Options are expensive -- Elevated implied volatility means you are paying more for directional bets. Premium sellers benefit, but buyers need bigger moves to profit.
🎯 The Bottom Line
Real talk: A $2.9M risk reversal unwind on an ETF like IGV is not something you see every day. This was an institutional player who had been positioned for a massive software recovery (long $110 calls funded by short $60 puts) and decided today was the day to walk away.
The timing matters. They closed before the Oracle/Adobe/GTC catalyst cluster, not after. That suggests they either (a) are satisfied with the bounce from $76 to $85 and want to take profits while they can, or (b) have lost conviction that software recovers to prior highs by year-end.
Here is your action plan:
📌 If you are bullish on software: The April $86/$92 call spread gives you defined-risk exposure through the March catalyst gauntlet. Watch $90 as the gamma resistance wall -- a clean break above it would be the first real sign of trend change.
📌 If you are on the sidelines: Wait for Oracle (March 10) and Adobe (March 12) to report. Those two names are 12% of IGV combined and will set the tone. Mark your calendar for March 16 -- Jensen Huang's GTC keynote could be the narrative catalyst that finally shifts the AI-disruption story to AI-opportunity.
📌 If you are bearish: The fact that institutional money is closing bullish bets supports your view. But be careful -- options traders are aggressively buying the dip (call/put ratio at 100th percentile), and fundamentals from recent earnings have been strong. A short position here requires conviction that AI disruption permanently impairs SaaS business models.
The software sector is at a crossroads. The February selloff priced in a worst-case AI disruption scenario. The March catalyst cluster will tell us whether that fear was justified or whether this is indeed the generational buying opportunity that the bulls are calling it. Either way, $2.9M just walked out the door -- and the reasoning behind that exit is worth watching closely.
⚠️ Disclaimer: This analysis is for educational and informational purposes only. It is not financial advice. Options involve significant risk and are not suitable for all investors. You can lose more than your initial investment. Always do your own research and consider your risk tolerance before trading. Past unusual options activity does not guarantee future price direction.
Data sourced from institutional options flow monitoring. For more real-time options flow analysis, visit Ainvest.