🛢️ IMO $3.2M Put Protection - Smart Money Hedges Oil Price Collapse! 🛡️
📅 December 4, 2025 | 🔥 Unusual Activity Detected
🎯 The Quick Take
Someone just dropped $3.24 MILLION on IMO puts this morning, buying 13,100 total contracts of $95 strike puts expiring January 16th! This defensive positioning comes as WTI crude sinks toward $59 and WCS differentials widen to $13 (weakest since March), creating perfect storm headwinds for Canadian energy producers. With Imperial trading near 52-week highs at $94.64 despite collapsing oil prices, smart money is buying insurance against the inevitable margin squeeze. Translation: Institutions protecting positions as oil fundamentals deteriorate!
📊 Company Overview
Imperial Oil (IMO) is Canada's premier integrated oil & gas producer with deep ExxonMobil backing:
- Market Cap: $47.8 Billion
- Industry: Petroleum Refining & Integrated Production
- Current Price: $94.64 (near 52-week high of $101.01)
- Primary Business: Upstream oil sands production (Kearl, Cold Lake, Syncrude), downstream refining (425K bpd capacity), petrochemicals, and emerging renewable diesel operations
- Strategic Owner: 69.6% owned by ExxonMobil, providing unmatched technical resources and operational expertise
💰 The Option Flow Breakdown
The Tape (December 4, 2025):
| Time | Symbol | Side | Buy/Sell | Type | Expiration | Premium | Strike | Volume | OI | Size | Spot | Option Price |
|---|---|---|---|---|---|---|---|---|---|---|---|---|
| 10:37:21 | IMO | ASK | BUY | PUT $95 | 2026-01-16 | $2.30M | $95 | 10,000 | - | 10,000 | $94.64 | $23.00 |
| 10:37:21 | IMO | ASK | BUY | PUT $95 | 2026-01-16 | $943K | $95 | 3,100 | - | 3,100 | $94.64 | $30.42 |
🤓 What This Actually Means
This is commodity risk hedging by someone with major IMO exposure! Here's the breakdown:
- 💸 Total premium spent: $3.24M across two simultaneous trades
- 🎯 Protection strike: $95 is just 0.7% below current price - protecting against ANY downside!
- 📊 Strategic pattern: Two trades (10,000 + 3,100 contracts) at IDENTICAL strike and expiration but different premiums ($23.00 vs $30.42)
- 🛢️ Oil price timing: Positioned as WTI hits $59 (down from $70 at year start) and WCS differentials widen to $13
- ⏰ 43 days to expiration: Captures Q4 earnings (late January), 2026 guidance, and critical oil price trajectory through winter
- 📈 Unusual volume: 6,742% increase vs average 149 puts - this is exceptional activity
What's really happening: This trader holds a SUBSTANTIAL long position in IMO stock accumulated during the rally from $88 (post-Q3 earnings) to $100+ in mid-November. Now, with oil prices collapsing and the stock stubbornly holding near 52-week highs despite deteriorating fundamentals, they're paying $23-30 per contract for Jan 16 $95 puts as insurance. The twin trades suggest scaling into protection or hedging multiple portfolios. If IMO drops below $95 (just 0.7% away!), these puts become profitable dollar-for-dollar. With WTI potentially falling to $50 in 2026 per EIA forecasts, this is prudent risk management.
Critical insight: The two different premiums ($23.00 vs $30.42) for IDENTICAL contracts suggest these traded minutes apart or came from different liquidity pools - either way, someone was AGGRESSIVELY buying ANY available protection regardless of price slippage. That's desperation hedging, not casual portfolio insurance.
📈 Technical Setup / Chart Check-Up
YTD Performance Chart
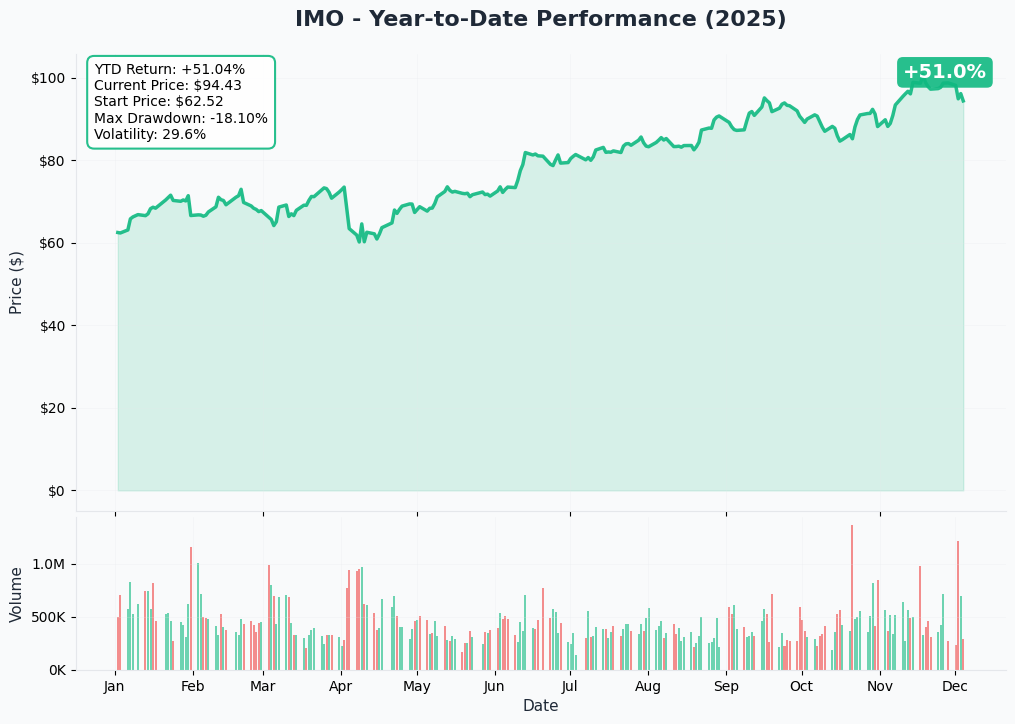
IMO shows massive disconnect between stock performance and oil fundamentals! Up +25% over 12 months (market cap grew from ~$38B to $48.5B), the stock started 2025 around $75, crashed to 52-week low of $58.76 in April during oil selloff, then rocketed to $101.01 in mid-November on record Kearl production and restructuring announcements.
Key observations:
- 🚀 Powerful rally: Climbed from $88 post-Q3 earnings (Oct 31) to $100+ peak in just 2 weeks
- ⚠️ Diverging from WTI: Stock near highs while WTI collapsed from $70 to $59 - unsustainable!
- 🏔️ Tested all-time high: $101.01 represents multi-year peak from energy bull market
- 📉 Recent pullback: Fell from $101 to current $94.64 (6.3% correction) as oil reality sets in
- 🎢 High volatility zone: Trading in $88-101 range for 6 weeks shows indecision
The chart screams "PRICED FOR PERFECTION" - any disappointment in Q4 earnings or oil price recovery could trigger sharp reversion toward $85-88 support.
Gamma-Based Support & Resistance Analysis
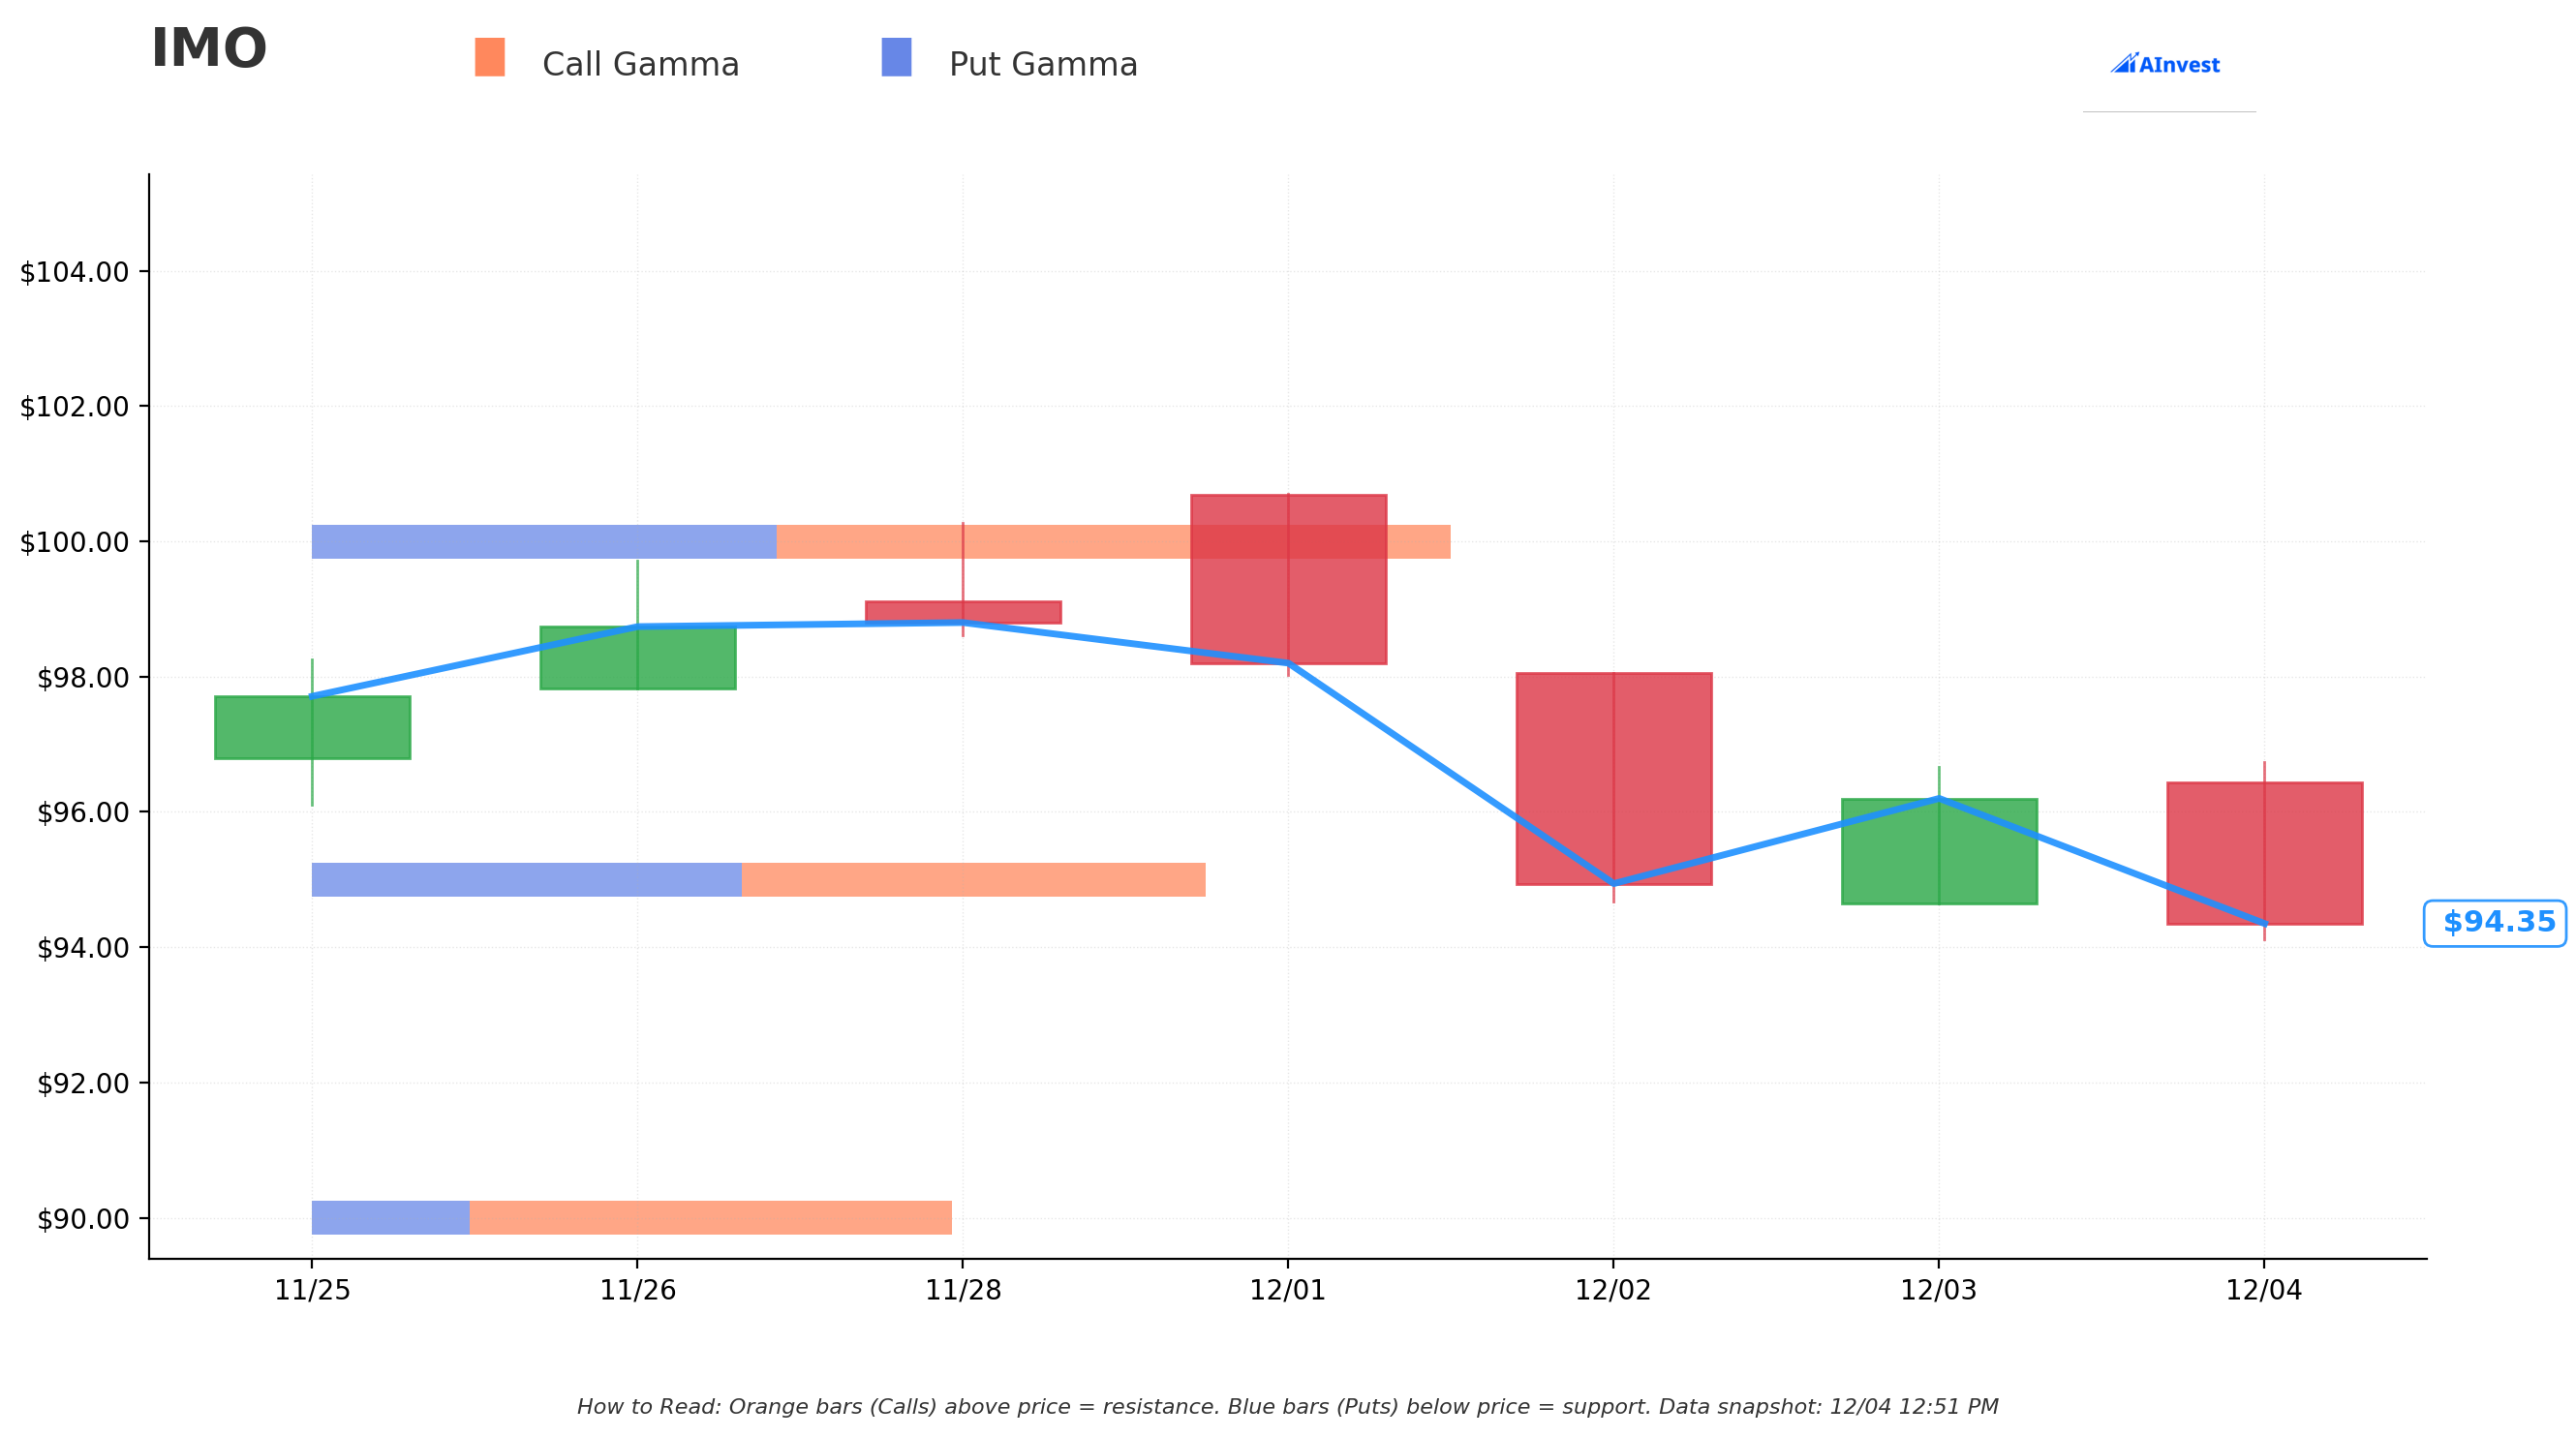
Current Price: $94.33
The gamma exposure map reveals where market makers and institutions are heavily positioned:
🔵 Support Levels (Put Gamma Below Price):
- $90.00 - Major support floor with 11.5M total gamma (strongest put wall - 5.9% below price)
- $85.00 - Secondary support at 3.1M gamma (10% drawdown zone)
- $80.00 - Disaster floor with 0.45M gamma (15.2% crash scenario)
🟠 Resistance Levels (Call Gamma Above Price):
- $95.00 - Immediate ceiling with 16.1M total gamma (STRONGEST LEVEL - exactly where put is struck!)
- $100.00 - Secondary resistance at 20.0M gamma (6% overhead, previous peak area)
- $105.00 - Extended target with 8.4M gamma (11.3% rally needed)
- $110.00 - Maximum upside barrier at 17.4M gamma (16.6% above, all call gamma)
What this means for traders: IMO is trading in a TIGHT range just below massive $95 resistance (16.1M gamma - this is THE WALL!). The put buyer struck EXACTLY at this critical level which has both technical significance (round number, recent resistance) and gamma significance (largest near-term barrier). Below current price, the $90 level with 11.5M gamma represents major support - break that and momentum accelerates toward $85 quickly.
Notice the setup? The $95 put strike is brilliant positioning - it's the HIGHEST resistance level with massive gamma, meaning if oil prices continue falling, IMO will struggle to break above $95 and likely grinds lower. The put buyer gets protection starting IMMEDIATELY (stock already at $94.64, just 36 cents below strike). This is textbook "portfolio insurance at the peak."
Net GEX Bias: Bullish (58.4M call gamma vs 26.8M put gamma) - Options positioning remains constructive overall, but immediate price action constrained by overhead $95 and $100 barriers. The call gamma dominance suggests most market participants are positioned for oil recovery, NOT the bearish scenario this put buyer fears.
Implied Move Analysis
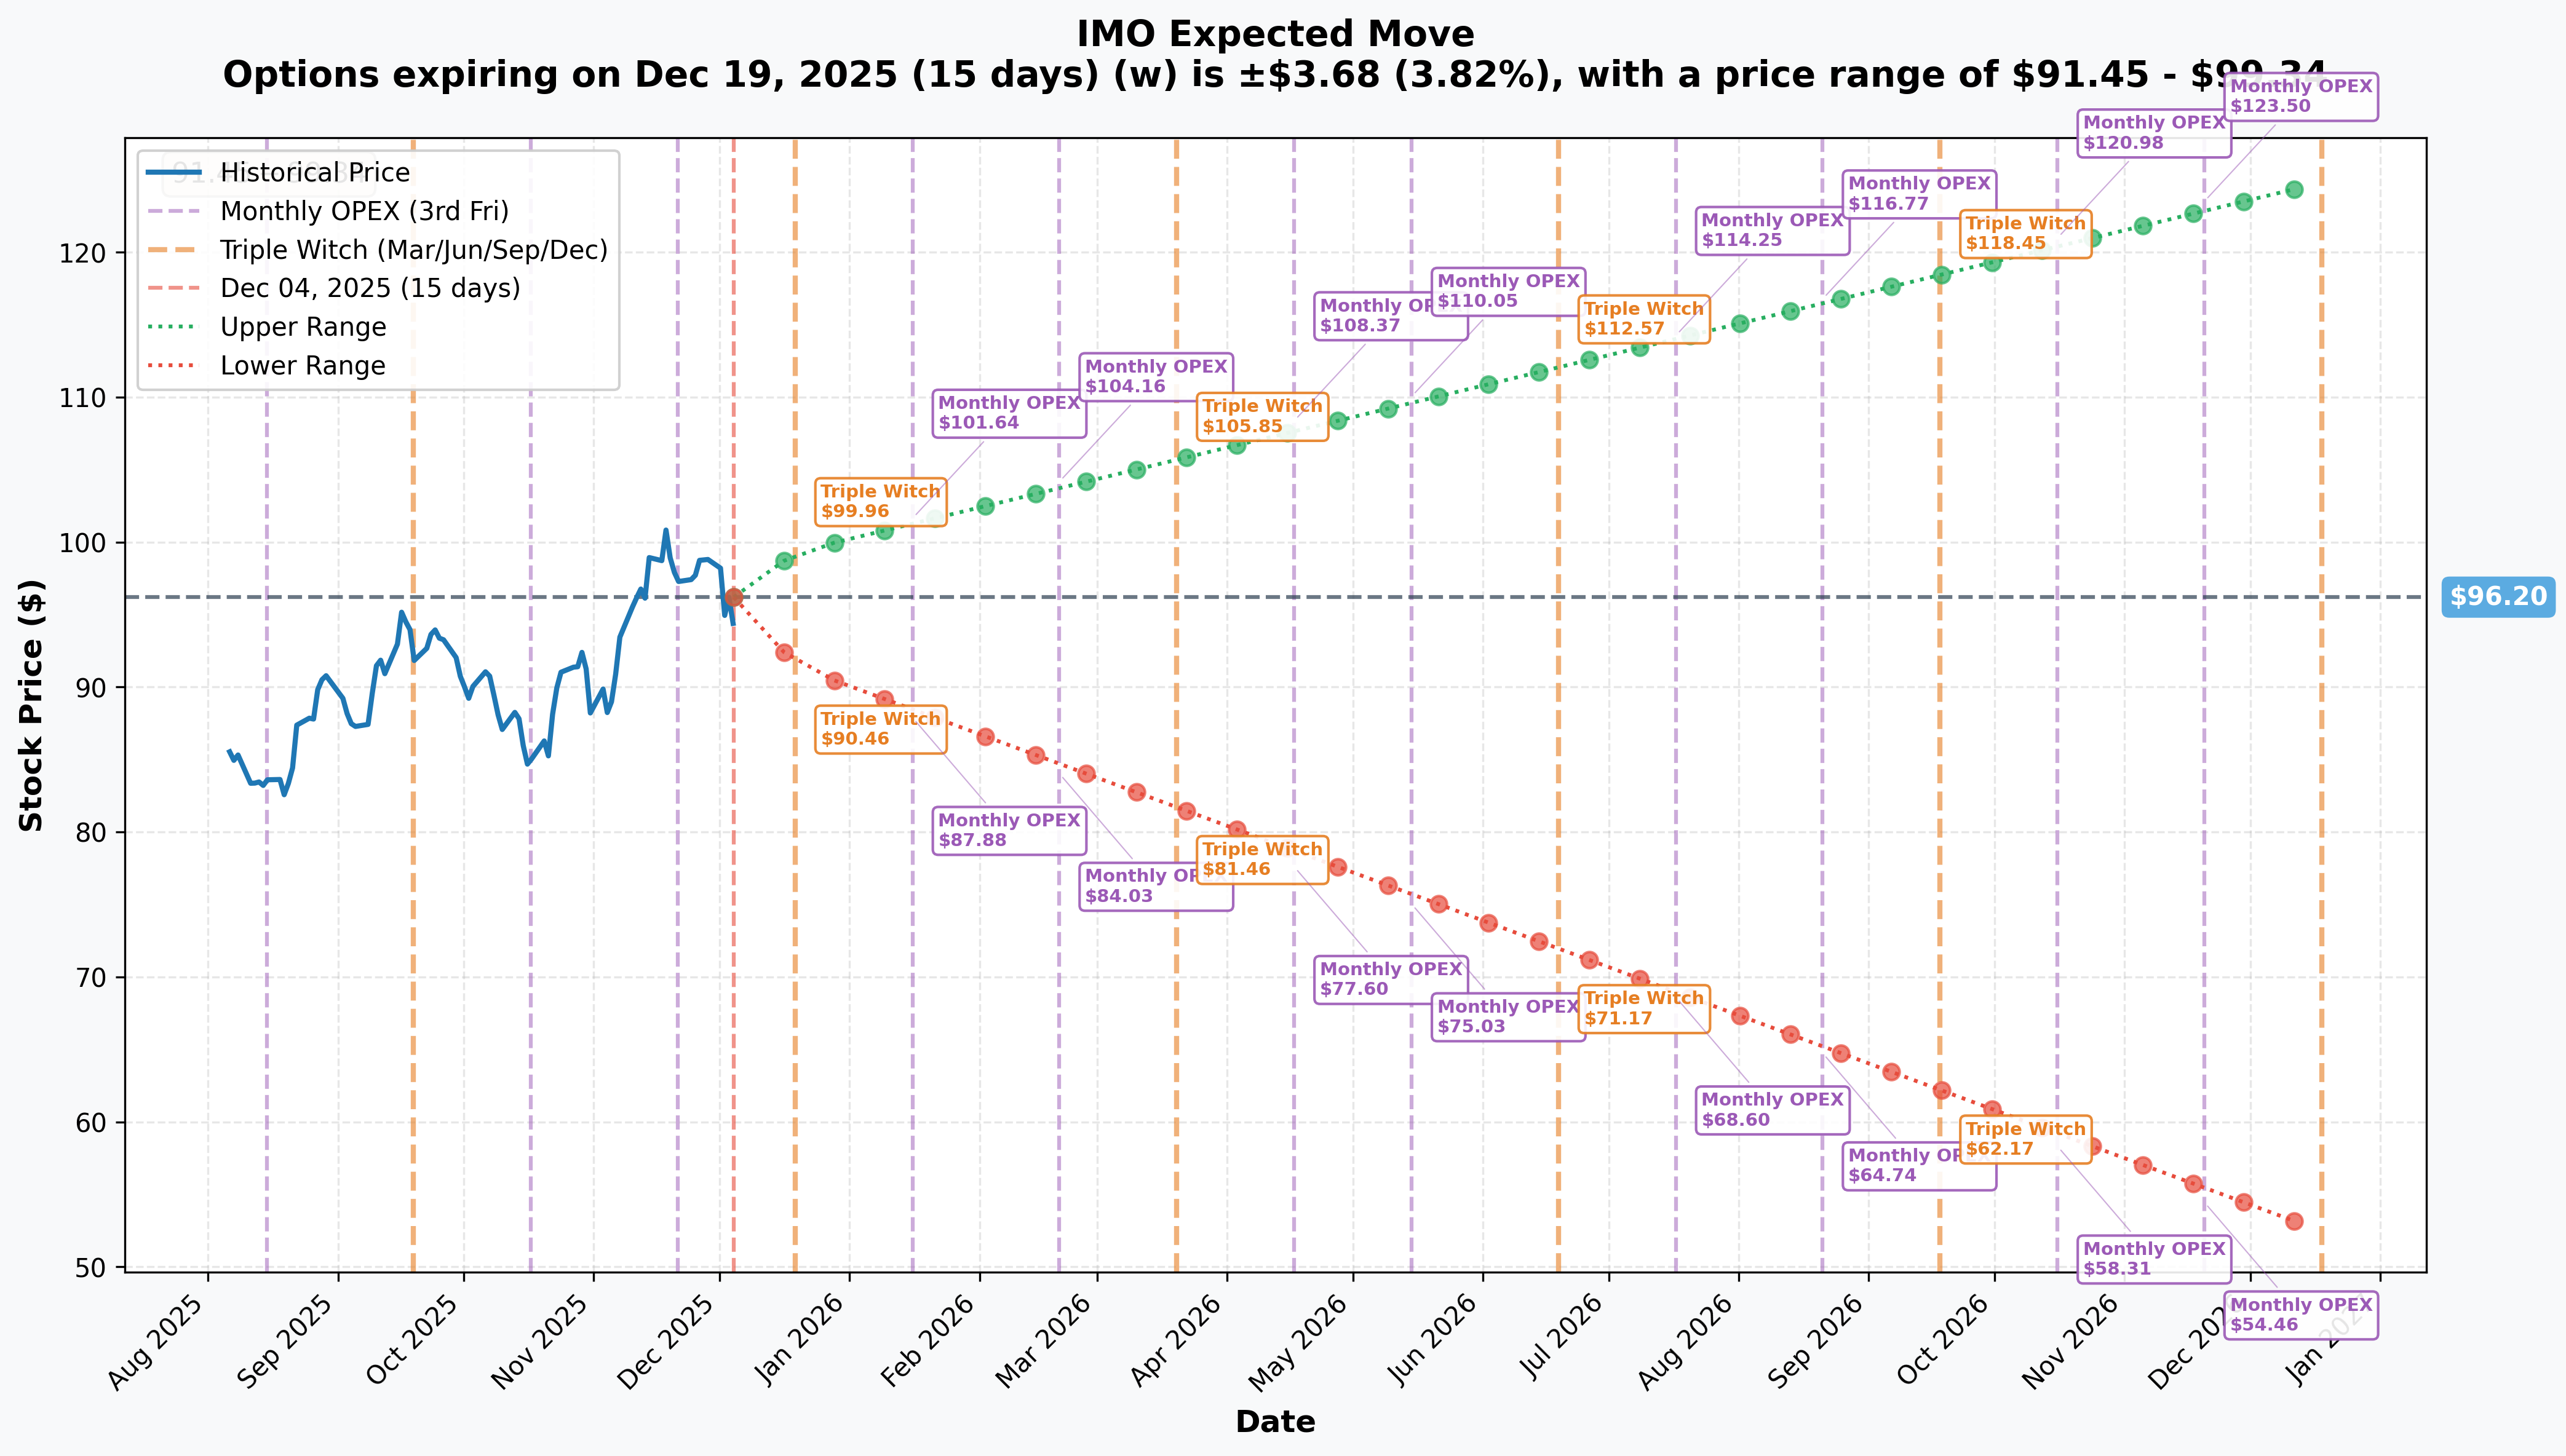
Options market pricing for upcoming expirations:
- 📅 December OPEX (Dec 19 - 15 days): ±$3.68 (±3.82%) → Range: $91.45 - $99.34
- 📅 January OPEX (Jan 16 - 43 days - THIS TRADE!): ±$6.85 (±7.12%) → Range: $87.88 - $101.64
- 📅 February OPEX (Feb 20 - 78 days): ±$10.06 (±10.46%) → Range: $84.03 - $104.16
- 📅 March Triple Witch (Mar 20 - 106 days): ±$12.23 (±12.71%) → Range: $81.46 - $105.85
Translation for regular folks: Options traders are pricing in a 3.8% move ($3.68) by December 19th but a LARGER 7.1% move ($6.85) through January 16th when Q4 earnings hit. The market expects modest volatility for a Canadian energy stock - but the put buyer clearly thinks downside risk is UNDERPRICED.
The January 16th expiration (when this $3.24M trade expires) has a lower range of $87.88 - meaning the market assigns real probability to IMO trading down 7% from current levels. However, with oil price forecasts suggesting WTI at $50 in 2026, a 7-15% drawdown in IMO seems CONSERVATIVE, not aggressive.
Key insight: The implied move shows market complacency - only expecting ±7% through earnings despite oil down 15% YTD. Smart money paying up for puts suggests the IMPLIED volatility significantly underestimates REALIZED volatility coming.
🎪 Catalysts
🔥 Immediate Catalysts (Past - Already Happened)
Q3 2025 Earnings - October 31, 2025 (COMPLETED) 📊
Imperial reported Q3 results that delivered mixed signals:
- ✅ EPS Beat: $2.17 CAD vs $1.94 consensus (11.9% beat); adjusted $1.57 vs $1.44 expected
- ❌ Revenue Miss: $12.05B vs $13.92B consensus (13.4% miss) - major shortfall!
- 💰 Net Income: $539M reported ($1,094M excluding identified items), down from $1,237M in Q3 2024
- 🏭 Record Production: 462,000 gross boe/d (highest in 30 years!)
- 🎯 Kearl Peak: 316,000 bpd gross (224,000 Imperial's share) - all-time high
- ⚖️ Margin Pressure: Lower upstream realizations partially offset by higher refining margins
- 💔 Stock Reaction: Dropped 3.56% to $88 pre-market on revenue miss despite EPS beat
Major Restructuring Announcement - September 29, 2025 ✂️
Imperial announced transformative 20% workforce reduction:
- 👷 Job Cuts: ~900 positions eliminated (mostly Calgary corporate) by end of 2027
- 💰 Cost Savings: $150M annual expense reduction target by 2028
- 💸 Restructuring Costs: $330M to cover severance and transition
- 📍 Office Consolidation: Calgary campus sold via sale-leaseback for undisclosed amount, relocating to Strathcona Refinery
- 🎯 Operating Cost Target: Reduced from $20 to $18 per barrel
- ⚠️ Execution Risk: 2-year transition creates operational uncertainty
Renewable Diesel Facility Launch - July 2025 🌱
Started operation of Canada's largest renewable diesel facility at Strathcona Refinery:
- 🏭 Capacity: 20,000 bpd (1 billion liters annually)
- 🌍 Environmental Impact: Significant GHG emissions reduction contribution
- 📈 Strategic Positioning: Diversifies into lower-carbon fuels for energy transition
- 💚 Margin Potential: Renewable diesel commands premium pricing vs conventional
🚀 Upcoming Catalysts (Next 6 Months)
Q4 2025 Earnings Release - January 30, 2026 (26 DAYS AFTER PUT EXPIRATION!) 📊
Scheduled for January 30, 2026 - CRITICAL TIMING NOTE: The $95 puts expire January 16th, TWO WEEKS BEFORE earnings! This isn't earnings protection - this is oil price protection. The put buyer expects oil weakness to pressure the stock BEFORE earnings, not after.
Key metrics to watch when earnings eventually hit:
- 🎯 Full-year 2025 upstream production: Target was 445,000 bbl/d gross (achieved 462,000 in Q3!)
- 💰 Impact of WCS differential widening: Differentials hit $13 in early December, crushing upstream realizations
- 🏭 Refinery throughput performance: Can downstream margins offset upstream pain?
- 💸 Restructuring progress: Are $150M savings on track?
- 🛢️ 2026 capital spending & production guidance: Critical for valuation
2026 Guidance Release - Mid-December 2025 (WITHIN PUT WINDOW!) 📋
Imperial plans to issue annual guidance for 2026 in mid-December 2025 - this falls WITHIN the January 16th put expiration window and could be MAJOR catalyst either way:
Expected guidance components:
- 🎯 Kearl production targets: Opportunity to grow beyond 300,000 bpd mentioned
- 🏔️ Cold Lake targets: Long-term guidance raised to 165,000 bpd from ~150,000 bpd
- 💰 Capital expenditure guidance: Likely higher in 2026 before trending lower 2027+
- ⚖️ Cost reduction milestones: Cold Lake targeting $13/barrel, overall $18/barrel
- 🛢️ Oil price assumptions: CRITICAL - will they use $60, $70, or $80 WTI for planning?
Why this matters for the put trade: Conservative guidance (reflecting $55-60 WTI assumptions) would validate bearish oil outlook and pressure stock toward $85-90. Aggressive guidance (assuming oil recovery to $70+) would be positive but creates setup for disappointment if oil stays weak.
Leming SAGD Project Start-up - Q4 2025/Early 2026 🏭
First oil anticipated "in the coming weeks" as of Q3 earnings call:
- 🎯 Peak Production: Expected to ramp to ~9,000 bpd
- 🔬 Technology: Steam-assisted gravity drainage (SAGD) thermal recovery
- 📈 Timing: Primarily contributes to 2026+ production, minimal Q4 2025 impact
- ⚠️ Ramp Risk: New projects always carry commissioning and performance uncertainty
Share Buyback Continuation (Through June 28, 2026) 💰
Up to 25.45M shares (5% of outstanding) approved through June 2026:
- 💵 Historical Returns: Returned over C$20B to shareholders via dividends + buybacks since 2020
- 🏦 ExxonMobil Participation: Expected to participate to maintain 69.6% ownership
- 📊 Stock Support: Provides bid support during weak markets
- ⚠️ Flexibility: Management could REDUCE buybacks if oil prices stay weak, removing support
Dividend Declaration - Q4 2025 (JUST ANNOUNCED!) 💎
Q4 2025 dividend of $0.72 per share payable January 1, 2026 to shareholders of record December 3:
- 📊 Annual Yield: $2.88 annualized (~3.0% yield at current price)
- 📈 Dividend Growth: Increased from $0.60 in Q4 2024 to $0.72 (20% increase in Q1 2025)
- 🏆 Track Record: 30 consecutive years of dividend increases
- 💪 Commitment: Signals management confidence despite oil headwinds
- ⚠️ Sustainability: At $59 WTI, dividend coverage becomes question mark
📊 Market Dynamics & Competitive Forces
Trans Mountain Expansion Impact 🚇
TMX added 590,000 bpd of export capacity to West Coast:
- 📉 WCS Differential: Expected to narrow over time as Canadian crude reaches Asia
- 🎯 Imperial Position: Minor player in TMX reservations (small contracted volumes)
- ⚖️ Double-Edged Sword: Better pricing helps margins BUT enables competitor production growth
- ⏰ Timeline: Full impact likely 2026-2027 as Asian markets develop
Integrated Producer Competition 🥊
Imperial faces intensifying competition from larger Canadian peers:
- Suncor Energy: 810-840K bpd guidance for 2025 (4.4% growth), aggressive cost cuts under CEO Kruger
- Cenovus Energy: 805-845K boepd guidance (4.4% growth), 95% refinery capacity in U.S. creates tariff exposure
- Canadian Natural Resources: Largest producer, diversified asset base
- Imperial Advantage: Integrated model with 79% refinery capacity in Canada provides partial hedge vs WCS weakness
⚠️ Risk Catalysts (Negative - THE PUT BUYER'S THESIS!)
Oil Price Collapse - THE PRIMARY RISK 🛢️💔
This is what the put buyer is hedging against - and the setup is BRUTAL:
- 📉 WTI Trajectory: Fell from $70 at start of 2025 to $59 currently (15.7% decline)
- 💀 2026 Forecasts: IEA expects 4M bpd surplus; EIA forecasts WTI at $50
- 🇨🇦 WCS Differential: $13 discount as of December 3rd, weakest vs WTI since March
- 🌊 Global Oversupply: U.S., Canada, Brazil production growth + OPEC+ accelerating increases
- 💸 Imperial Impact: Every $1 drop in WTI = massive hit to upstream profitability
- 📊 Revenue Risk: Q3 already saw 13.4% revenue miss despite record production volumes
Double Squeeze Scenario: Lower WTI hurts absolutely, wider WCS differentials hurt EXTRA. Even Imperial's integrated model (refining margins benefit from cheap WCS feedstock) can't fully offset this magnitude of upstream pain.
Valuation Disconnect at 52-Week Highs 📊
Stock trading at $94.64 vs $101.01 high despite fundamentals deteriorating:
- ⚠️ Price vs Reality: Up 25% over 12 months while WTI down 15% - mathematically unsustainable
- 💰 Q3 Results: Revenue MISS of 13.4%, net income DOWN $98M YoY - not exactly bullish!
- 📉 Analyst Consensus: "Reduce" rating with 1 Buy, 6 Hold, 5 Sell
- 🎯 Price Targets: Average C$115 in CAD terms, but assumes oil recovery
- 💥 Downside Risk: Reversion to $85-88 (10% correction) would just be mean reversion
Restructuring Execution Risk ✂️
The 20% workforce reduction by end of 2027 creates multiple risks:
- ⏰ Timeline Uncertainty: 2+ year transition period with operational disruption risk
- 💸 Cost Overruns: $330M restructuring cost could balloon if severance negotiations difficult
- 👷 Talent Loss: Critical technical expertise leaving during oil sands expansion
- 🏛️ Political Pressure: Canadian government and Alberta premier expressed disappointment
- 📊 Savings Delay: $150M target not fully realized until 2028
Canadian Emissions Regulations 🌍
Proposed oil & gas emissions cap creates long-term uncertainty:
- 🎯 Target: 27% reduction below 2026 levels (35% below 2019) by 2030-2032
- 💰 Compliance Costs: Cap-and-trade system adds operating expenses
- ⚠️ Production Constraints: Could limit oil sands expansion plans
- 🔄 Policy Flip-Flop: Canada recently signaled intent to eventually lift cap, but uncertainty remains
- 💸 Investment Impact: Capital allocation constrained by regulatory uncertainty
U.S. Tariff Threats 🇺🇸
Trump administration threatened tariffs on Canadian energy exports:
- 💥 Proposed: 10% tariffs on Canadian oil & gas exports
- ⚖️ Imperial Exposure: Integrated model with U.S. operations creates complex implications
- 🎯 Competitive Impact: Suncor's 79% Canadian refining may provide advantage vs Imperial/Cenovus U.S. exposure
- 🌐 Market Uncertainty: Policy unpredictability weighs on valuations
🎲 Price Targets & Probabilities
Using gamma levels, implied move data, oil price catalysts, and the mid-December 2026 guidance timing, here are scenarios through January 16th expiration:
📈 Bull Case (20% probability)
Target: $100-105
How we get there:
- 🛢️ Oil Price Reversal: WTI bounces to $65-70 on OPEC+ production cuts or demand surprise
- 📊 WCS Differential Narrows: TMX effect kicks in early, differential tightens to $8-10
- 🎯 Mid-December Guidance Beats: 2026 production targets raised, cost reductions ahead of schedule
- 🏭 Leming SAGD Success: New project ramps faster than expected, adds production beat
- 💪 Refining Margins: Q4 throughput strong (425K+ bpd at 98% utilization), margins expand
- 💰 Buyback Acceleration: Management announces INCREASED share repurchase program
- 📈 Sector Rotation: Institutions rotate back into undervalued Canadian energy vs U.S. shale
Key metrics needed:
- WTI sustained above $65
- Q4 production maintains 460K+ boe/d levels
- 2026 guidance shows Kearl growing to 320K+ bpd
- Restructuring savings tracking ahead of $150M target
Gamma implications: Break above $95 resistance (16.1M gamma) triggers short covering to $100 (20.0M gamma), could extend to $105 (8.4M gamma) on momentum.
Probability assessment: Only 20% because requires OIL PRICE RECOVERY which current fundamentals don't support. IEA forecasting 4M bpd surplus in 2026 makes $65+ WTI unlikely. Stock already near highs despite deteriorating oil macro.
🎯 Base Case (50% probability)
Target: $88-95 range (CHOPPY CONSOLIDATION, PUTS PROFIT!)
Most likely scenario:
- 🛢️ Oil Range-Bound: WTI trades $55-62 range through January, no major breakout/breakdown
- 📊 WCS Differential Stable: Remains $11-14, wider than historical average but not catastrophic
- 📋 Mid-December Guidance In-Line: Conservative 2026 targets reflecting cautious oil outlook
- ⚖️ Production Solid: Maintains 445-460K bpd, meets expectations without exceeding
- 💰 Cost Savings Progress: Restructuring on track but no early wins
- 📉 Valuation Compression: Stock drifts lower from $94 toward $88-90 as reality sets in
- 🔄 Sector Weakness: Broader Canadian energy under pressure on macro headwinds
- 😴 Low Volatility Grind: Trades within $88-95 range for weeks, no fireworks
This is the put buyer's sweet spot: Stock consolidates or grinds lower to $88-92 by January 16th. $95 puts bought at $23-30 would be worth $3-7 at $92 stock price (breakeven ~$65-72, so modest loss but provided insurance during uncertain period). The $3.24M is insurance premium they're willing to pay for downside protection.
Why 50% probability: Most realistic given current setup. Oil at $59 with bearish supply outlook, Imperial trading near highs despite Q3 revenue miss, analyst consensus "Reduce" rating. Natural drift lower without catastrophe, but no collapse either. Gamma support at $90 (11.5M) provides floor.
📉 Bear Case (30% probability)
Target: $80-88 (PUTS PAY OFF BIG!)
What goes wrong:
- 💥 Oil Price Collapse: WTI breaks below $55 toward $50 on global recession fears + oversupply
- 🚨 WCS Blowout: Differential widens to $15-18 on Canadian production surge + refinery issues
- 📉 Mid-December Guidance Disappoints: Conservative 2026 targets, reduced capex, production flat
- 😰 Margin Squeeze Evident: Q4 preview shows upstream losses overwhelming refining gains
- 💔 Dividend Cut Fears: Whispers emerge about sustainability at $50 WTI
- 📊 Analyst Downgrades: Target price cuts from RBC, TD Securities citing oil outlook
- 🛢️ Sector Contagion: Suncor/Cenovus weakness drags Imperial lower
- 🔨 Technical Break: Falls through $90 gamma support, accelerates to $85 then $80
- 🇺🇸 Tariff News: Trump administration floats actual tariff implementation
Critical support cascade:
- 🛡️ $90: Major gamma floor (11.5M) - break triggers -5% flush to $85
- 🛡️ $85: Secondary support (3.1M gamma) - must hold or panic selling begins
- 🛡️ $80: Disaster floor (0.45M gamma) - 15% total correction from current levels
Probability assessment: 30% because requires multiple negative catalysts BUT oil fundamentals strongly support this scenario. IEA 4M bpd surplus forecast, EIA $50 WTI target, current WCS weakness all point to extended oil bear market. Imperial's Q3 revenue miss despite record production PROVES volumes can't save you when prices collapse.
Put P&L in Bear Case:
- 📈 Stock at $90 on Jan 16: Puts worth $5.00, profit = loss of $18-25/share on $23-30 cost (still LOSS but reduced)
- 📈 Stock at $85 on Jan 16: Puts worth $10.00, profit = $7 gain on $23 cost or $20 loss on $30 cost (BREAKEVEN zone)
- 💰 Stock at $80 on Jan 16: Puts worth $15.00, profit = $8 loss on $23 cost or LOSS on $30 cost - WOULD NEED $77-72 to profit!
CRITICAL REALIZATION: Given the strike at $95 and current price at $94.64, these puts are BARELY out-of-the-money! If stock just drifts to $90-92, puts provide meaningful protection. The $23-30 premiums paid represent 4.8-6.3% insurance cost - expensive but not crazy for 43-day protection during oil crisis.
💡 Trading Ideas
🛡️ Conservative: Avoid Imperial Until Oil Stabilizes
Play: Stay in cash or rotate to U.S. integrated majors with better diversification
Why this works:
- 🛢️ Oil Price Headwinds: At $59 WTI trending to $50, Canadian oil sands producers face multi-quarter margin compression
- 📊 Valuation Risk: Stock at $94.64 near 52-week high despite fundamentals deteriorating (Q3 revenue miss, oil down 15%)
- 🐋 Smart Money Hedging: $3.24M institutional put buy signals sophisticated players are WORRIED
- ⚖️ Better Alternatives: Suncor rated more resistant to falling oil prices; U.S. majors (XOM, CVX) have global diversification
- 📈 Wait for Setup: Better entry at $85-88 after oil stabilizes or Imperial hits gamma support
- ⏰ Catalyst Timing: Mid-December 2026 guidance within put window could disappoint
Action plan:
- 👀 Monitor WTI closely - only consider Imperial if oil sustainably above $65
- 🎯 Watch gamma support at $90 - IF stock tests and holds, could be entry signal
- 📊 Wait for analyst sentiment shift - current "Reduce" consensus is red flag
- ⚠️ Avoid catching falling knife - oil stocks can trend lower for MONTHS in bear markets
- 💰 If you must own Canadian energy, consider equal-weight basket (Suncor/Cenovus/Imperial) for diversification
Risk level: Minimal (cash position, opportunity cost only) | Skill level: Beginner-friendly
Expected outcome: Avoid 10-20% drawdown if oil bear market persists. Can re-enter at better valuations with clearer oil price direction.
⚖️ Balanced: Post-Guidance Put Spread (Hedge the Hedge)
Play: AFTER mid-December 2026 guidance, sell put spread if stock holds up
Structure: Sell $90 puts, Buy $85 puts (January 16 expiration - SAME as the institutional trade)
Why this works:
- ⏰ Timing: Wait for mid-December guidance catalyst to pass, reducing binary event risk
- 🎯 Gamma Support: $90 strike sits exactly on major 11.5M gamma support level
- 💰 Defined Risk: $5 wide spread = $500 max risk per spread
- 📊 Premium Collection: Could collect $1.50-2.00 credit if stock stable around $93-95
- 🛡️ Institutional Positioning: Put buyer's $95 strike acts as "ceiling" - if they're right about weakness, stock unlikely to collapse below $85 before Jan 16
- 🎢 Post-Guidance Clarity: Once 2026 targets known, uncertainty premium reduces
Estimated P&L (post-guidance):
- 💰 Collect: ~$1.50-2.00 credit per spread
- 📈 Max profit: $150-200 if Imperial above $90 at January expiration (keep full credit)
- 📉 Max loss: $300-350 if Imperial below $85 (spread width minus credit)
- 🎯 Breakeven: ~$88.00-88.50
- 📊 Risk/Reward: ~2:1 (risking $350 to make $200) which is acceptable for credit spread
Entry conditions:
- ⏰ Only enter AFTER December 15-20 (once 2026 guidance released)
- ✅ Stock must be above $92 (gives cushion)
- 🛢️ WTI must be stable $58-62 (not in freefall)
- ❌ Skip if guidance is VERY bearish or stock already below $91
Position sizing: Risk only 3-5% of portfolio (this is still directional, just defined risk)
Risk level: Moderate (defined risk, short volatility) | Skill level: Intermediate
Why this counters the institutional trade: The put buyer is positioned for $95→$85 move. This spread PROFITS if stock stays $90-105. You're essentially betting their insurance expires worthless while collecting premium from elevated put prices.
🚀 Aggressive: Bearish Put Calendar - Bet on Extended Weakness (ADVANCED!)
Play: Buy longer-dated puts, sell near-term puts to finance - profit from sustained oil bear market
Structure: Sell January 16 $95 puts, Buy March 20 $90 puts
Why this could work:
- 🎯 Thesis: Oil bear market is EXTENDED, not short-term - need 3-6 month horizon to play out
- 📊 Time Decay Advantage: Sell high IV near-term puts, own longer-dated protection at lower strikes
- 🛢️ Oil Catalyst Timeline: IEA 4M bpd surplus doesn't hit until full year 2026 - March expiration captures this
- 💰 Volatility Play: If Imperial stays $93-96 through January 16, collect premium from short $95 puts expiring worthless, THEN benefit from March $90 puts if oil continues falling
- 🎢 Staged Bearishness: Don't need immediate collapse - patient bearish positioning
Why this could blow up (SERIOUS RISKS!):
- 💥 Oil Price Spike: Any OPEC+ surprise cuts or geopolitical event sends WTI to $70, both legs lose
- ⚠️ Assignment Risk: If stock drops below $95 before Jan 16, short puts could be assigned (need capital to buy 100 shares per contract at $95)
- 📈 Calendar Spread Complexity: Requires managing two expirations and understanding how time decay affects both legs differently
- 💸 Negative Carry: If stock stays flat $94-96, both legs lose time value
- 🎪 Guidance Catalyst: Positive mid-December guidance could spike stock above $100, destroying position
Estimated P&L (complex - requires modeling):
- 💰 Net Debit: ~$3-4 per spread (buy March $90 puts for ~$5-6, sell Jan $95 puts for ~$2-3)
- 📈 Best scenario: Imperial at $94-96 on Jan 16 (short puts expire worthless for $2-3 gain), then drops to $85-88 by March 20 (long puts worth $2-5, net profit)
- 📉 Worst scenario: Imperial spikes to $100+ (both legs expire worthless, lose full $3-4 debit)
- 🎯 Breakeven: Complex - need stock below ~$93 by March to recover costs
CRITICAL WARNING - DO NOT attempt unless you:
- ✅ Understand calendar spread mechanics and time decay curves
- ✅ Have margin/capital to handle potential assignment on short puts
- ✅ Can actively manage position through January expiration
- ✅ Agree with extended oil bear market thesis (WTI to $50-55 by Q1 2026)
- ✅ Accept this is speculation, not hedging (can lose 100% of debit)
Risk level: EXTREME (assignment risk, multi-leg complexity) | Skill level: Advanced only
Probability of profit: ~35-40% (requires specific price path, not just direction)
⚠️ Risk Factors
Don't get caught by these potential landmines:
-
🛢️ Oil Price Bear Market Accelerating: WTI already down from $70 to $59 (15.7% decline), but IEA forecasts 4M bpd global surplus in 2026 with WTI potentially hitting $50. This is structural oversupply (U.S. shale, Canada oil sands, Brazil offshore all growing) + OPEC+ accelerating production increases. Imperial's Q3 showed revenue MISS of 13.4% despite RECORD production - proves volumes can't save you when prices collapse. At $50 WTI, upstream losses could overwhelm refining margins entirely.
-
💔 WCS Differential Blowout: Canadian heavy crude discount widened to $13 on December 3, weakest vs WTI since March. This DOUBLE SQUEEZE (lower WTI + wider differential) crushes Imperial upstream realizations. While integrated refining benefits from cheap WCS feedstock, historical data shows this offset is partial at best. At $15+ differentials, upstream losses accelerate. Alberta budget takes C$750M hit per $1 WTI drop, creating broader provincial economic weakness.
-
📊 Valuation Disconnect Creating Reversion Risk: Stock at $94.64, just 6.3% below 52-week high of $101.01, despite fundamentals deteriorating sharply. Q3 revenue miss of 13.4%, oil down 15% YTD, analyst consensus "Reduce" with 5 Sell ratings. This is classic "lagging the fundamentals" setup - stock trading on OLD thesis (record production, ExxonMobil backing, shareholder returns) while NEW reality (collapsing oil prices, margin squeeze, oversupply) hasn't priced in. Mean reversion to $85-88 would only be 10% correction, completely justified by macro.
-
🐋 Institutional Put Buying at Peak is MAJOR Red Flag: $3.24M spent on January $95 puts representing 6,742% increase vs average volume signals sophisticated players are VERY worried. The dual trades (10K + 3.1K contracts) at different premiums ($23 vs $30) suggests aggressive buying regardless of slippage - that's FEAR, not routine hedging. When smart money pays 4.8-6.3% of stock price for 43-day protection, they see significant probability of 10-20% downside.
-
📋 Mid-December 2026 Guidance Within Put Window: Imperial releases annual 2026 guidance mid-December, BEFORE January 16 put expiration. If guidance reflects conservative oil price assumptions ($55-60 WTI) and flat/lower production targets, stock could gap down 5-8% immediately. Conversely, overly optimistic guidance (assuming $70+ oil) sets up for disappointment if oil stays weak. This catalyst is binary and falls perfectly within the put trade timeframe.
-
✂️ Restructuring Execution Uncertainty: 20% workforce reduction (900 jobs) by end of 2027 with $330M restructuring costs creates 2+ years of operational risk. Severance negotiations could get contentious, critical talent might leave early, productivity could suffer during transition. Canadian government and Alberta premier expressed disappointment, creating political pressure. The $150M annual savings target not realized until 2028 - that's 3 YEARS away while paying costs NOW.
-
📉 Q4 Earnings Risk Post-Put Expiration: While Q4 earnings on January 30 fall AFTER put expiration, early January trading will start pricing in expectations. If December production data or refinery throughput signals Q4 weakness, stock could decline ahead of formal report. The put buyer positioned for oil price pressure through mid-January, not earnings surprise - suggests they expect macro weakness to drive stock down regardless of operational performance.
-
🌍 Canadian Emissions Cap Regulatory Uncertainty: Proposed 27% emissions reduction below 2026 levels by 2030-2032 creates compliance costs and potential production constraints for oil sands operations. While Canada recently signaled intent to eventually lift cap, policy uncertainty weighs on long-term capital allocation decisions. Imperial's net zero by 2050 commitment requires massive investment in emissions reduction technology, diverting capital from production growth.
-
🇺🇸 Trump Tariff Threats Add Policy Risk: Proposed 10% tariffs on Canadian energy exports create revenue uncertainty. While Suncor's 79% Canadian refining may provide competitive advantage, Imperial's integrated model with U.S. operations faces complex implications. Any actual tariff implementation would pressure Canadian energy stocks broadly, Imperial included.
-
💰 Dividend Sustainability Questions at $50 WTI: Imperial boasts 30 consecutive years of dividend increases and $2.88 annualized dividend (3% yield). However, at $50 WTI sustained for quarters, breakeven analysis suggests dividends require $45-50 WTI minimum. Any whispers of dividend cut would crater stock 15-20% immediately. Share buyback program also at risk if cash flow compressed.
-
🎯 Gamma Ceiling at $95 Creates Natural Resistance: Massive 16.1M total gamma at $95 strike (EXACTLY where puts are struck!) means market makers will systematically SELL into any rallies approaching this level to hedge their exposure. This creates mechanical selling pressure making breakouts above $95 extremely difficult. Stock would need sustained institutional buying or major oil price spike to overcome. Current consolidation at $94-95 reflects this gamma pin effect.
-
⚖️ Competitive Pressure from Larger Peers: Suncor (810-840K bpd) and Cenovus (805-845K bpd) are MUCH larger producers than Imperial (445-462K bpd). Both growing production 4.4% in 2025 vs Imperial's 3.1% growth. Suncor's aggressive cost cuts under CEO Kruger improving competitiveness. In low oil price environment, scale and cost position matter - Imperial's mid-size position creates vulnerability.
🎯 The Bottom Line
Real talk: This $3.24M put trade is a CRYSTAL CLEAR warning shot about oil market fundamentals. Smart money just paid 4.8-6.3% of Imperial's stock price for 43 days of downside protection while the stock sits near 52-week highs. This isn't a bearish bet on Imperial's business - it's a bearish bet on OIL PRICES that Imperial can't escape.
What this trade tells us:
- 🛢️ Oil bear market is real: With WTI at $59, IEA forecasting 4M bpd surplus in 2026, and WCS differentials at $13, the macro setup for Canadian oil sands producers is BRUTAL
- 💰 Valuation extended: Stock at $94.64 (vs $101.01 high) hasn't priced in oil reality - institutional player expects reversion to $85-90
- ⏰ Timing is strategic: Mid-December 2026 guidance falls within put window - expects conservative targets to pressure stock
- 🎯 Strike selection sophisticated: $95 strike with stock at $94.64 means protection kicks in IMMEDIATELY on any weakness - this is maximum protection mode
- 📊 Not earnings protection: Expires January 16, two weeks BEFORE Q4 earnings on January 30 - this is pure oil price hedge
This IS a "reduce risk exposure" signal for Imperial specifically and Canadian oil sands broadly.
If you own IMO:
- ✅ Consider trimming 30-50% at $93-96 levels - you've had great run from $75 to $95 (26% gain!), lock in profits
- 🛡️ Set mental stop at $90 (major gamma support) if holding remaining position
- 📊 Don't fight the tape: When institutions hedge this aggressively at the peak, listen to them
- ⏰ Wait for mid-December guidance: If conservative, validates bearish thesis and justifies exit
- 💰 Reinvest proceeds: Rotate to U.S. integrated majors (XOM, CVX) with global diversification, or wait for Imperial at $85-88
If you're watching from sidelines:
- ⏰ Patience pays: Don't chase at $94 - wait for oil price stabilization or stock pullback to gamma support
- 🎯 Entry targets: $85-88 range represents 10-12% correction and solid risk/reward IF oil finds floor at $58-60
- 📋 Watch catalysts: Mid-December 2026 guidance (within weeks!), WTI price action, WCS differential trajectory
- 🛢️ Oil price prerequisite: Only consider entry if WTI sustainably above $62-65 (shows bear market broken)
- 📊 Confirmation needed: Look for analyst upgrades from current "Reduce" consensus, positive estimate revisions
If you're bearish (or hedging):
- 🎯 Put strikes: $95 and $90 are key levels based on gamma and this institutional trade
- ⏰ Timing: January through March expirations capture guidance catalyst + extended oil weakness
- 📊 Spread strategies: Put spreads or calendars offer defined risk if you agree with extended weakness thesis
- ⚠️ Don't fight gamma: Short-term, $90 support (11.5M gamma) will provide buying, but break below triggers cascade
- 💸 Manage size: This is macro bet on oil prices, not company-specific - size positions accordingly
Mark your calendar - Key dates:
- 📅 Mid-December 2025 (CRITICAL!) - 2026 guidance release (within put expiration window)
- 📅 December 19 - Quarterly triple witch, implied move range $91.45-$99.34
- 📅 January 16, 2026 - Monthly OPEX, expiration of this $3.24M put trade
- 📅 January 30, 2026 - Q4 FY2025 earnings report (after put expiration)
- 📅 Q4 2025/Early 2026 - Leming SAGD project first oil expected
Final verdict: Imperial Oil is a HIGH-QUALITY company (record production, ExxonMobil backing, 30-year dividend growth, integrated business model) trapped in a LOW-QUALITY commodity environment (collapsing WTI, widening WCS differentials, structural oversupply). The $3.24M institutional put trade says "I love this company long-term, but the next 1-2 quarters are going to be PAINFUL and I'm not taking chances."
At $94.64 near 52-week highs with oil at $59 and falling, the risk/reward is NO LONGER favorable. The analyst consensus "Reduce" rating with 5 Sell recommendations isn't wrong - they're pricing in oil reality that the stock hasn't fully absorbed yet.
Be patient. Protect capital. Let oil find a floor. Imperial will still be here at $85, and you'll sleep better paying that than $95 with $59 WTI.
Sometimes the best trade is the one you DON'T make. 💪
Disclaimer: Options trading involves substantial risk of loss and is not suitable for all investors. This analysis is for educational purposes only and not financial advice. The unusual put activity reflects one institution's hedging decision based on their specific portfolio needs - it does not constitute a recommendation to buy puts or sell Imperial Oil stock. Past performance doesn't guarantee future results. Oil prices are inherently volatile and unpredictable. Imperial Oil's strong operational track record and ExxonMobil backing provide long-term value, but near-term oil price weakness creates significant risk. Always do your own research and consider consulting a licensed financial advisor before trading.
About Imperial Oil: Imperial Oil Limited is an integrated oil company active in all phases of the petroleum industry in Canada, including exploration, production and sale of crude oil, natural gas, petroleum products, and petrochemicals, with a market cap of $47.8 billion in the Petroleum Refining industry.