📊 IWM Massive $6.5M Bullish Call Opening - Institutional Money Betting on Small-Cap Rotation! 🚀
📅 December 1, 2025 | 🔥 Unusual Activity Detected
🎯 The Quick Take
Someone just bought 14,000 contracts of IWM calls worth $6.5 MILLION this morning at 10:34:48, betting that small caps explode higher by February 20th! This bullish bet on the $260 strike comes with the Russell 2000 trading at $248.75, just 1.6% below its 52-week high. At the same time, another trader closed 23,000 contracts of December $255 calls for $2.1M - suggesting smart money is rolling profits from short-term wins into longer-dated bullish positions. Translation: Big money thinks the small-cap rotation is just getting started!
📊 ETF Overview
iShares Russell 2000 ETF (IWM) is the premier small-cap ETF, tracking the Russell 2000 Index:
- Assets Under Management: $72.48 Billion
- Holdings: 1,952 small-cap companies
- Expense Ratio: 0.19%
- Current Price: $248.75
- 52-Week Range: $171.73 - $252.77
- YTD Performance: +10.4% (through September 30)
- Q3 2025 Performance: +12.4% (significantly outperformed large caps!)
What makes IWM unique: Unlike the S&P 500 dominated by mega-cap tech (Magnificent 7), IWM provides pure small-cap exposure with 79% domestic revenue concentration. The top holding represents less than 0.84% - this is true diversification across America's smaller companies.
Top Sectors:
- 🏭 Industrials: 19%
- 💰 Financials: 18%
- 🏥 Health Care: 15%
- 🛒 Consumer Discretionary: ~12-14%
- 💻 Technology: ~10-12%
💰 The Option Flow Breakdown
📊 What Just Happened
The Tape (December 1, 2025 @ 10:34:48):
| Time | Symbol | Buy/Sell | Type | Expiration | Premium | Strike | Volume | OI Change | Z-Score | Classification |
|---|---|---|---|---|---|---|---|---|---|---|
| 10:34:48 | IWM | BUY | CALL $260 | 2026-02-20 | $6.5M | $260 | 14,000 | New | 22.77 | EXTREMELY UNUSUAL |
| 10:34:48 | IWM | SELL | CALL $255 | 2025-12-19 | $2.1M | $255 | 23,000 | Close | 6.88 | EXTREMELY UNUSUAL |
🤓 What This Actually Means
This looks like a sophisticated roll-up strategy from an institutional player! Here's the play-by-play:
🟢 The Bullish Opening (14,000 x Feb 20 $260 Calls):
- 💸 Premium paid: $6.5M (roughly $46.43 per contract)
- 🎯 Target: $260 strike is 4.5% above current price ($248.75)
- ⏰ Time horizon: 81 days to expiration - captures critical catalysts:
- December 16 jobs report (16 days away)
- December 18 FOMC meeting (17 days away)
- Q4 2025 earnings season (January/February)
- Potential for 2-3 Fed rate cuts by February
- 📊 Size matters: 14,000 contracts = 1.4 million shares worth ~$348M notional exposure
- 🔥 Unusual Score: Z-score of 22.77 means this is EXTREMELY UNUSUAL - happens only a few times per year!
🔴 The Profit-Taking (23,000 x Dec 19 $255 Calls):
- 💰 Premium received: $2.1M (roughly $9.13 per contract)
- ✅ Taking profits: These December calls are now in-the-money (current price $248.75 vs $255 strike means these were bought lower)
- ⏰ Short-term exit: With just 18 days to expiration, they're locking in gains before the critical December catalyst window
- 🔥 Also unusual: Z-score of 6.88 - still extremely unusual volume!
What's really happening here: This trader likely bought the December $255 calls weeks ago when IWM was trading lower (possibly around $235-240 range) and is now sitting on solid profits as IWM touched $248.75 (near 52-week highs). Rather than holding through the volatile December FOMC/jobs report binary events, they're rolling profits forward into February $260 calls that:
- Give more time to work (81 days vs 18 days)
- Capture Q4 earnings season in January/February 2026
- Position for sustained small-cap rotation if Fed delivers expected rate cuts
- Move the strike UP from $255 to $260 - showing increased bullish conviction!
This is NOT a hedge. This is a directional bullish bet that small caps continue their outperformance into Q1 2026. The fact they're willing to pay $6.5M for February calls while closing December calls shows they expect:
- Small-cap rally to accelerate (not just consolidate)
- Favorable Fed decision (cut or dovish hold on Dec 18)
- Strong December jobs data supporting "soft landing" narrative
- Rotation from mega-cap tech into undervalued small caps to continue
📈 Technical Setup / Chart Check-Up
YTD Performance Chart
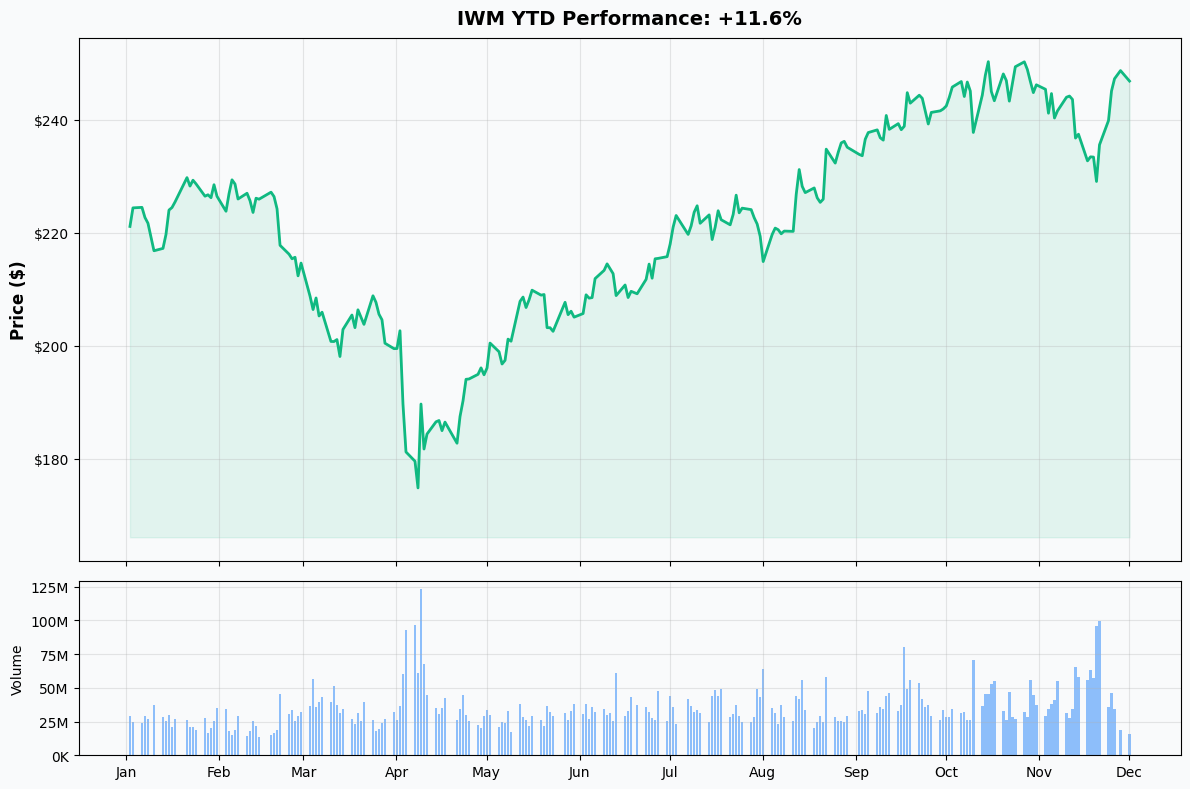
IWM is staging a powerful comeback - currently at $248.75, near its 52-week high of $252.77. The chart tells the story of a dramatic small-cap recovery:
Key observations:
- 🚀 Impressive recovery: From devastating low of $171.73 in April to near all-time highs - that's a 44.8% rally!
- 📈 Breakout momentum: IWM broke through the critical $243 resistance level in Q3 2025, coinciding with Fed rate cuts
- 📊 Q3 2025 surge: The +12.4% quarterly gain marked the best small-cap performance vs large caps in recent years
- ✅ Trading near peaks: Current price just 1.6% below 52-week high signals strong bullish momentum
- 🎯 Valuation support: Small caps trading at 16% discount to fair value vs large caps at 4% premium - 20 percentage point spread!
Why this rally makes sense: The September 2025 Fed rate cut initiated a powerful catalyst sequence for small caps. With Fed cutting rates from 4.75-5.00% peak to 3.75-4.00% currently, small caps (which have higher debt loads and sensitivity to borrowing costs) are finally getting the relief they need. According to research, small caps historically perform strongly following rate cut cycles, with average 15-25% gains in the 12 months after the first cut.
Gamma-Based Support & Resistance Analysis
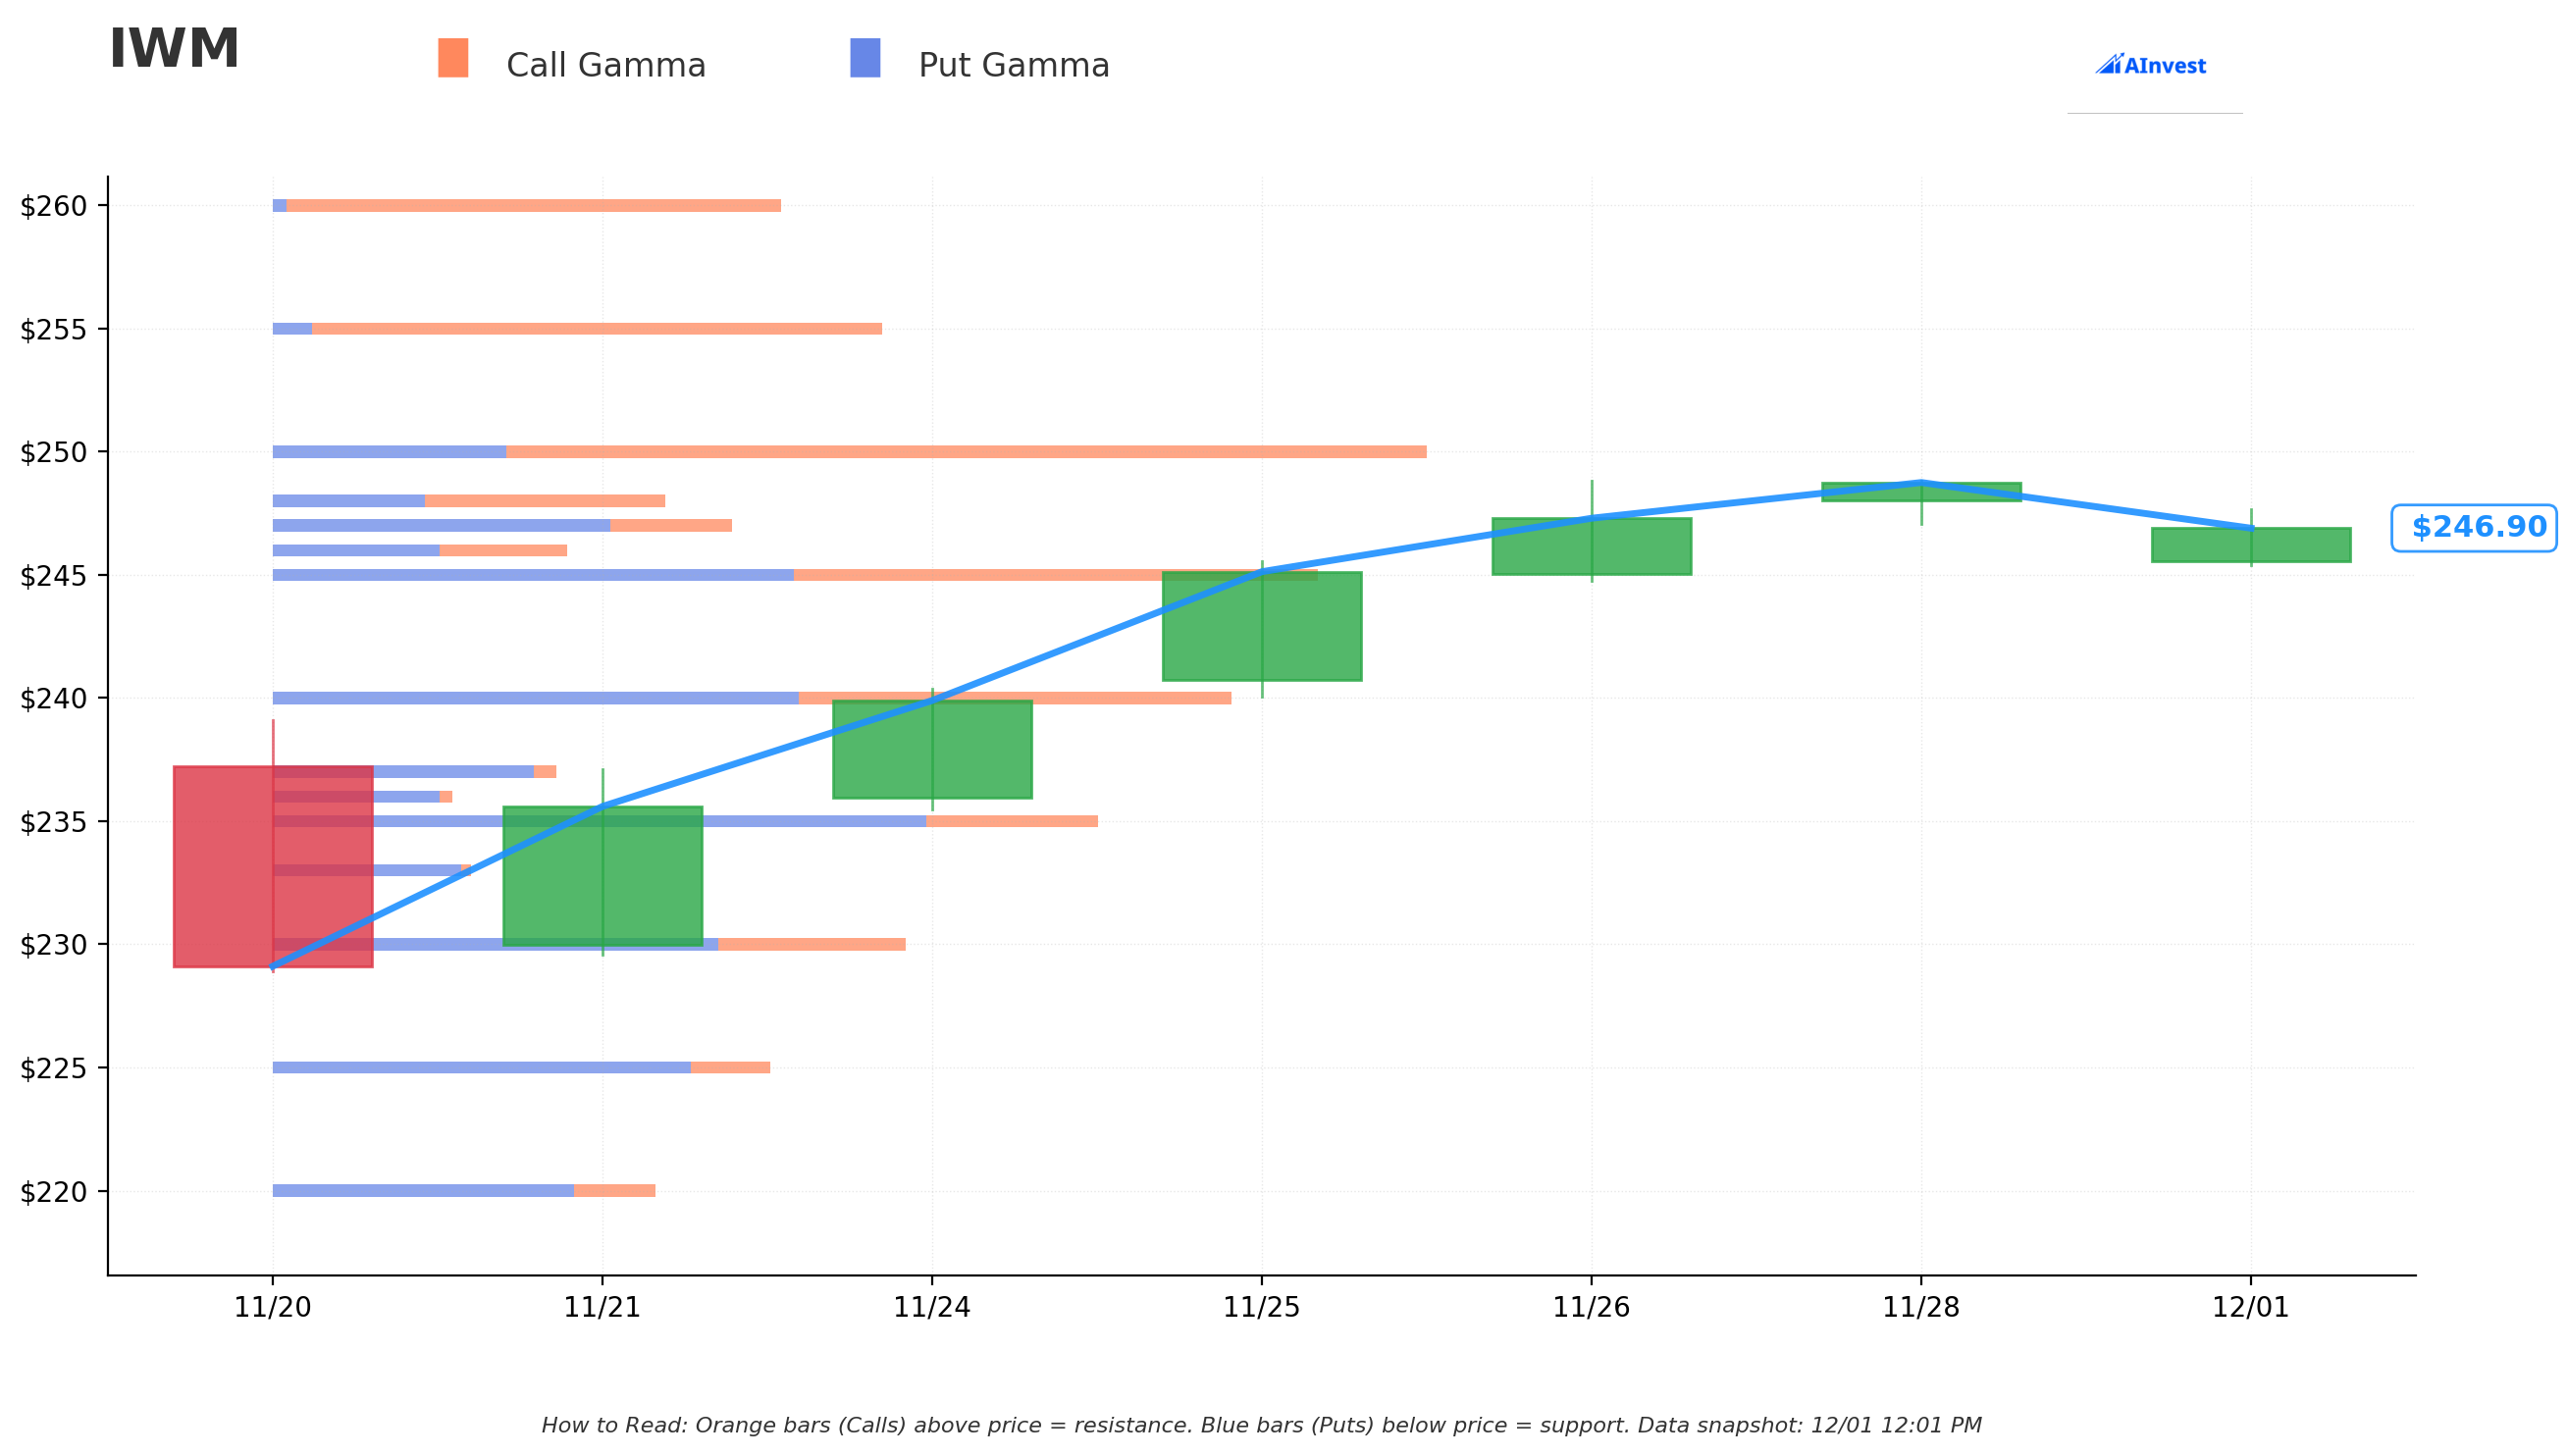
Current Price: $248.75
⚠️ DATA NOTE: The gamma exposure data for IWM shows empty arrays, which means either:
- Options data was not available at time of analysis
- Gamma positioning is relatively light compared to typical levels
- The current date (December 1) falls in a transition period between monthly expirations
However, we can rely on implied move analysis and technical levels for support/resistance guidance (see next section).
🔵 Technical Support Levels (Chart-Based):
- $243.00 - Former resistance turned support after recent breakout (immediate floor)
- $240.00 - Psychological level and secondary support
- $234.54 - 50-day moving average providing dynamic support
- $232.95 - 90-day probability range low (statistical support floor)
🟠 Technical Resistance Levels (Chart-Based):
- $252.77 - 52-week high and all-time resistance (CRITICAL level to break!)
- $250.00 - Psychological round number creating near-term ceiling
- $256.15 - 90-day probability range high (statistical resistance cap)
- $260.00 - Extended target (this is where the call buyer is positioned!)
What this means for traders: IWM is in a critical zone - trading just $3-4 away from all-time highs at $252.77. Breaking through this resistance with conviction would signal a new bullish phase for small caps. The February $260 call buyer is betting IWM breaks through $252.77, holds above it, and grinds toward $260+ over the next 2-3 months. That requires:
- Fed delivering dovish messaging (cut or friendly hold)
- Jobs data supporting "soft landing" narrative
- Continued rotation from mega-cap tech into small caps
- Q4 earnings showing small-cap profit acceleration
The tight trading range near all-time highs creates coiled spring energy - one strong catalyst could trigger explosive upside, while disappointing Fed/jobs data could cause sharp pullback to $240-243 support.
Implied Move Analysis
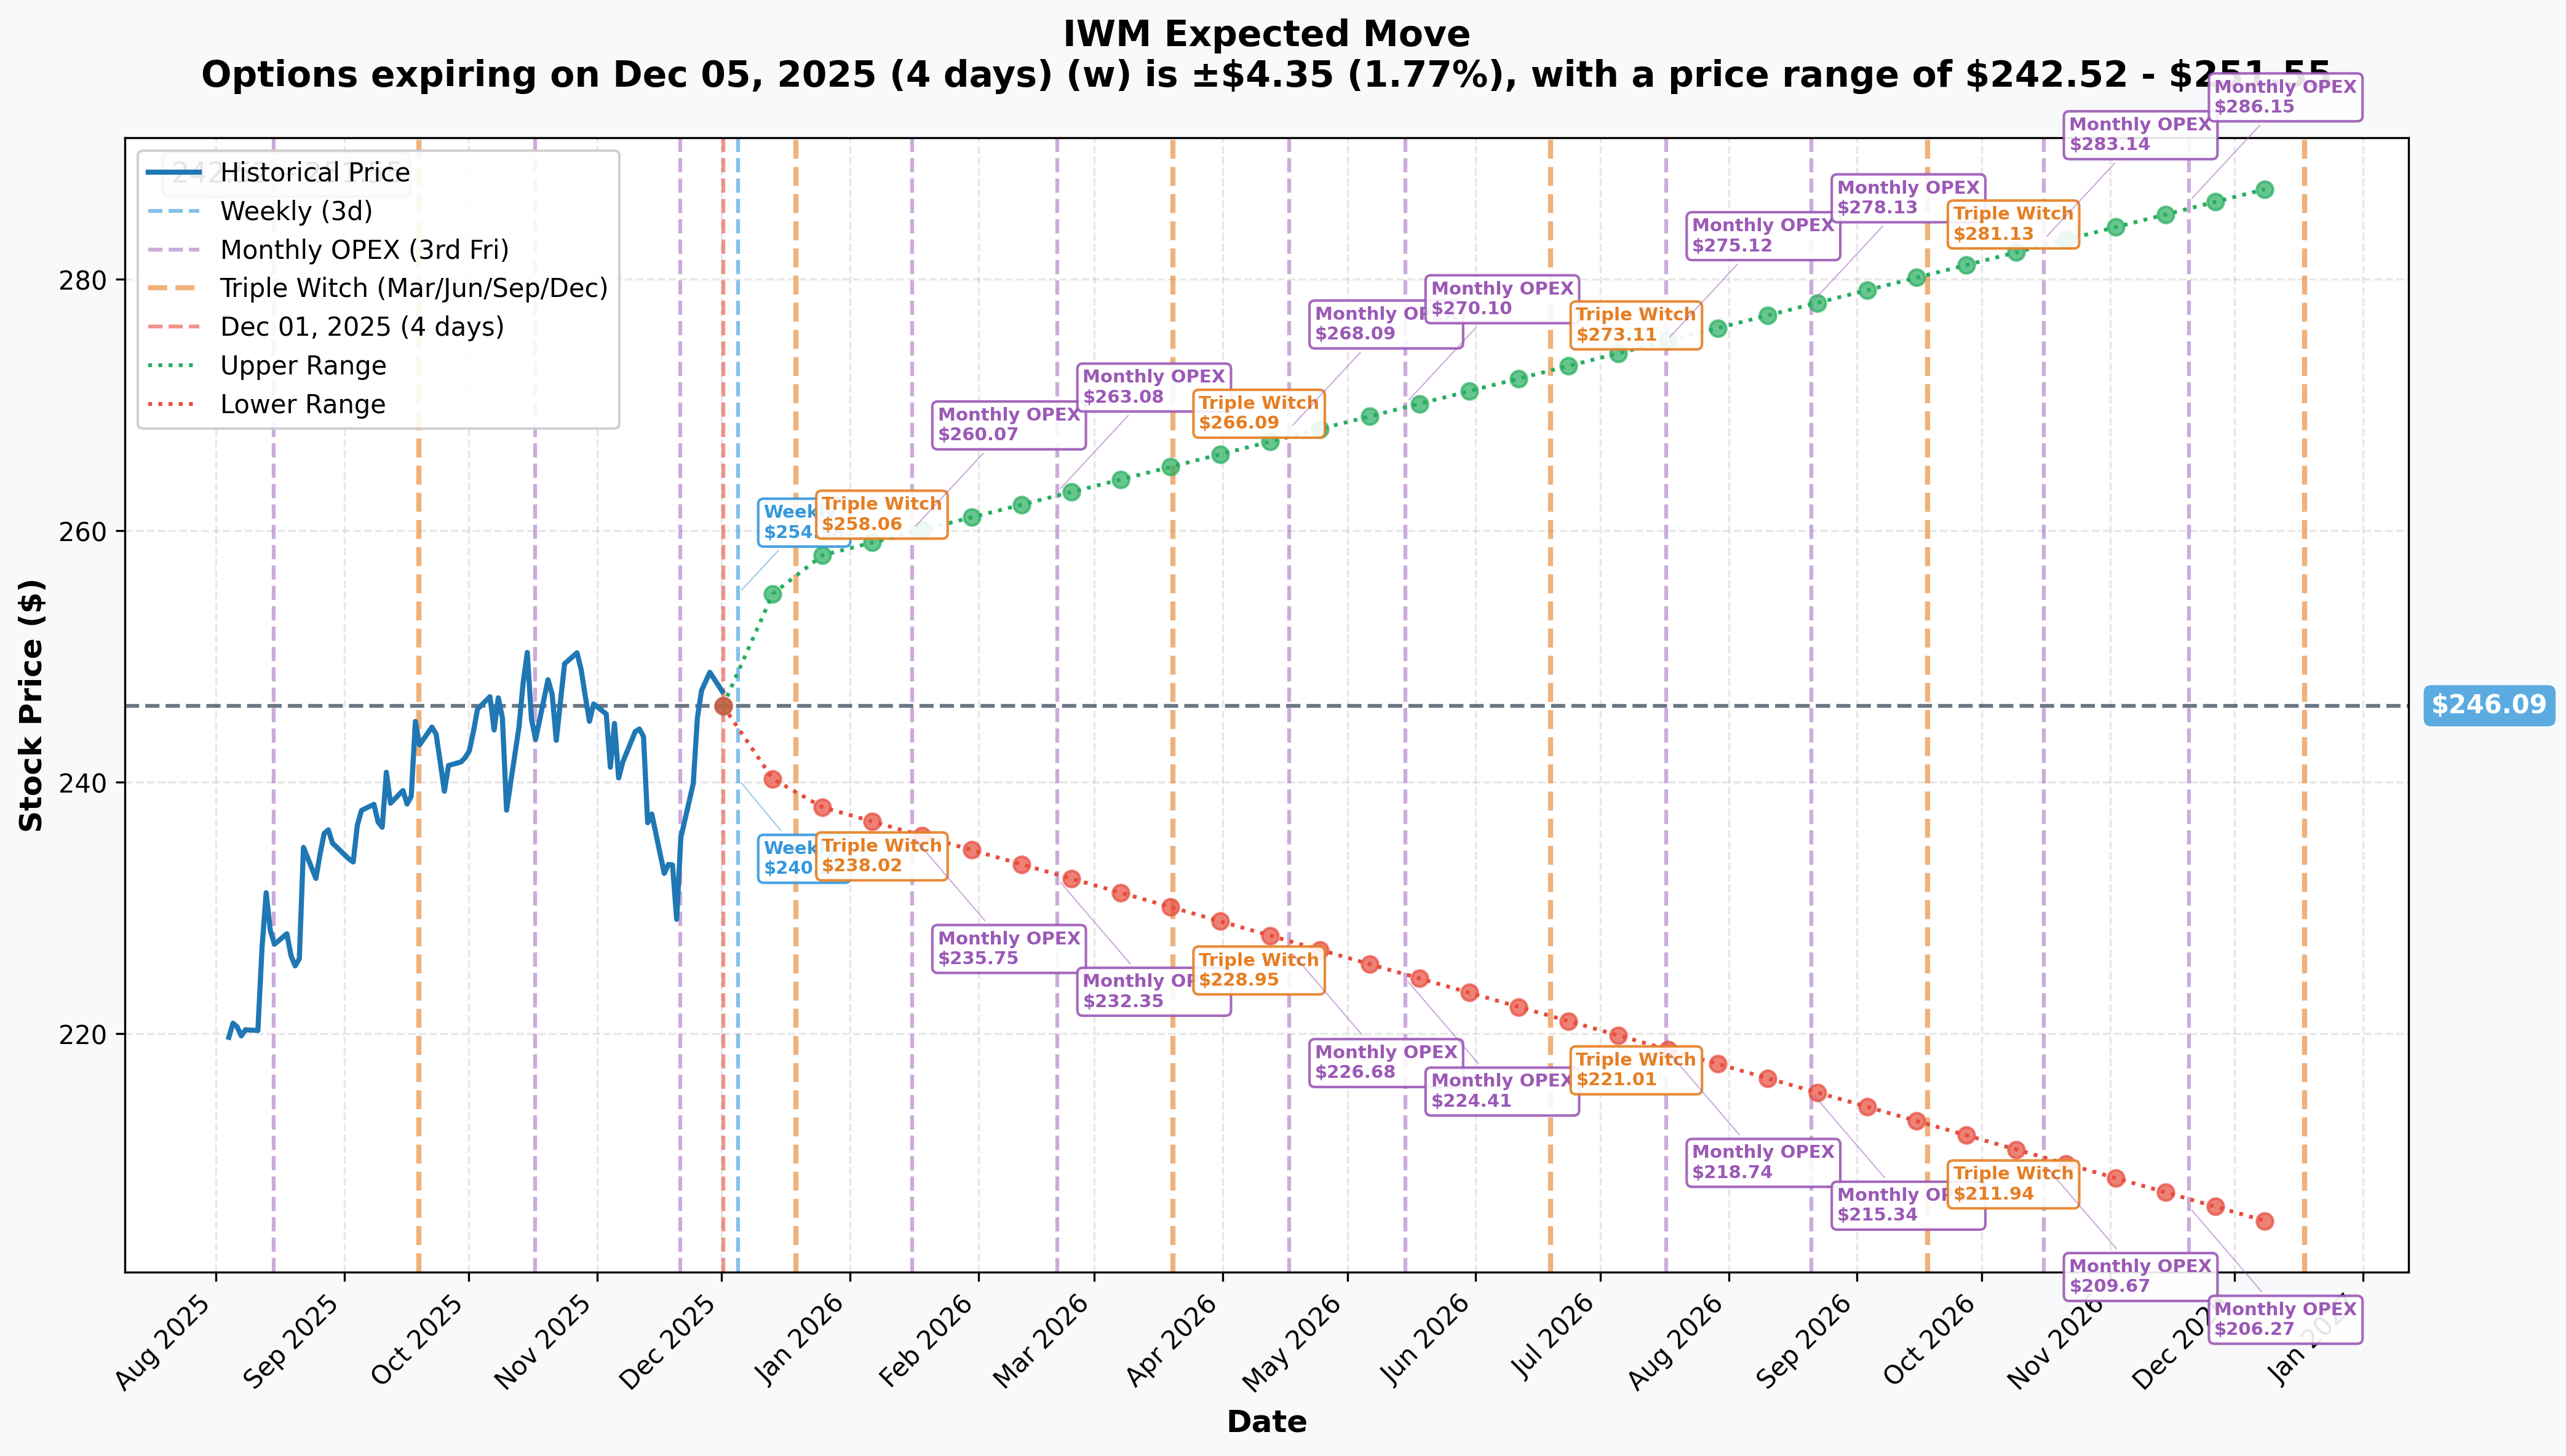
Options market pricing for upcoming expirations:
- 📅 Weekly (Dec 5 - 4 days): ±$4.35 (±1.77%) → Range: $242.52 - $251.55
- 📅 Monthly OPEX (Dec 19 - 18 days - THIS TRADE CLOSES!): ±$8.82 (±3.58%) → Range: $238.59 - $257.56
- 📅 Quarterly Triple Witch (Dec 19 - same): ±$8.82 (±3.58%) → Range: $238.59 - $257.56
- 📅 February OPEX (Feb 20 - 80 days - THE NEW TRADE!): Approximate ±$18-22 (~7-9%) → Range: ~$228-270
Translation for regular folks: Options traders are pricing in a modest 1.8% move ($4) by Friday for the weekly expiration, but a MUCH LARGER 3.6% move ($9) through December 19th - the month that includes the critical December 16 jobs report and December 18 FOMC meeting. The market expects fireworks around these economic events!
The December range upper bound of $257.56 aligns closely with the December calls that were closed ($255 strike) - suggesting the trader who exited knew the December implied move tops out around $257, but the February range could extend toward $260-270 if multiple positive catalysts stack up:
- December FOMC delivers 25 bps cut (or dovish hold)
- November jobs report shows soft landing (not too hot, not too cold)
- Q4 earnings season shows small-cap profit growth accelerating
- Rotation from large-cap tech into small-cap value continues
Key insight: The sharp increase in implied volatility from 1.77% (weekly) to 3.58% (monthly) reflects massive binary event risk around the December 16-18 catalyst cluster. Smart money is positioning for explosive volatility - either a breakout to new highs or a correction back to $240 support.
🎪 Catalysts
🔥 Immediate Catalysts (Next 21 Days) - THE CRITICAL WINDOW
December 16, 2025 - November Jobs Report (16 DAYS AWAY!) 📊
The Bureau of Labor Statistics Employment Situation Report for November releases Tuesday, December 16 at 8:30 AM ET - just TWO DAYS before the FOMC decision. This is THE most important jobs report of 2025 for small caps:
Why it matters SO MUCH:
- ⏰ First complete data since September: October data was lost due to 44-day government shutdown - this will be the first full employment snapshot in 2+ months
- 🎯 Fed decision driver: The December 18 FOMC meeting hinges heavily on this data (66% probability of no cut vs 33% cut)
- 📊 September baseline: Previous report showed 119,000 jobs added (beat expectations), but unemployment rose to 4.4% (highest since October 2021)
- 🔄 August revision shock: August was revised from +22,000 to -4,000 (negative!), revealing underlying weakness
Key metrics to watch:
- Non-farm payrolls: Consensus estimates unavailable due to data gap, but likely expecting 80-120k range
- Unemployment rate: Currently 4.4% - any move to 4.5%+ increases recession fears
- Average hourly earnings: Wage growth data critical for Fed inflation assessment
- Labor force participation: Shows if workers are returning to job market
Small-cap sensitivity channels:
-
💰 Consumer spending lifeline: Small caps derive 79% of revenue domestically vs 60-70% for S&P 500. If unemployment rises, consumer spending weakens, directly hitting small-cap revenues
-
🏦 Credit conditions: Weakening labor markets trigger bank lending caution. Small caps face tighter credit standards first - they have higher debt/asset ratios and below investment-grade credit quality
-
📈 Fed policy influence: Strong jobs = Fed likely holds rates (bearish for IWM). Weak jobs = Cut probability increases (bullish for IWM)
-
🏭 Sector exposure: Industrials (19% of Russell 2000) and Financials (18%) are highly employment-sensitive sectors
Potential scenarios for December 16 release:
✅ Upside surprise (>150k jobs): Could eliminate December cut probability entirely. IWM likely drops 2-4% on Fed pause expectations. Would pressure the February call position.
🎯 In-line (80-120k range): Maintains current 33% cut probability. IWM likely trades sideways to slightly up. Neutral for positioning.
🚀 Downside surprise (<60k or unemployment spikes to 4.6%+): Dramatically increases cut probability to 60-70%+. IWM could rally 3-5% on increased easing expectations. Very bullish for call position.
FOMC Meeting - December 17-18, 2025 (17-18 DAYS AWAY!) 🏦
The Federal Open Market Committee policy decision and press conference represents the MOST CRITICAL event for small caps this quarter:
Event timeline:
- 📅 Policy announcement: Wednesday, December 18 at ~2:00 PM ET
- 🎤 Jerome Powell press conference: December 18 at ~2:30 PM ET
- 📊 November CPI data: Releases SAME MORNING (December 18 at 8:30 AM) - will influence decision!
Current consensus (as of late November):
- 66% probability: Rates held unchanged at 3.75-4.00%
- 33% probability: 25 basis point cut to 3.50-3.75%
- Fed messaging: Powell stated December cut is "not a foregone conclusion"
- FOMC minutes showed: "Many" members expressed skepticism about further 2025 cuts
What drives the decision:
- ✅ November jobs report (Dec 16) - Released 2 days before decision
- 📊 November CPI (Dec 18 morning) - Same-day inflation data
- 🏛️ Government shutdown impact - Assessment of Q4 GDP drag (~0.5%)
- 💸 Tariff-related inflation pressures - Cost pass-through analysis
Small-cap impact scenarios:
🚀 SCENARIO 1: 25 bps Cut (33% probability) - BEST CASE
- IWM reaction: Likely +4-6% rally immediately
- Why bullish: Each rate cut directly reduces borrowing costs for leveraged small caps
- February call impact: Very bullish - would push IWM toward $255-260 target range
- Follow-through: Markets would price in 2-3 more cuts in 2026, further supporting small caps
😐 SCENARIO 2: Hold with Dovish Tone (40% probability) - NEUTRAL
- IWM reaction: -1% to +2% (depends on Powell's tone)
- Key factor: If Fed emphasizes "data-dependent" and signals January cut likely, IWM holds up
- February call impact: Neutral to slightly positive - keeps rotation hopes alive
- Follow-through: Pushes rate cut expectations into Q1 2026
😰 SCENARIO 3: Hold with Hawkish Tone (25% probability) - BEARISH
- IWM reaction: -4-7% selloff likely
- Trigger: If Powell suggests "prolonged pause" or "rates staying higher for longer"
- February call impact: Bearish - would need strong Q4 earnings to offset Fed disappointment
- Follow-through: Could reverse small-cap rotation thesis entirely
Historical context: Small caps have historically rallied 15-25% in the 12 months following the initiation of Fed rate-cutting cycles (September 2025 first cut). The key is whether cuts continue (bullish) or pause prematurely (bearish). According to Hartford Funds research, interrupted cutting cycles typically lead to small-cap underperformance.
Why this meeting is make-or-break for the February $260 call trade:
- ⏰ Decision comes just 18 days into 81-day position - sets the tone immediately
- 📊 A cut or dovish hold could trigger IWM breakout above $252.77 resistance toward $260 target
- 😰 A hawkish hold could send IWM back to $240-243 support, making $260 target unreachable
- 💰 The $6.5M bet essentially rides on Fed delivering AT LEAST a friendly tone, if not an actual cut
November CPI Report - December 18, 2025 MORNING (Same Day as FOMC!) 📊
Originally scheduled for December 10, the November CPI report was rescheduled to December 18 at 8:30 AM - the SAME MORNING as the FOMC decision. This creates a triple catalyst cluster:
- Jobs data (Dec 16)
- Inflation data (Dec 18 morning)
- Fed decision (Dec 18 afternoon)
Impact on Fed decision-making:
- 🚨 Fed will make policy decision with incomplete inflation data (October CPI canceled entirely)
- 📊 If November CPI shows reacceleration (above 3.0% YoY), likely cements decision to pause cuts
- ✅ If November CPI shows cooling (2.5-2.8% range), revives cut probability significantly
- ⚖️ Core CPI (ex-food/energy) matters most to Fed - watch for any uptick from tariff pass-through effects
Small-cap double bind with inflation:
- High inflation (>3.5%) → Fed maintains restrictive policy → Higher borrowing costs hurt leveraged small caps
- Deflation/recession (<2%) → Demand destruction → Revenue pressure on economically-sensitive small caps
- "Goldilocks" (2.5-3%) → OPTIMAL scenario allowing continued rate cuts without recession
According to CNBC reporting, the Fed's lack of October data creates unusual uncertainty heading into this decision.
🚀 Near-Term Catalysts (Q4 2025 - Q1 2026)
Q4 2025 Small-Cap Earnings Season - January/February 2026 📊
Most Russell 2000 companies report Q4 2025 results throughout February 2026 (conveniently aligning with the February 20 option expiration!):
Earnings growth projections are EXTREMELY aggressive:
For 2025 (Full Year):
- S&P SmallCap 600: +20.9% EPS growth (CFRA estimate) OR +8% (alternative estimate)
- Russell 2000: Positive acceleration from 2024's -8.0% decline
For 2026:
- S&P SmallCap 600: +18.6% to +21.2% EPS growth
- Russell 2000: +59% (Goldman Sachs projection in rate-cutting environment)
Critical context behind these numbers:
- 🚨 35-43% of Russell 2000 companies currently UNPROFITABLE vs much lower for large caps
- 💡 As unprofitable firms stabilize and interest costs decline, earnings growth expected to accelerate
- 📊 Consensus EPS estimates for Russell 2000 are "considerably higher" than Russell 1000 for 2025-2026
- ⚖️ These projections assume 2-3 Fed rate cuts materialize through 2026
Key metrics to watch during earnings season:
- Margin performance: Currently ~6.5% for small caps vs ~13% for large caps - any expansion bullish
- Revenue growth: Domestic demand indicators (79% revenue from U.S.)
- Interest expense as % of operating income: Shows rate sensitivity in action
- 2026 guidance: Particularly around tariff cost pass-through (small caps can only pass 54% vs 65% for large caps)
Why this matters for the February call trade: The February 20 expiration was deliberately chosen to capture Q4 earnings season. If small-cap earnings deliver even HALF of the projected 20-59% growth, IWM could surge toward $260-270 range. However, if earnings disappoint these elevated expectations (which assume perfect Fed policy and no recession), the pullback could be severe.
Debt Refinancing Cycle - Ongoing Through 2026 💰
Small-cap companies face a significant debt refinancing wall through 2025-2029, creating both risk and opportunity:
The challenge:
- 📊 Larger share of small-cap debt maturing in next 4 years vs large caps
- 💸 Companies that borrowed at 2-3% (2019-2021) now refinancing at 6-8%+
- 🏦 Average Russell 2000 credit quality: Below investment grade vs BBB+ for S&P 500
The opportunity:
- ✅ Fed already cut rates from 4.75-5.00% peak to 3.75-4.00% currently (100 bps relief)
- 📈 Each additional 25 bps cut improves refinancing terms immediately for floating-rate borrowers
- 🎯 If Fed continues cutting into 2026 (market expects 2-3 more cuts), refinancing conditions improve sequentially each quarter
Impact on small-cap profitability: Goldman Sachs projects that Fed rate cuts could fuel 22% earnings growth for small caps in 2025 and 42% in 2026, with interest expense reduction being a primary driver alongside revenue growth. This is the "hidden catalyst" that many investors underestimate - lower rates directly boost small-cap earnings through the income statement.
📊 Medium-Term Catalysts (Q2-Q3 2026)
Russell Reconstitution - June 26, 2026 📋
The annual FTSE Russell reconstitution (typically final Friday in June) creates substantial trading volume as passive funds rebalance:
What happens:
- 🔄 Company rankings determined in May 2026 ("Rank Day")
- 📊 Companies moving into/out of Russell 2000 experience significant volatility
- 💰 Passive funds tracking index must buy/sell to match new composition
- 🎯 Can create ~$X billion in forced buying/selling over 2-3 week period
2026 implications: As of August 2025 reconstitution, Russell 2000 showed balanced sector exposure. The June 2026 reconstitution could see meaningful changes if:
- Small-cap outperformance continues (companies graduating to Russell 1000)
- Defense, AI-adjacent, and gold mining sectors maintain strength
- Unprofitable companies achieve profitability (re-ratings)
Trading opportunity: Historically, stocks being added to Russell 2000 rally 5-8% in the weeks surrounding reconstitution due to forced index buying. This creates tactical opportunities but is beyond the February call expiration window.
🎲 Price Targets & Probabilities
Using implied move data, technical levels, and upcoming catalysts, here are scenarios through February 20th expiration:
📈 Bull Case (40% probability)
Target: $260-270 (CALL STRIKE TO BREAKOUT!)
How we get there:
- 🚀 December FOMC delivers: Either 25 bps cut OR dovish hold signaling January 2026 cut
- 📊 November jobs report "Goldilocks": 80-120k payrolls (not too hot/cold), unemployment stable at 4.4%
- ✅ November CPI cools: Comes in at 2.6-2.8% YoY, supporting continued Fed easing path
- 💪 IWM breaks $252.77 resistance: Technical breakout above 52-week high triggers momentum buying
- 📈 Q4 earnings season delivers: Small caps show 10-15%+ EPS growth (even half of projections), validating rotation thesis
- 🔄 Large-cap to small-cap rotation accelerates: Investors sell Magnificent 7 gains, redeploy to undervalued Russell 2000
- 🏦 Credit conditions improve: Banks increase small business lending as Fed cuts progress
- 💰 Interest expense drops: Lower rates boost small-cap profitability through lower borrowing costs
Path to $260:
- December 18 FOMC provides positive catalyst → IWM rallies to $253-255
- Year-end rally (seasonal tailwind) → IWM pushes to $257-260 by year-end
- Strong Q4 earnings in February → IWM tests $265-270
What the call buyer needs:
- IWM above $260 at expiration = Profitable (breakeven ~$260 + $46.43 premium = ~$306.43 per contract)
- IWM at $270 at expiration = $10 intrinsic value = ~$1,000 profit per contract × 14,000 = $14M profit!
- IWM at $265 at expiration = $5 intrinsic value = ~$500 profit per contract × 14,000 = $7M profit
Probability assessment: 40% because it requires multiple positive catalysts aligning (Fed friendly, jobs Goldilocks, earnings deliver). However, the 16% valuation discount for small caps and historical post-rate-cut performance support this scenario. The call buyer clearly believes odds are closer to 50%+ or they wouldn't deploy $6.5M.
🎯 Base Case (45% probability)
Target: $245-255 range (CONSOLIDATION)
Most likely scenario:
- ⚖️ December FOMC delivers mixed message: Holds rates but keeps door open for January/March cuts
- 📊 Jobs/inflation data mixed: Neither perfect nor disastrous - maintains uncertainty
- 🔄 IWM trades in range: Bounces between $243 support and $252.77 resistance for weeks
- 📈 Earnings season solid but not spectacular: Small caps deliver 8-12% growth (below projections)
- 💤 Rotation stalls: Neither accelerates nor reverses - market digests massive 2025 gains
- 🎢 Volatility decays: IV crush after December events reduces option premiums
- ⏰ Waiting for more data: Institutional investors wait for Q1 2026 data before committing more capital
Trading dynamics:
- Support at $243 (former resistance) holds multiple tests
- Resistance at $252.77 (all-time high) rejects multiple breakout attempts
- Gamma positioning keeps price range-bound (though current gamma data unavailable)
- Volume declines during holiday period (Dec 23-Jan 2) reduces momentum
What happens to the February call:
- IWM at $250 at expiration = Out-of-the-money = $0 intrinsic value = -$6.5M loss (100%)
- IWM at $255 at expiration = Still OTM = $0 value = -$6.5M loss (100%)
- Time decay erodes premium from $46.43 to near-zero even if IWM trades sideways
This is actually the WORST scenario for call buyers - not dramatic crash (at least you cut losses), but slow grind sideways below strike that bleeds time value to zero.
Probability assessment: 45% because small caps at technical inflection point. Neither clearly breaking out nor breaking down. Could easily consolidate 6-8 weeks while market awaits more catalysts. Current valuation (16% discount) prevents major selloff, but stretched short-term technicals prevent explosive rally.
📉 Bear Case (15% probability)
Target: $230-243 (TEST SUPPORT LEVELS)
What could go wrong:
- 😰 December FOMC hawks up: Powell signals "prolonged pause" or "rates higher for longer"
- 📊 Jobs report too hot: 180k+ payrolls + wage growth reacceleration → Fed concerns about inflation persistence
- 🚨 November CPI spikes: Comes in at 3.2%+ YoY due to tariff pass-through → Kills rate cut hopes
- 💸 Broader market selloff: Magnificent 7 correction drags entire market lower (small caps higher beta = amplified decline)
- 📉 Recession fears resurface: If unemployment spikes to 4.7%+ or GDP data disappoints, risk-off hits cyclicals hard
- 🇨🇳 Geopolitical shock: China tensions, tariff escalation, or unexpected global crisis
- 💔 Q4 earnings disappoint: Small caps deliver flat to negative EPS growth, revealing 20-59% projections were fantasy
- 🔨 Break below $243 support: Technical breakdown triggers cascade selling toward $232-235 range
Critical support levels to watch:
- 🛡️ $243: Former resistance turned support - MUST HOLD or momentum shifts bearish
- 🛡️ $240: Psychological level and secondary floor
- 🛡️ $234.54: 50-day moving average - dynamic support
- 🛡️ $232.95: 90-day probability range low - statistical floor
Bear case path:
- December 18 FOMC disappoints → IWM drops 3-5% to $236-240
- Risk-off sentiment persists → Tests $232-234 support
- Weak Q4 earnings confirm slowdown → Drops to $225-230
What happens to call position:
- IWM at $235 at expiration = Out-of-the-money = $0 value = -$6.5M loss (100%)
- No matter how low IWM goes, max loss is $6.5M (premium paid)
- Could cut losses early if bearish thesis becomes clear (sell for $10-20/contract in January)
Probability assessment: Only 15% because small-cap fundamentals remain solid (16% valuation discount, Fed already cutting, earnings growth inflection starting). Would require multiple negative catalysts to align simultaneously. More likely to see consolidation than crash.
However, the risk/reward is asymmetric - in base/bear case, call buyer loses entire $6.5M premium. Only bull case generates profits. This is why aggressive call buying into all-time highs is risky even with positive thesis.
💡 Trading Ideas
🛡️ Conservative: Let the December Fog Clear
Play: Stay in cash until after December 16-18 catalyst cluster resolves
Why this works:
- 🎰 Triple catalyst risk: Jobs (Dec 16) + CPI (Dec 18 morning) + FOMC (Dec 18 afternoon) = enormous binary event risk
- 📊 Implied move of 3.6% through Dec 19 is HUGE for an ETF - could swing $9 in either direction
- 💸 Options extremely expensive: IV elevated pre-December events - premiums will crush 40-50% post-events
- 🤔 Smart money split: While this trader bought calls, we also saw $2.1M in December calls being CLOSED (profit-taking)
- ⏰ Better entry likely: Post-event pullback or consolidation offers better risk/reward than chasing near all-time highs
- 📈 IWM at $248.75 is just 1.6% from 52-week high - limited upside, meaningful downside if Fed/jobs disappoint
Action plan:
- 👀 Watch December 16-18 closely: Take notes on Fed tone, jobs trajectory, inflation readings
- 🎯 Target entry on pullback: Look for $240-243 support test post-events (8-10% margin of safety)
- ✅ Require positive Fed signal: Only enter if Powell keeps door open for Q1 2026 cuts
- 📊 Monitor rotation flows: Track unusual options activity - if institutions ADD more calls in January, join them
- ⏰ Re-evaluate mid-January: With December volatility behind us, Q4 earnings setup provides next catalyst
Risk level: Minimal (cash position) | Skill level: Beginner-friendly
Expected outcome: Avoid potential 5-8% drawdown if Fed disappoints. Get better entry if consolidation occurs. Maintain optionality while preserving capital.
⚖️ Balanced: Post-Event Defined-Risk Call Spread (Copy The Setup)
Play: After December events settle, mimic institutional positioning with defined-risk call spread
Structure: Buy February $255 calls, Sell February $265 calls (February 20 expiration - SAME as institutional trade!)
Why this works:
- 📉 IV crush after December: Options much cheaper after volatility drops from elevated levels
- 🎯 Defined risk: Spread width = $10 = $1,000 max risk per spread (vs $6.5M outright call buy!)
- 🤝 Copying smart money direction: Aligns with institutional bullish thesis but at retail-friendly size
- ⚖️ Risk/reward favorable: Target $6-7 profit on $3-4 debit = 1.5:1 to 2:1 ratio
- 🛡️ Gives room to work: Buying $255 vs $260 means IWM only needs to reach 52-week high ($252.77) then add 1% to be in-the-money
- ⏰ 70+ days to expiration: Plenty of time for Q4 earnings catalyst and continued rotation
Estimated P&L (post-December IV crush):
- 💰 Entry cost: ~$3.00-4.00 net debit per spread (vs $7-8 now with high IV)
- 📈 Max profit: $6.00-7.00 if IWM above $265 at February expiration
- 📉 Max loss: $3.00-4.00 if IWM below $255 (defined and limited)
- 🎯 Breakeven: ~$258-259
- 📊 Risk/Reward: ~1.5:1 to 2:1 (very favorable for defined-risk trade)
Entry timing requirements:
- ⏰ Wait 2-3 days post-FOMC (by Dec 20-23) for full IV collapse and year-end positioning
- ✅ Only enter if Fed was neutral-to-bullish (cut OR friendly hold keeping Q1 2026 cuts alive)
- 🎯 Require IWM trading $246-252 range (gives room to rally into strikes)
- ❌ Skip if IWM already above $257 (too close to short call strike, limited profit potential)
Position sizing: Risk 3-5% of portfolio maximum (this is directional speculation on small-cap rotation)
Exit strategy:
- 🎯 Take profits at 100% gain ($6-7 on $3-4 debit) - don't get greedy!
- ⏰ Exit by Feb 10 if still open (10 days before expiry) to avoid gamma risk
- 🛡️ Cut losses at 50% ($1.50-2.00 value remaining) if thesis breaks
Risk level: Moderate (defined risk, directional) | Skill level: Intermediate
🚀 Aggressive: Direct Call Replication (Follow The Whale!)
Play: Directly replicate institutional positioning at smaller scale (for experienced traders ONLY)
Structure: Buy February $260 calls outright (same strike/expiration as $6.5M institutional trade)
Why this could work:
- 🐋 Following smart money: Institutions with billion-dollar portfolios clearly see 40%+ probability of $260+ by February
- 💰 Leveraged upside: Each $1 IWM moves above $260 = ~$100 per contract profit
- 📊 Captures full Q4 earnings season: February expiration positioned perfectly for small-cap profit reports
- 🎯 Defined risk: Can only lose premium paid (unlike short puts/naked calls)
- 🚀 Home run potential: If small-cap rotation accelerates, IWM to $270-280 generates 100-200% returns
- ⚖️ Thesis has merit: 16% valuation discount, Fed cutting, earnings growth inflection, rotation thesis all valid
Why this could blow up (SERIOUS RISKS):
- 💸 EXPENSIVE PREMIUM: Each contract costs $46-50 post-December (~$4,600-5,000 per contract!)
- ⏰ Time decay killer: Theta burns -$20-30 per day per contract in final month
- 🎢 Needs 4.5%+ rally: IWM must move from $248.75 to $260+ just to breakeven after premium
- 😰 Total loss risk: If IWM ends below $260 at expiration, lose ENTIRE premium (100% loss)
- 🎰 All-or-nothing trade: Unlike spreads with partial profits, this either works big or fails completely
- 📉 December events could kill thesis: If Fed hawks up or jobs too hot, rotation thesis dies immediately
Estimated P&L (entering post-December):
- 💰 Cost: ~$46-50 per call contract
- 🎯 Breakeven: ~$306-310 per contract (IWM needs to reach $260 + premium paid = effectively $260-262 stock price)
- 📈 Profit at $265: ~$5 intrinsic value = $500 per contract (10% ROI)
- 🚀 Profit at $270: ~$10 intrinsic value = $1,000 per contract (100% ROI!)
- 💥 Home run at $280: ~$20 intrinsic value = $2,000 per contract (300%+ ROI!)
- 💀 Loss if below $260: Lose entire $4,600-5,000 premium (100% loss)
Position sizing - CRITICAL:
- ⚠️ Risk ONLY what you can afford to lose completely
- 💰 Max 2-3% of total portfolio on this single trade
- 🎯 Consider starting with 1-2 contracts to test positioning (~$9,000-10,000 risk)
- 📊 Scale up ONLY if December catalysts confirm bullish thesis
Entry timing:
- ⏰ Wait for post-FOMC clarity (Dec 19-20)
- ✅ ONLY enter if Fed delivered cut OR dovish hold
- ❌ DO NOT enter if Fed was hawkish (thesis broken)
- 🎯 Best entry: Pullback to $244-247 after December events (buy weakness, not strength)
Exit strategy:
- 🎯 Take profits at 50-75% if IWM reaches $265-268 by late January (don't wait for $270)
- ⏰ Exit by Feb 10 if still holding to avoid final week gamma/theta decay
- 🛡️ Cut losses at 40-50% loss if IWM trading below $245 in mid-January (thesis failing)
- ❌ Never hold to expiration - always close or roll before expiry week
CRITICAL WARNING - DO NOT attempt unless you:
- ✅ Have traded options for 2+ years with real money
- ✅ Understand time decay mechanics and can watch position daily
- ✅ Can afford to lose 100% of premium without lifestyle impact
- ✅ Have studied Fed policy impacts on small caps extensively
- ✅ Won't panic sell on normal -2-3% IWM daily moves
- ✅ Accept that even if RIGHT on direction, timing could still cause loss
Risk level: EXTREME (100% loss possible) | Skill level: Advanced only
Probability of profit: ~35-40% (need 4.5% rally + timing to work perfectly)
⚠️ Risk Factors
Don't get caught by these potential landmines:
December Catalyst Cluster (HIGHEST RISK) 🎯
The December 16-18 window represents the most volatile period for small caps in Q4 2025:
-
⏰ Jobs report December 16: First complete employment data in 2+ months post-government shutdown. Unemployment at 4.4% and rising - any spike to 4.6%+ triggers recession fears. Previous August data was revised from +22,000 to -4,000 (NEGATIVE), showing hidden weakness. Could swing IWM ±3-5% in minutes.
-
📊 CPI report December 18 morning: Rescheduled from Dec 10, releases same day as FOMC. If November CPI spikes above 3.0% due to tariff pass-through, kills rate cut hopes instantly. Small caps have limited pricing power (pass through only 54% of cost increases vs 65% for large caps) making them vulnerable to margin compression.
-
🏦 FOMC decision December 18 afternoon: Currently 66% probability of hold vs 33% cut. October FOMC minutes showed "many" members skeptical of further 2025 cuts. If Powell signals "prolonged pause" or "higher for longer," small caps could crater 6-10% in single session. Historical precedent: IWM fell 4.5% in one day when Fed paused in 2023.
Combined impact: These three events in 48-hour window create binary outcome - either small-cap rotation accelerates dramatically OR reverses violently. The 3.6% implied move through December 19 is HUGE for an ETF.
Interest Rate Pause Risk (CRITICAL) 💸
Primary threat: Fed pauses rate cuts longer than market expects
Small caps are FAR more interest rate sensitive than large caps due to structural factors:
- 🏦 Higher debt/asset ratios: Russell 2000 companies more leveraged on average
- 💳 Floating rate exposure: Many small-cap loans tied to Fed funds, immediately affected by rate changes
- 📊 Below investment-grade credit: Average Russell 2000 credit quality below investment grade vs BBB+ for S&P 500
- 💰 Lower coverage ratios: Earnings before interest / interest expense ratio much lower (less buffer)
Why this matters NOW:
- Each quarter of delayed cuts = ~3-5% IWM underperformance vs expectations
- Debt refinancing wall 2025-2029 means companies need lower rates to refinance maturing debt
- If Fed stops at 3.75% instead of cutting to 3.00-3.25% as markets expect, small-cap earnings projections (20-59% growth) become fantasy
- Could trigger de-rating from 16% discount to 25-30% discount to fair value
Transmission mechanism: Fed pause → Long-term rates stay elevated → Bank lending standards tighten → Small business credit crunch → Revenue/margin pressure → Earnings miss → Stock selloff
Recession Risk (MODERATE-HIGH) 😰
Current probability: 40% over next 12 months (EY forecast)
Small caps are MORE vulnerable in recessions than large caps:
- 📉 Operating leverage: Lower profit margins (6.5% vs 13% for large caps) amplify revenue declines
- 🏦 Credit dependence: Bank lending freezes during recessions hit small caps first
- 🏭 Cyclical exposure: Industrials (19%) and Financials (18%) are recession-sensitive sectors
- 💔 Profitability crisis: 35-43% of Russell 2000 currently unprofitable - vulnerable to demand shocks
Leading recession indicators currently flashing:
- ⚠️ Unemployment 4.4% and rising (from 3.5% low) → Labor market weakening
- ⚠️ Yield curve recently un-inverted → Historically precedes recession 6-12 months later
- ⚠️ Payroll growth collapsed to 30k/month (April-August 2025) from 168k average in 2024
- ⚠️ 44-day government shutdown shaved ~0.5% off Q4 GDP
Historical precedent:
- Average IWM drawdown in recessions: -23.38% over 18.9 months (vs -18.17% for large caps)
- 2022 bear market: IWM fell -33% peak-to-trough
- 2020 COVID: IWM fell -41% in 5 weeks
Impact on February call trade: If recession becomes clear in January 2026, IWM could easily drop to $220-230 range, making $260 calls worthless.
Aggressive Earnings Expectations (HIGH RISK) 📊
The problem: Consensus projects 20-59% small-cap earnings growth for 2025-2026. These numbers are EXTREMELY aggressive:
Reality check factors:
- 🚨 35-43% unprofitable: Hard to get 59% EPS growth when over a third of companies lose money
- ⚖️ Margin compression: Tariffs hitting small caps harder (54% pass-through vs 65% for large caps), with 6.5% margins there's no buffer
- 💸 Revenue deceleration: Consumer spending shows weakness (unemployment 4.4% and rising)
- 🏦 Interest expense wildly optimistic: Projections assume Fed cuts to 3.00% by mid-2026 - if Fed pauses, interest costs stay elevated
- 📉 Comps getting harder: After 115% rally in many small caps, earnings must accelerate just to maintain valuations
Probability of disappointment: 30-35% that earnings come in at <10% growth vs 20%+ consensus
Impact if earnings miss:
- Immediate -10-15% IWM decline as market reprices growth assumptions
- Valuation multiple compression from current "16% discount" to 25-30% discount
- Could send IWM from $250 to $220-225 in matter of days
Q4 earnings season (Feb 2026) is make-or-break for the call trade thesis. If first wave of reports disappoint, entire small-cap rotation narrative could unwind.
Mega-Cap Competition (THE ALTERNATIVE SCENARIO) 🏆
What if large-cap leadership DOESN'T end?
The current 14-year large-cap dominance cycle (2011-2025) vs 11-year historical average suggests rotation is "overdue." But cycles can extend:
Evidence mega-caps could stay dominant:
- 🤖 AI buildout accelerating: If AI infrastructure spending exceeds expectations, Magnificent 7 earnings could REACCELERATE (not decelerate as consensus expects)
- 💪 Quality spread extreme: Profitability gap between large caps and small caps (43% unprofitable) has never been wider
- 💰 Balance sheet advantage: Large caps have fortress balance sheets, small caps are leveraged and vulnerable
- 🌍 International exposure: Large caps can offset U.S. weakness with international growth; small caps are 79% domestic-only
- 📊 Margin superiority: 13% margins vs 6.5% provides massive competitive moat
What triggers continued mega-cap dominance:
- Nvidia/AMD/hyperscalers continue explosive AI revenue growth
- Small-cap earnings disappoint while Magnificent 7 beat
- Recession emerges (quality outperforms in downturns)
- Fed stays restrictive longer (hurts leveraged small caps)
Probability: 30-35% chance mega-cap leadership extends through 2025-2026
Impact on IWM: Could underperform by 10-20% relative to S&P 500, potentially trapping the call buyer in range-bound $240-250 zone while NVDA/MSFT/META make new highs.
Tariff & Trade Policy Uncertainty 🇺🇸
Risk: Additional tariffs or trade policy changes create cost pressures
Tariffs implemented April 2, 2025 already showed differential impact:
Small-cap disadvantages:
- 💸 Limited pricing power: Small caps pass through only 54% of tariff costs vs 65% for large firms (Atlanta Fed survey)
- 📉 Thin margins: With 6.5% average margins, absorbing 2-3% cost increase = major earnings hit
- 🛠️ Supply chain inflexibility: Lack resources to quickly diversify suppliers or negotiate better terms
- 🇨🇳 Second-order effects: If tariffs slow U.S. GDP growth, domestically-focused (79% revenue) small caps feel full impact
New tariff risks:
- Additional tariffs announced on electronics, automotive parts, or industrial inputs
- Retaliatory tariffs from trading partners
- Policy uncertainty affecting business investment
Historical precedent: During April 2025 tariff announcement, small caps underperformed large caps by -7% in single week.
Technical Vulnerability Near All-Time Highs ⚠️
Current situation: IWM at $248.75 is just 1.6% below 52-week high of $252.77
Risks of buying near peaks:
- 📊 Limited margin of safety: If any negative catalyst emerges, drops 5-8% are swift
- 🎢 Resistance overhead: $252.77 has acted as ceiling multiple times - difficult to break
- 💤 Exhaustion risk: After 44.8% rally from April lows, technicals stretched
- 📉 Failed breakout scenario: If IWM tests $252.77 and gets rejected 2-3 times, triggers selling cascade
Volatility characteristics:
- Beta 1.3: IWM moves 30% more than S&P 500 in both directions
- Average drawdown: -23.38% lasting 18.9 months
- Annualized volatility: 61.9% - can move 3-5% on no news
Pattern risk: Investtech analysis shows IWM "broke through floor of rising trend channel" suggesting either:
- Slower rising rate ahead (consolidation)
- Transition to horizontal development (range-bound)
For an aggressive call buyer targeting $260, a multi-week consolidation at $245-252 would be PAINFUL (theta decay + no progress toward strike).
🎯 The Bottom Line
Real talk: An institutional trader just dropped $6.5 MILLION betting small caps rally 4.5%+ to $260 by February, while simultaneously closing $2.1M in shorter-term calls for profits. This isn't gambling - this is sophisticated positioning by professionals who manage hundreds of millions. They're clearly saying: "The short-term trade worked, now we're positioning for the BIGGER move ahead."
What this trade tells us:
🎯 Bullish conviction with BETTER timing:
- They SOLD December $255 calls (18 days out) because they expect volatility/uncertainty through December 16-18 catalyst cluster
- They BOUGHT February $260 calls (81 days out) because they expect small-cap rotation to ACCELERATE in Q1 2026
- This is rolling profits forward - a sign of confidence, not fear
📊 The thesis is clear:
- Small caps trading at 16% discount to fair value while large caps at 4% premium = 20-point valuation spread screaming "BUY"
- Fed delivered 100 bps of cuts already (from 4.75% to 3.75%) with 2-3 more expected in 2026
- Earnings growth projections of 20-59% for small caps vs decelerating 20% for Magnificent 7
- 14-year large-cap dominance cycle is 3 years beyond 11-year historical average - rotation "overdue"
- Q3 2025 small-cap outperformance (+12.4% vs +7.8% for large caps) showed the rotation is STARTING
⏰ But timing is EVERYTHING:
- They avoided holding through December 16-18 events (jobs/CPI/FOMC) by closing December calls
- They positioned for Q4 earnings season (January/February) with February expiration
- This suggests they expect December to be VOLATILE but ultimately set up Q1 2026 rally
If you own IWM or small-cap stocks:
- ✅ Hold your winners - the rotation thesis remains intact
- 🎯 Consider trimming 15-20% near $250-252 to lock in gains before December volatility
- ⏰ Watch December 16-18 closely - these events determine if you add/hold/sell
- 💪 If Fed delivers cut OR friendly hold, ADD on any dip to $243-245
- 🛡️ Set mental stop at $240 (former support) to protect if thesis breaks
If you're on the sidelines watching:
- ⏰ DO NOT chase at $248.75 near all-time highs with massive catalyst cluster 2 weeks away
- 📅 Mark your calendar: December 16-18 - this is when you'll get clarity AND better prices
- 🎯 Target entry: $240-245 pullback post-FOMC if Fed is neutral-to-friendly
- ✅ Look for confirmation: Fed dovish + Jobs Goldilocks (80-120k) + CPI cooling (2.6-2.8%)
- 🚀 Best long-term entry: $240-243 in January after December vol settles, ahead of Q4 earnings
If you trade options:
- 🛡️ Conservative: Wait for post-December IV crush to enter defined-risk spreads ($255/$265 call spread)
- ⚖️ Balanced: Consider small February $255 call position if/when IWM pulls back to $244-246 (lower strike than institution gives more safety)
- 🚀 Aggressive: Direct replication of February $260 calls ONLY if you're experienced and can afford 100% loss
Key dates to mark on your calendar:
- 📅 December 16 (Monday) 8:30 AM ET - November jobs report (CRITICAL!)
- 📅 December 18 (Wednesday) 8:30 AM ET - November CPI report
- 📅 December 18 (Wednesday) 2:00 PM ET - FOMC policy decision
- 📅 December 18 (Wednesday) 2:30 PM ET - Jerome Powell press conference
- 📅 December 19 (Thursday) - December monthly OPEX (when closed position expires)
- 📅 January 16, 2026 (Friday) - January monthly OPEX
- 📅 February 20, 2026 (Friday) - February monthly OPEX (when $6.5M call position expires)
- 📅 February 2026 (throughout month) - Q4 2025 small-cap earnings season
Final verdict: The $6.5M institutional bet on February $260 calls is a powerful bullish signal for small-cap rotation into Q1 2026. However, the simultaneous close of $2.1M December calls shows even smart money expects volatility and uncertainty through the December catalyst cluster.
The message is clear: Small-cap rotation is real, but it's a marathon not a sprint. Be patient. Let December sort itself out. The opportunity will still be there in January at better prices with less risk.
The professionals are positioning for a 6-8 week setup, not a 2-week lottery ticket. Follow their timing, not just their direction.
Don't chase. Let the trade come to you. 💪
Disclaimer: Options trading involves substantial risk of loss and is not suitable for all investors. This analysis is for educational purposes only and not financial advice. Past performance doesn't guarantee future results. The unusual activity identified reflects institutional positioning that may be part of complex hedging strategies not applicable to retail traders. The Z-score classifications (EXTREMELY UNUSUAL) reflect relative size vs recent history, not probability of success. December 16-18 binary catalyst events create significant volatility risk with potential for 5-10% moves in either direction. ETFs like IWM can experience rapid price changes. Small-cap stocks are more volatile than large caps (1.3 beta). Always do your own research and consider consulting a licensed financial advisor before trading. Never risk more than you can afford to lose, especially with options that can expire worthless.
About iShares Russell 2000 ETF (IWM): The iShares Russell 2000 ETF tracks the Russell 2000 Index, providing diversified exposure to 1,952 small-cap U.S. companies across all major sectors, with $72.48 billion in assets under management and a 0.19% expense ratio.