🎯 IWM $15.7M Bull Put Spread: Smart Money Bets on Small-Cap Support Above $236
📅 January 2, 2026 | 🔥 Major Premium Collection Strategy Detected
🎯 The Quick Take
Someone just collected over $1.1 million in premium selling a massive bull put spread on the iShares Russell 2000 ETF, betting that small caps hold above $236 through mid-February. With IWM trading at $248.78 and gamma support stacking up at $245, this isn't a moonshot bet - it's a calculated income play positioning for the "small-cap renaissance" Wall Street keeps talking about. The trader profits if IWM simply stays above $236 by February 20.
💰 The Option Flow Breakdown
📊 What Just Happened
A sophisticated trader executed a bull put spread at the 16:10:51 close on January 2, 2026:
| Leg | Action | Contract | Premium | Volume |
|---|---|---|---|---|
| Short Leg | SELL | IWM 2026-02-20 $236 PUT | $8.4M | 37,000 |
| Long Leg | BUY | IWM 2026-02-20 $234 PUT | $7.3M | 37,000 |
| Net Credit | - | Bull Put Spread | ~$1.1M | 37,000 |
🤓 What This Actually Means
Real talk: This is a premium collection strategy with defined risk. The trader:
✅ Collected $1.1M upfront by selling the $236 put and buying the $234 put for protection ✅ Keeps the full premium if IWM stays above $236 by February 20 ✅ Maximum risk capped at $2 per spread ($200 per contract) = $7.4M total if IWM crashes below $234 ✅ Breakeven: $234.70 (strike minus net credit received)
Translation for us regular folks: This trader is saying "I'm willing to bet $7.4M to make $1.1M (15% return in 49 days) that small caps don't crater below $236." That's the kind of trade you make when you're confident in near-term support levels but don't need massive upside - you just want steady income.
The timing is interesting: Executing this right at market close suggests this was deliberate positioning, not a panic move. They're planting their flag ahead of what could be a small-cap leadership year.
📈 YTD Chart Analysis
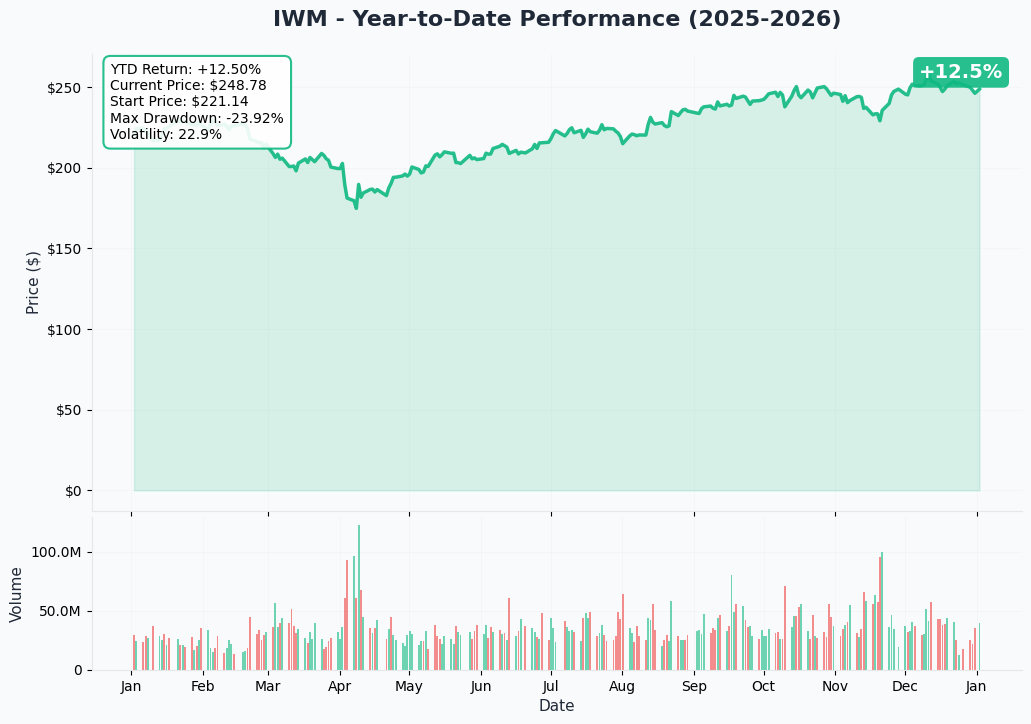
The chart tells a compelling story for 2025. IWM delivered 13.38% returns last year, outperforming many large-cap indices in the second half. The Russell 2000 broke out above the psychologically important 2,500 level in October, hit fresh all-time highs in December, and closed 2025 at $246.16.
What's notable: The recent rally has been grinding higher with conviction, not wild speculation. Small caps gained approximately 28% over the past six months through December, crushing the S&P 500's 23% return during the same period. This isn't a dead-cat bounce - it's institutional money rotating into value.
The current price of $248.78 sits comfortably above key support zones, and the YTD momentum suggests the "Great Rotation" into small caps that strategists have been predicting is actually happening.
🎪 Gamma-Based Support & Resistance Analysis
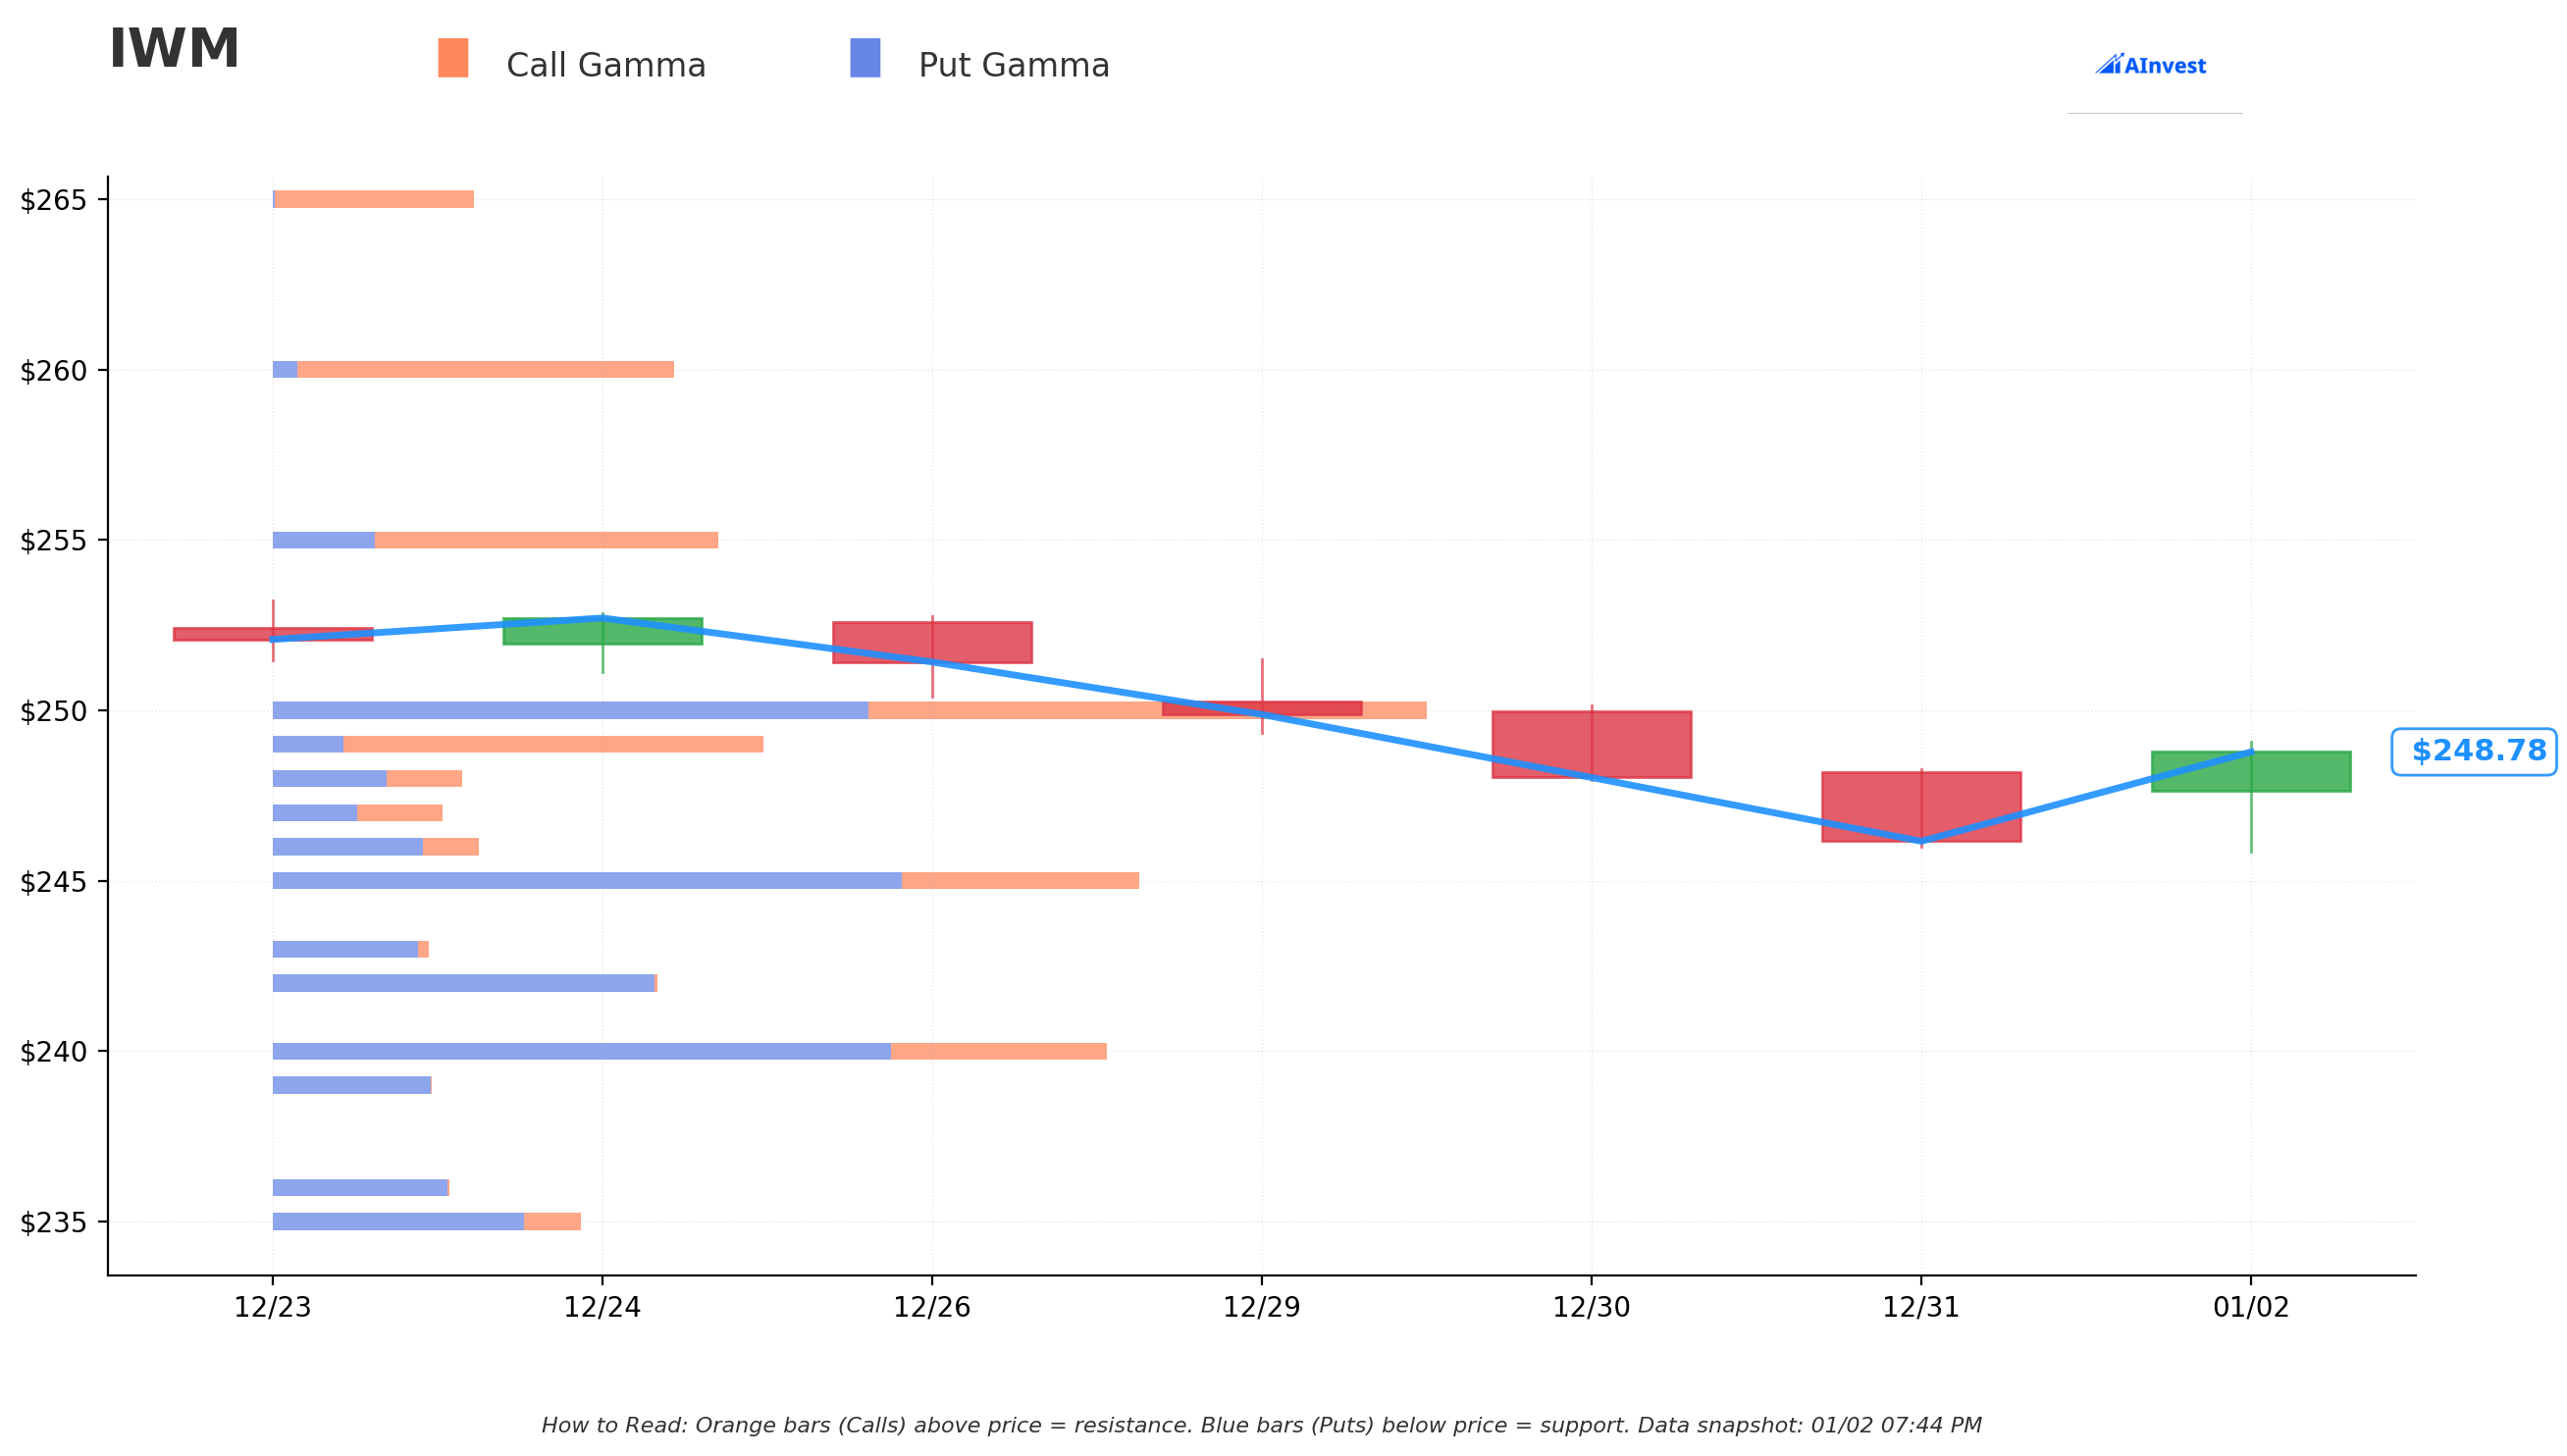
Gamma levels are crucial for this bull put spread because they show where options market makers will defend prices.
🔵 Put Gamma (Support Levels Below Current Price)
The blue bars below $248.78 reveal where protective firepower sits:
-
$245 - STRONGEST SUPPORT ZONE 💪 This is the line in the sand. Massive put gamma here means market makers will be forced buyers if we approach this level, creating a natural floor. Our bull put spread is $9 higher at $236, giving us a solid cushion.
-
$242 - Secondary Support Another defensive wall. If $245 fails, this becomes the next battleground.
-
$240 - Round Number Psychology Big psychological level with options interest. Retail and institutions love round numbers.
-
$235 - Critical Zone for This Trade Just $1 below the short strike! This shows there IS institutional hedging activity near our risk zone, which could provide emergency support.
-
$230 - Last Line of Defense Deep support, but we'd be in serious trouble if we got here.
🟠 Call Gamma (Resistance Levels Above Current Price)
Orange bars above current price show where rally attempts might stall:
-
$249 - Immediate Ceiling We're bumping up against this right now at $248.78. Could see consolidation here.
-
$250 - Major Resistance Big round number with heavy call gamma. Breaking above cleanly would be very bullish.
-
$255, $260, $270 - Upside Targets Stair-stepping resistance levels. If small-cap momentum continues, these become profit-taking zones.
🎯 What This Means for the Bull Put Spread
The gamma analysis is constructive for this trade. With strongest support at $245 and the short strike at $236, the trader has:
- $9 of gamma-supported cushion before reaching the first major defensive line
- Another $9 of air between $245 support and $236 short strike
- Net GEX bias showing bearish, which paradoxically means market makers are positioned to support dips (they're short puts, so they buy when we fall)
This setup suggests the trader did their homework and structured this spread with real conviction that $236 is safe territory for the February 20 expiration.
📊 Implied Move Analysis
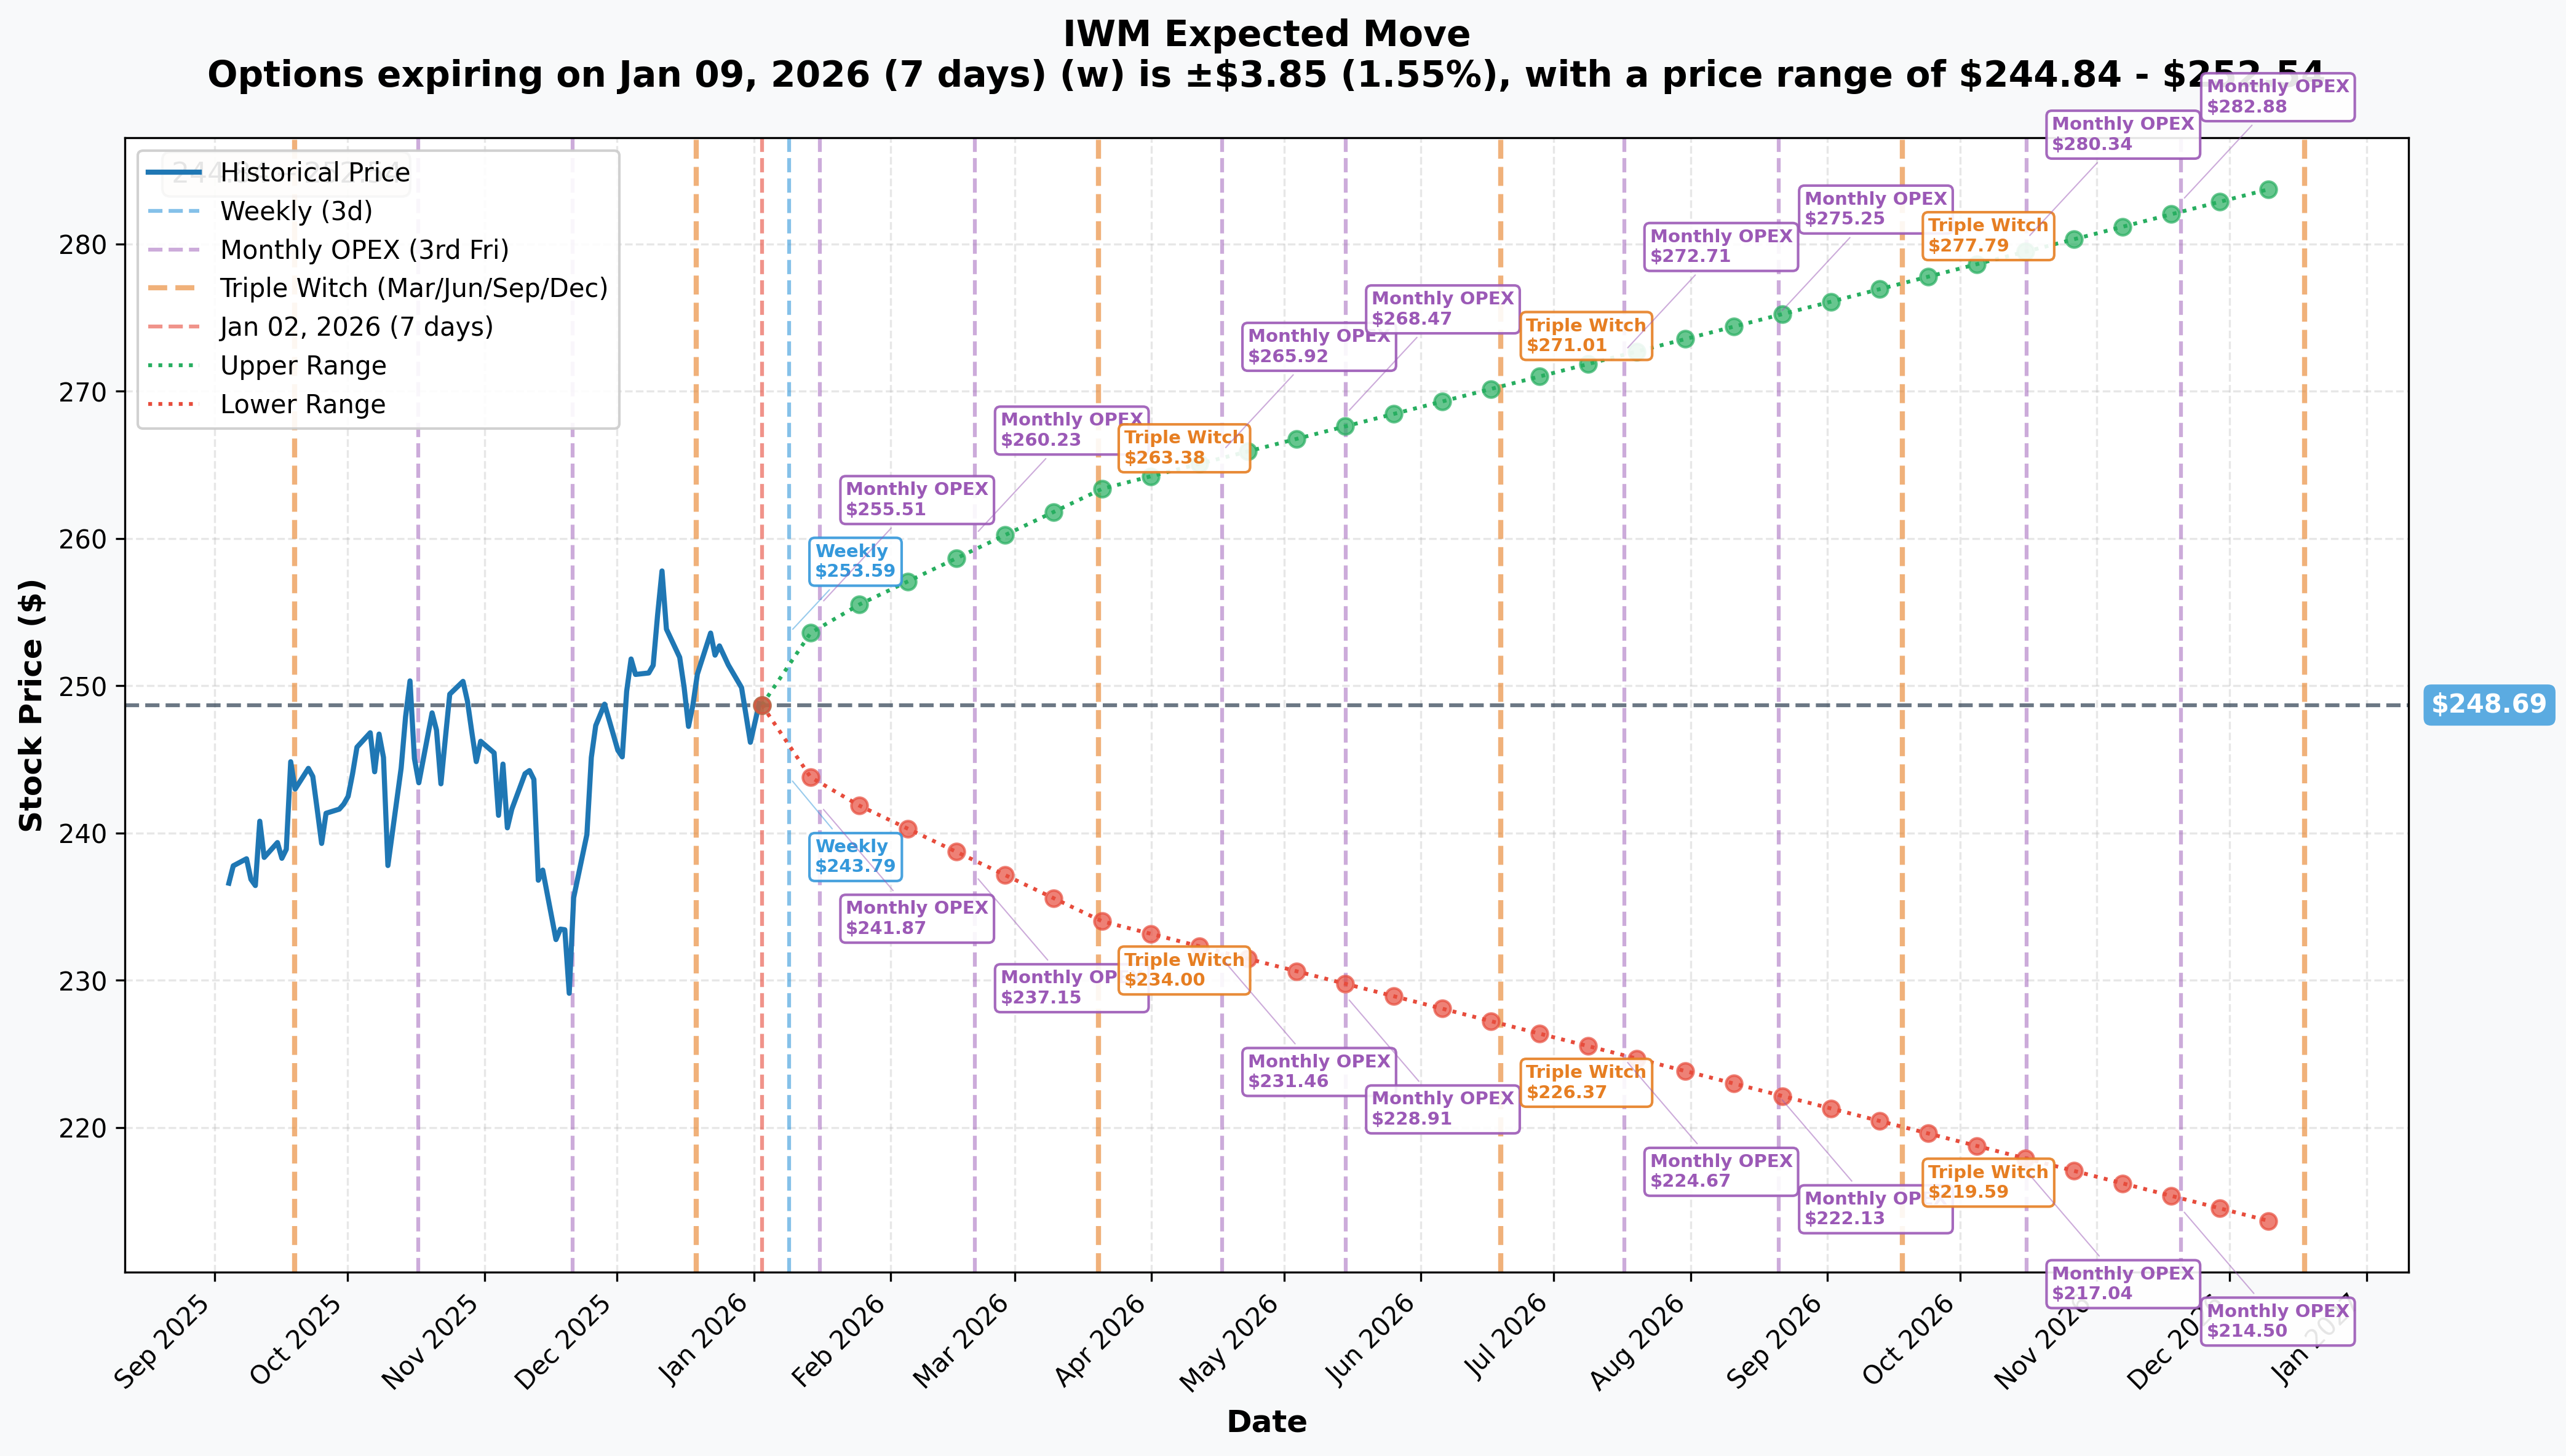
Implied volatility is telling us how much the market expects IWM to move by various expiration dates. This is critical for evaluating the bull put spread's probability of success.
📅 Key Expiration Windows
Weekly (January 9, 2026): ±1.55% Expected range: $245 - $253 This suggests quiet near-term trading, with the low end of the range ($245) sitting $9 above our short strike. Very comfortable.
Monthly OPEX (January 16, 2026): ±2.28% Expected range: $243 - $254 We're still $7 above the short strike even in a worst-case down move. The probability math favors us here.
Our Expiration (February 20, 2026): Interpolated ~±3.5% Expected range: ~$240 - $257 Even with 49 days of potential volatility, the implied move low end sits $4 above our $236 short strike. The market is NOT pricing in a crash scenario.
Quarterly Triple Witch (March 20, 2026): ±5.91% Expected range: $234 - $263 This is interesting - by March (after our expiration), the market sees potential for a move down to $234, which is exactly our long put protection level. The trader timed this spread to expire before the bigger Q1 uncertainty.
LEAPS (December 18, 2026): ±14.37% Expected range: $213 - $284 Full-year expectations are wide, but that's normal for small caps. Not relevant for our short-dated trade.
🎲 Probability Assessment
Based on implied volatility distributions:
- Probability of staying above $236 by Feb 20: Approximately 75-80% (implied move suggests $240 low end, giving us $4 cushion)
- Probability of max profit (above $236): High
- Probability of max loss (below $234): Low, around 5-10%
This aligns with the trader's willingness to risk $7.4M to make $1.1M - they see this as a high-probability income trade, not a lottery ticket.
🎪 Catalysts: What Could Move IWM
Understanding the catalyst calendar is crucial because this spread expires February 20 - we need to know what land mines could blow up before then.
🗓️ Upcoming Events (Impact on Trade)
⚠️ December Employment Report - January 9, 2026 (8:30 AM ET)
The December payroll data could be a volatility trigger. November showed a spike to 4.6% unemployment (four-year high), and December projections suggest only ~140,000 jobs added.
Trade Impact: Weak jobs data could pressure IWM short-term, but it would also increase odds of Fed rate cuts, which are bullish for small caps long-term. Net neutral for a 49-day trade.
🏦 FOMC Meeting - January 28-29, 2026
The first 2026 FOMC meeting won't result in a rate cut (Fed's median projection shows just one cut in 2026), but Powell's tone matters. Small caps are ultra-sensitive to rate expectations.
Trade Impact: This meeting happens 23 days before expiration. If Powell sounds hawkish, we could see a pullback, but $236 still seems safe given current $248.78 price. Low risk.
📊 Q4 2025 Earnings Season - Mid-January Start
This is the BIG ONE. Small-cap earnings season kicks off mid-January, with consensus expectations calling for 17-22% earnings growth for full-year 2026. If companies deliver, it validates the small-cap rotation thesis.
Trade Impact: Earnings beats would provide strong support, reducing downside risk. Earnings misses could trigger volatility. This is a double-edged sword, but the trader clearly believes fundamentals will come through.
📈 J.P. Morgan Healthcare Conference - January 2026
For a Russell 2000 ETF with Healthcare as the top sector, this biotech-focused conference could generate positive catalysts. Lower interest rates are expected to be a "breakout year" tailwind for biotech, reducing the cost of capital for R&D-heavy firms.
Trade Impact: Net positive. Biotech strength would support IWM.
⏰ March 18-19 FOMC (After Expiration)
This meeting with updated economic projections happens AFTER our February 20 expiration, so it's not directly relevant. But it's worth noting that by waiting until after this meeting to exit, the trader avoided the bigger uncertainty.
✅ Recent Events (Already Priced In)
🎉 Small-Cap Outperformance in H2 2025
IWM gained approximately 28% over the past six months, crushing large caps. The Russell 2000 broke 2,500 for the first time ever in October and hit record highs in December.
Status: Fully priced in, but creates bullish momentum foundation.
📉 Three Fed Rate Cuts in Late 2025
The Federal Reserve concluded 2025 with three consecutive rate cuts, bringing rates to 3.50%-3.75%. This directly benefits small-cap companies with variable-rate debt.
Status: Priced in, but the effects on earnings are just starting to flow through in Q4/Q1 reports.
💰 $3 Billion IWM Inflow Spike (Late December)
Despite $5 billion in net 2025 outflows, IWM saw a nearly $3 billion spike in inflows in late December. This shows institutions are positioning for 2026 small-cap leadership.
Status: Very recent; partially priced in but momentum could continue.
🎲 Price Targets & Probabilities
Let me break down three scenarios for IWM through the February 20 expiration, incorporating gamma levels, implied moves, and catalyst timing.
🚀 Bull Case (35% Probability): $255-$260
What Needs to Happen:
- Q4 earnings season delivers on the 17-22% growth forecasts
- January employment report shows stabilization (unemployment doesn't spike further)
- Fed maintains dovish tone at January 28-29 meeting
- Continued rotation from large caps into small caps accelerates
Key Levels:
- Break above $250 resistance cleanly
- Target the $255 call gamma resistance zone
- Possible stretch to $260 if biotech conference generates momentum
Bull Put Spread Outcome: ✅ MAX PROFIT Both puts expire worthless. Trader keeps full $1.1M premium. Return on risk: 15%
Trade Idea for Bulls: If you're bullish enough to think we hit $255+, forget the put spread - just buy calls! The IWM February 21 $250 calls would print.
⚖️ Base Case (50% Probability): $243-$252
What Needs to Happen:
- Choppy consolidation as market digests strong 2025 gains
- Mixed earnings - some beats, some misses, but no disaster
- Employment report weak but not catastrophic
- Small-caps grind sideways to slightly higher, respecting gamma support at $245
Key Levels:
- Defend $245 support (strongest put gamma level)
- Trade in a tight range around current $248.78
- Test $250 resistance but don't break out cleanly
Bull Put Spread Outcome: ✅ MAX PROFIT IWM stays above $236 easily. Even at the low end of this range ($243), we're $7 above the short strike. Trader keeps full $1.1M.
Why This is the Base Case: The implied move analysis shows a February range of ~$240-$257. Gamma support at $245 provides a natural floor. Catalyst calendar has both positive (earnings, biotech conference) and negative (jobs data) elements that likely offset. Sideways grinding feels right.
😰 Bear Case (15% Probability): $235-$242
What Needs to Happen:
- Q4 earnings disappoint badly, validating Goldman Sachs' warning that "consensus estimates appear far too optimistic"
- January employment report shows major deterioration (approaching Sahm Rule recession indicator)
- Fed turns hawkish at January 28-29 meeting, pushing back on 2026 cut expectations
- Risk-off selling accelerates
Key Levels:
- Break below $245 support triggers market maker selling
- Next stop would be $242 secondary support
- Possible test of $240 round number
- $235 becomes the "last stand" before short strike
Bull Put Spread Outcome: ⚠️ PARTIAL LOSS If IWM falls to $235-$242 by February 20:
- $242: Spread expires worthless, full profit
- $240: Spread expires worthless, full profit
- $236: Breakeven exactly
- $235: Loss of $1 per spread = $3.7M loss on $7.4M risk
Why Low Probability: Even in this bear scenario, we're testing the $235-$242 zone, which is near or above the short strike. The implied move low end is $240, not $235. Gamma support at $245 should slow the descent. For the trade to actually lose money, we need a crash below $236 - that's a 5%+ down move from current levels in 49 days despite rate cuts and bullish positioning.
💀 Disaster Scenario (<5% Probability): Below $234
What Would Cause This:
- Systemic market event (geopolitical shock, financial crisis, major recession signal)
- Catastrophic small-cap earnings collapse
- Fed policy error or unexpected rate hike
- Credit crisis hitting the 40% of Russell 2000 companies that are unprofitable
Bull Put Spread Outcome: ❌ MAX LOSS Below $234, both legs are in-the-money. Trader loses the full $2 spread width = $7.4M loss.
Why This is Tail Risk: The implied move for February doesn't even contemplate $234. The market would need to reverse the entire small-cap rotation thesis in 49 days. Possible? Yes. Likely? No. This is why the trader was willing to risk $7.4M to make $1.1M - the probability of disaster is low enough that the risk/reward makes sense.
💡 Trading Ideas
🛡️ Conservative: "Sleep Well Strategy"
For traders who want exposure without sweating every tick.
Cash-Secured Put Selling: Instead of the aggressive bull put spread, sell naked $230 puts for February 20 expiration, cash-secured. This strike is:
- $18.78 below current price (7.5% down move needed)
- Below ALL gamma support levels
- Outside even the bear case range
Why it works: You're collecting premium with a massive safety margin. If you get assigned, you're buying IWM at $230 (a 7.5% discount), which would be a gift given the long-term bullish setup. You could even wheel it by selling covered calls.
Max profit: Premium collected (~$0.50-$1.00 per contract) Max risk: $230 per share if assigned (but you'd own IWM at a discount) Probability of profit: 85-90%
⚖️ Balanced: "Mirror the Whale"
For traders who trust the unusual activity signal.
Replicate the Bull Put Spread (Smaller Size): Copy the exact trade structure but at your comfort level:
- SELL IWM February 20 $236 put
- BUY IWM February 20 $234 put
- Net Credit: ~$0.30 per spread
- Max Profit: $30 per spread (10 contracts = $300)
- Max Risk: $170 per spread (10 contracts = $1,700)
- Breakeven: $235.70
Why it works: You're following smart money with defined risk. If the institutional trader is right, you profit. If they're wrong, your loss is capped. The risk/reward of $170 to make $30 (17.6% return) in 49 days is solid.
Position size: Risk only 1-2% of portfolio on this trade. If you have a $50,000 account, trade 3-5 spreads max ($510-$850 risk).
🚀 Aggressive: "YOLO with Training Wheels"
For traders who think small caps are going to MOON.
Bull Call Spread with Leverage: If you believe we're heading to $255+ by February, skip the put spread and go long:
- BUY IWM February 20 $250 call
- SELL IWM February 20 $255 call
- Net Debit: ~$1.50 per spread
- Max Profit: $3.50 per spread (233% return!)
- Max Risk: $1.50 per spread
- Breakeven: $251.50
Why it works: Limited downside ($150 per spread) with massive upside if the bull case plays out. You're betting on a continuation of the Q4 2025 momentum through earnings season. If Q4 reports beat and small-caps rip to $255, you 3x your money.
Catalyst timing: Aim to be in this trade BEFORE earnings season kicks off mid-January. Exit by early February if we haven't broken $252, or let it ride to expiration if momentum is strong.
Position size: This is speculative, so risk no more than 5% of portfolio. On a $50,000 account, that's $2,500 max = 16 spreads.
⚠️ Risk Factors
Let's be real about what could go wrong with this bull put spread and the small-cap thesis.
📉 Earnings Disappointment Risk
Goldman Sachs has explicitly warned that consensus earnings estimates of 61% growth appear "far too optimistic." If Q4 reports miss badly, IWM could gap down quickly.
What it means: The $236 short strike could get tested faster than expected if multiple Russell 2000 companies guide lower. Watch the early earnings reports closely - they'll set the tone.
🏭 Manufacturing Weakness
There has been "no manufacturing recovery," yet the Russell 2000 is trading as if ISM manufacturing data is strong. Small caps are highly sensitive to economic swings, and a continued manufacturing slowdown could trigger a re-rating lower.
What it means: If January ISM manufacturing data disappoints, expect volatility. The current price might be ahead of fundamentals.
💀 40% Unprofitable Company Composition
Here's the dirty secret: Approximately 40% of Russell 2000 companies are unprofitable. These "zombie companies" face higher interest costs than income, and many have looming refinancing walls in 2026/2027.
What it means: If credit conditions tighten or banks get stingy with refinancing, we could see a wave of small-cap distress. This would hammer IWM broadly, regardless of how the healthy 60% perform.
🌍 Tariff Policy Uncertainty
Bank of America estimates tariff impacts could hit small-cap earnings 3x harder than large caps due to thinner margins and less ability to absorb rising input costs. If tariff tensions escalate in January, small caps could get whipsawed.
What it means: Trade policy headlines are unpredictable. A surprise announcement of broad-based tariffs could tank IWM intraday, potentially testing our $236 strike before cooler heads prevail.
📊 Labor Market Deterioration
Unemployment hit 4.6% in November (a four-year high), and we're approaching the Sahm Rule recession indicator threshold. The January 9 employment report could be a volatility bomb.
What it means: If unemployment spikes further or payrolls collapse, the market might re-price recession odds, crushing cyclical small caps. The January 9 report is Day 7 of this trade - be ready for whipsaw.
🦢 Black Swan Potential
This trade has $7.4M at risk if IWM crashes below $234. While probability is low, systemic shocks happen:
- Geopolitical crisis
- Financial system stress (bank failures, credit freeze)
- Unexpected Fed policy error
- Tech bubble implosion dragging small caps down
What it means: The trader accepted significant tail risk for a 15% return. If you replicate this trade, understand you could lose the full spread width. Position size accordingly.
🎯 The Bottom Line
Here's the deal: This $15.7M bull put spread is NOT a get-rich-quick gamble. It's a sophisticated income generation trade built on a thesis that small caps have strong support near current levels and won't crater 5% in the next 49 days.
The setup is actually quite solid:
- ✅ Gamma support at $245 provides a $9 cushion above the $236 short strike
- ✅ Implied move analysis suggests a low end of ~$240 by February, still $4 above risk
- ✅ Catalyst calendar has both positive (earnings, biotech conference, rate cut hopes) and negative (jobs data) elements, but nothing screaming disaster
- ✅ Institutional positioning shows smart money rotating into small caps after years of underweight
- ✅ Valuation gap of 30% discount to large caps provides fundamental support
The risk is real, though: 40% of Russell 2000 companies are unprofitable, earnings estimates might be too optimistic, manufacturing hasn't recovered, and tariff uncertainty looms. If Q4 earnings disappoint or the January 9 jobs report tanks, we could see a quick test of $240-$245 support.
🎬 Action Plan by Trading Style
If you own IWM: This trade suggests smart money believes $236 is a solid floor. Hold with confidence unless we break $245 support.
If you're watching from the sidelines: Wait for the January 9 employment report. If labor data is ugly and IWM drops to $245, that's your entry for a long position. If data is fine and we hold $248, the bull put spread thesis is validated.
If you're bearish: The risk/reward for shorting here is poor. Even bears should acknowledge the strong support structure. If you MUST play the downside, buy $240 puts for March (after this spread expires) rather than fighting the February gamma.
⏰ Mark Your Calendar
- January 9: December employment report (8:30 AM ET) - could move IWM ±2%
- Mid-January: Q4 earnings season begins - watch early reporters for tone-setting
- January 28-29: FOMC meeting - Fed tone matters for small-cap outlook
- February 20: Expiration day for this spread - the moment of truth
🧠 The Lesson
Bull put spreads like this are how professionals generate steady income in rangebound or bullish markets. The trader isn't betting on IWM to moon - they're betting it doesn't crash. There's a big difference. By selling the $236 put (obligation to buy at $236) and buying the $234 put (protection below $234), they've defined their risk and probability.
If you decide to play this setup, position size is everything. This trade has a 75-80% probability of max profit, but the 20-25% downside scenario can hurt. Never risk more than you can afford to lose, and always know your exit plan.
⚠️ Disclaimer: Options trading involves substantial risk and is not suitable for all investors. Past performance is not indicative of future results. The value of options may fluctuate based on market conditions, and you may lose your entire investment. This analysis is for educational purposes only and does not constitute financial advice. Please consult with a qualified financial advisor before making investment decisions. The author/publisher is not responsible for any losses incurred from trading based on this analysis.
Analysis by Ainvest.com Options Research | Data as of January 2, 2026 market close