IWM $17.1M Put Activity: Institutional Positioning Ahead of FOMC
January 8, 2026 | Unusual Activity Detected
The Quick Take
Someone just executed $17.1 MILLION in coordinated put activity in IWM (iShares Russell 2000 ETF) - a mix of opening new long put positions and closing existing puts at the $245 and $243 strikes expiring February 20, 2026. After the Russell 2000 surged 6.2% in the first week of January, this looks like institutional repositioning ahead of the January 28-29 FOMC meeting. The massive volume (Z-scores up to 5.93) and coordinated timing suggest a single large fund actively managing downside exposure.
ETF Overview
iShares Russell 2000 ETF (IWM) tracks the Russell 2000 Index, providing exposure to 1,951 US small-cap stocks across all sectors.
| Metric | Value |
|---|---|
| Current Price | $258.29 |
| AUM | $73.72 billion |
| Expense Ratio | 0.19% |
| 52-Week Range | $171.73 - $258.20 |
| YTD Return | +4.07% |
| 1-Year Return | +15.07% |
Sector Breakdown: Healthcare (18%), Financials (18%), Industrials (17%), Consumer Discretionary, Technology
Top Holdings: Credo Technology (CRDO) 0.91%, Bloom Energy (BE) 0.81%, Fabrinet (FN) 0.57%, IonQ (IONQ) - each holding represents less than 1% due to broad diversification.
What IWM Does: This is the go-to ETF for small-cap exposure. The Russell 2000 represents roughly 2,000 of the smallest companies in the Russell 3000 Index - think regional banks, biotech startups, domestic manufacturers, and emerging growth companies. It's more volatile than the S&P 500 but historically offers higher long-term returns.
The Option Flow Breakdown
What Just Happened
| Time | Symbol | Buy/Sell | Call/Put | Expiration | Strike | Volume | OI | Premium | Spot Price | Option Price | Order Type | Z-Score | Strategy |
|---|---|---|---|---|---|---|---|---|---|---|---|---|---|
| 10:33:31 | IWM20260220P245 | BUY | PUT | 2026-02-20 | $245 | 19,000 | 76,000 | $4.6M | $258.29 | $2.42 | BTC | 2.75 | Closing Put |
| 10:33:31 | IWM20260220P243 | SELL | PUT | 2026-02-20 | $243 | 19,000 | 49,000 | $3.9M | $258.29 | $2.05 | STC | 0.48 | Closing Put |
| 10:33:31 | IWM20260220P245 | BUY | PUT | 2026-02-20 | $245 | 39,000 | 76,000 | $2.3M | $258.29 | $0.59 | BTO | 5.93 | Long Put |
| 10:33:31 | IWM20260220P245 | BUY | PUT | 2026-02-20 | $245 | 29,000 | 76,000 | $2.3M | $258.29 | $0.79 | BTO | 4.34 | Long Put |
| 10:33:31 | IWM20260220P243 | SELL | PUT | 2026-02-20 | $243 | 29,000 | 49,000 | $2.0M | $258.29 | $0.69 | STC | 1.00 | Closing Put |
| 10:33:31 | IWM20260220P243 | SELL | PUT | 2026-02-20 | $243 | 39,000 | 49,000 | $2.0M | $258.29 | $0.51 | STC | 1.52 | Closing Put |
Total Premium: $17.1M across 6 trades Key Option Symbols:
Strategy Detection Summary
The flow detection system identified the following strategies:
| Strategy Type | Trade Count | Total Premium |
|---|---|---|
| Long Put | 2 | $4.6M |
| Closing Put | 4 | $12.5M |
What This Actually Means
This is a mixed positioning trade - here's the breakdown:
The Pattern: All 6 trades hit at the exact same second (10:33:31), which screams institutional execution. The activity shows:
- Opening new long puts at $245 strike (2 trades totaling $4.6M) - fresh bearish bets
- Closing existing puts at both $245 and $243 strikes (4 trades totaling $12.5M) - taking profits or unwinding hedges
Translation: An institution is actively managing their put exposure. They're closing out some existing positions (likely profitable hedges from before the rally) while simultaneously establishing new downside protection at the $245 level. This suggests they see potential downside risk but are selectively repositioning rather than simply exiting.
The Z-Scores Tell the Story:
- The $245 put buying had Z-scores of 2.75, 4.34, and 5.93 - that's extremely unusual activity
- A Z-score of 5.93 means this volume is nearly 6 standard deviations above normal - this happens maybe a few times per year
- The $243 put selling had lower Z-scores (0.48-1.52) because these were closing existing positions
Unusual Score Context: The largest single trade ($4.6M premium) represents a large fund allocation. Trades of this magnitude in IWM options are seen only a handful of times per month.
Technical Setup / Chart Check-Up
YTD Performance
IWM has been on a solid run, gaining 11.3% over the past year with the current price at $258.29 - trading near 52-week highs.
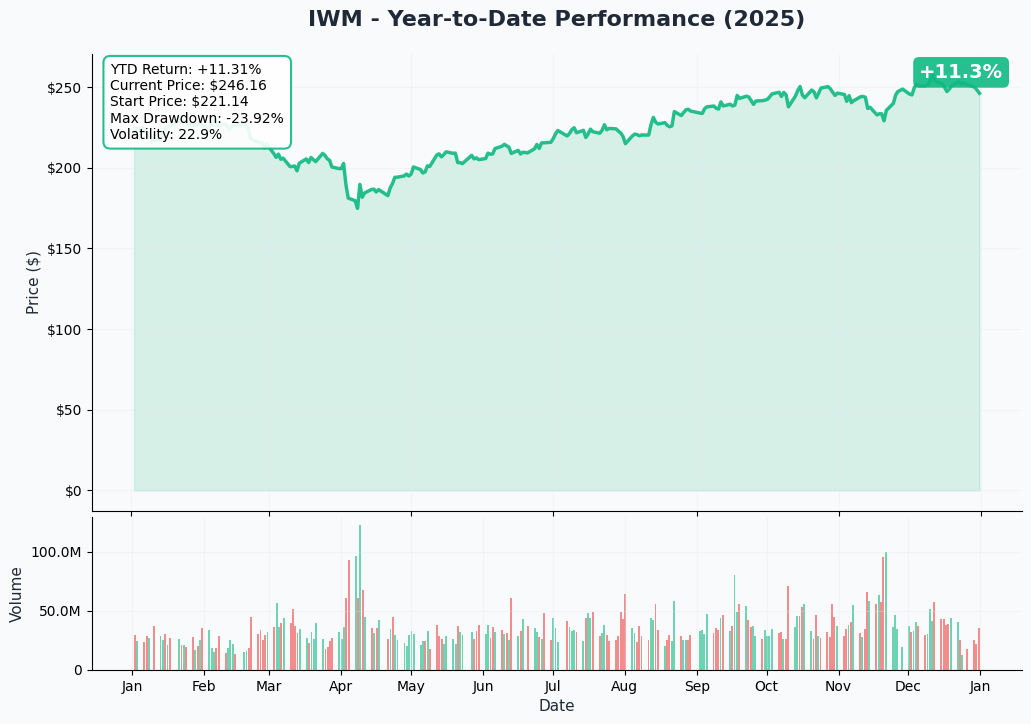
The ETF shows:
- YTD Return: +11.31%
- Start Price (2025): $221.14
- Max Drawdown: -23.92%
- Volatility: 22.9%
The chart shows IWM recovered from an April drawdown and has been trending higher since, with a strong December rally pushing it to new highs in early January 2026.
Gamma-Based Support & Resistance Analysis
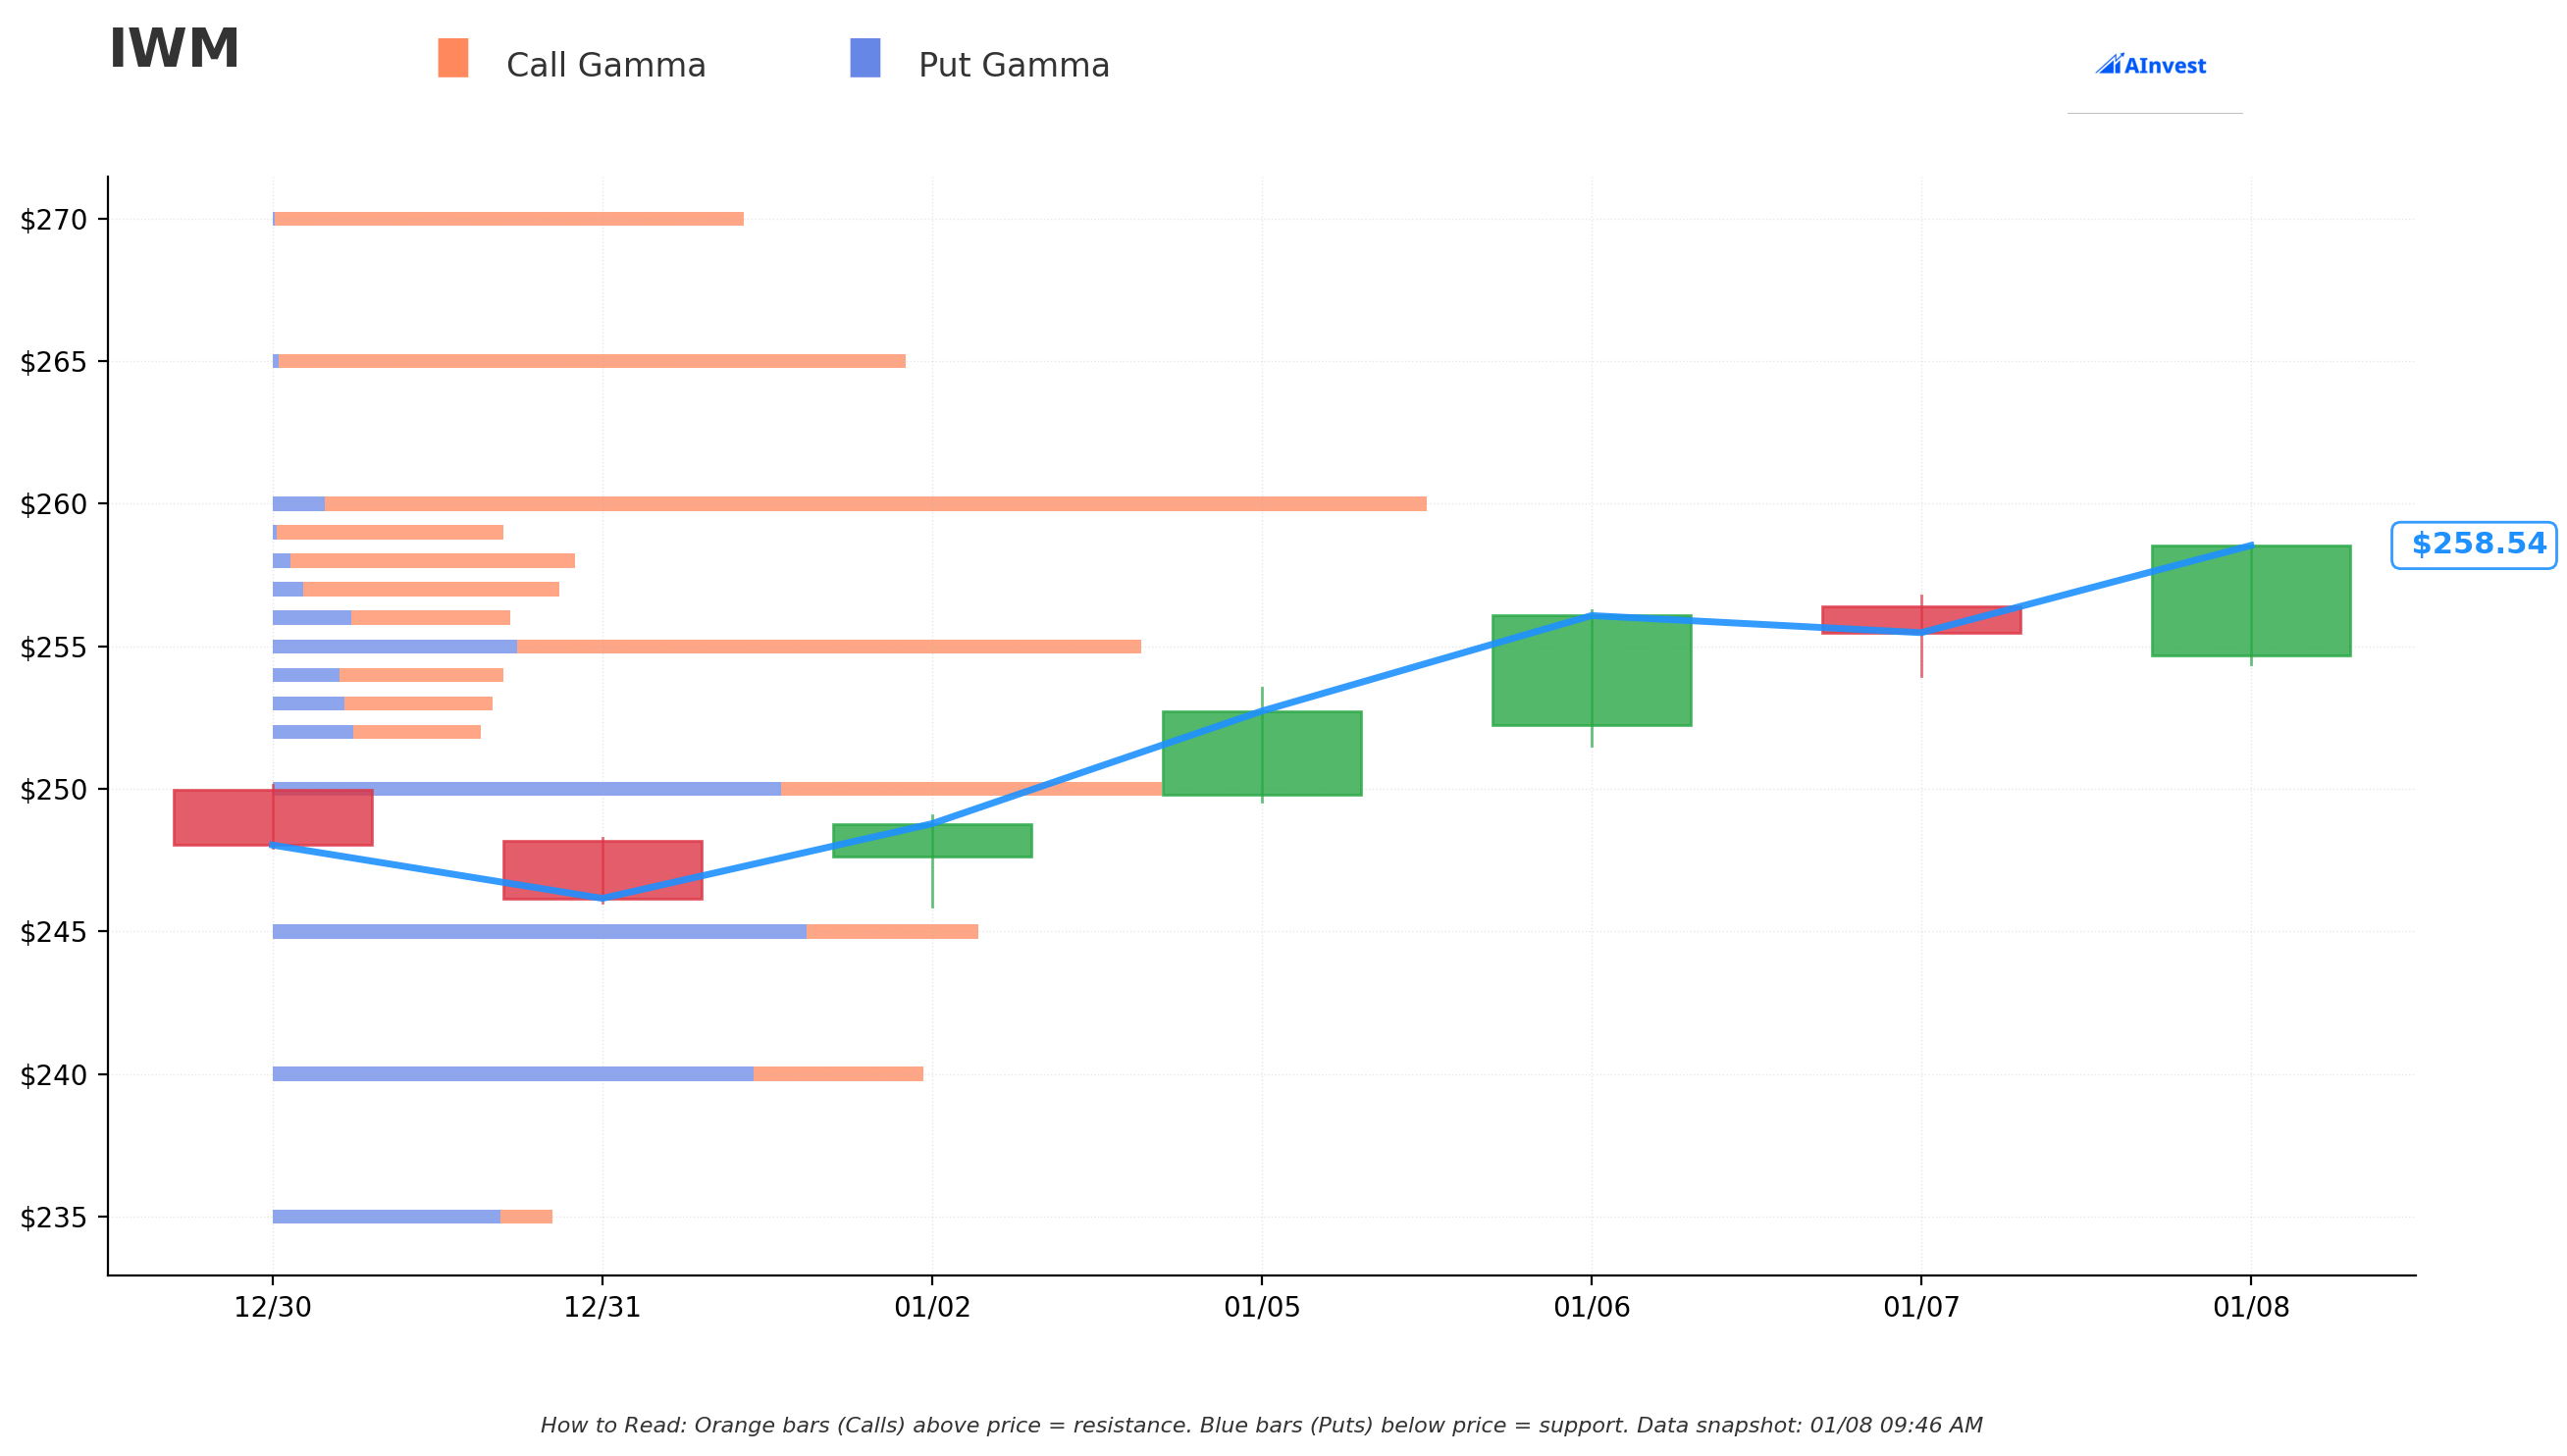
How to Read This Chart:
- Orange bars (Call Gamma) = Resistance levels where price may stall
- Blue bars (Put Gamma) = Support levels where price tends to bounce
Key Gamma Levels (from January 2 data, adjusted for current price):
| Level | Type | Strength |
|---|---|---|
| $260 | Resistance | Strong call gamma wall |
| $265 | Resistance | Moderate resistance |
| $270 | Resistance | Call gamma present |
| $255 | Support | Put gamma building |
| $250 | Support | Heavy put/call concentration |
| $245 | Support | Major put gamma (target of today's trades) |
| $240 | Support | Strong floor |
What This Means: The gamma chart shows significant put gamma at $245 and $240 - exactly where today's put activity was positioned. Market makers have substantial hedging obligations at these levels, which tends to create price support. The $260 level shows call gamma resistance that could cap near-term upside.
Implied Move Analysis
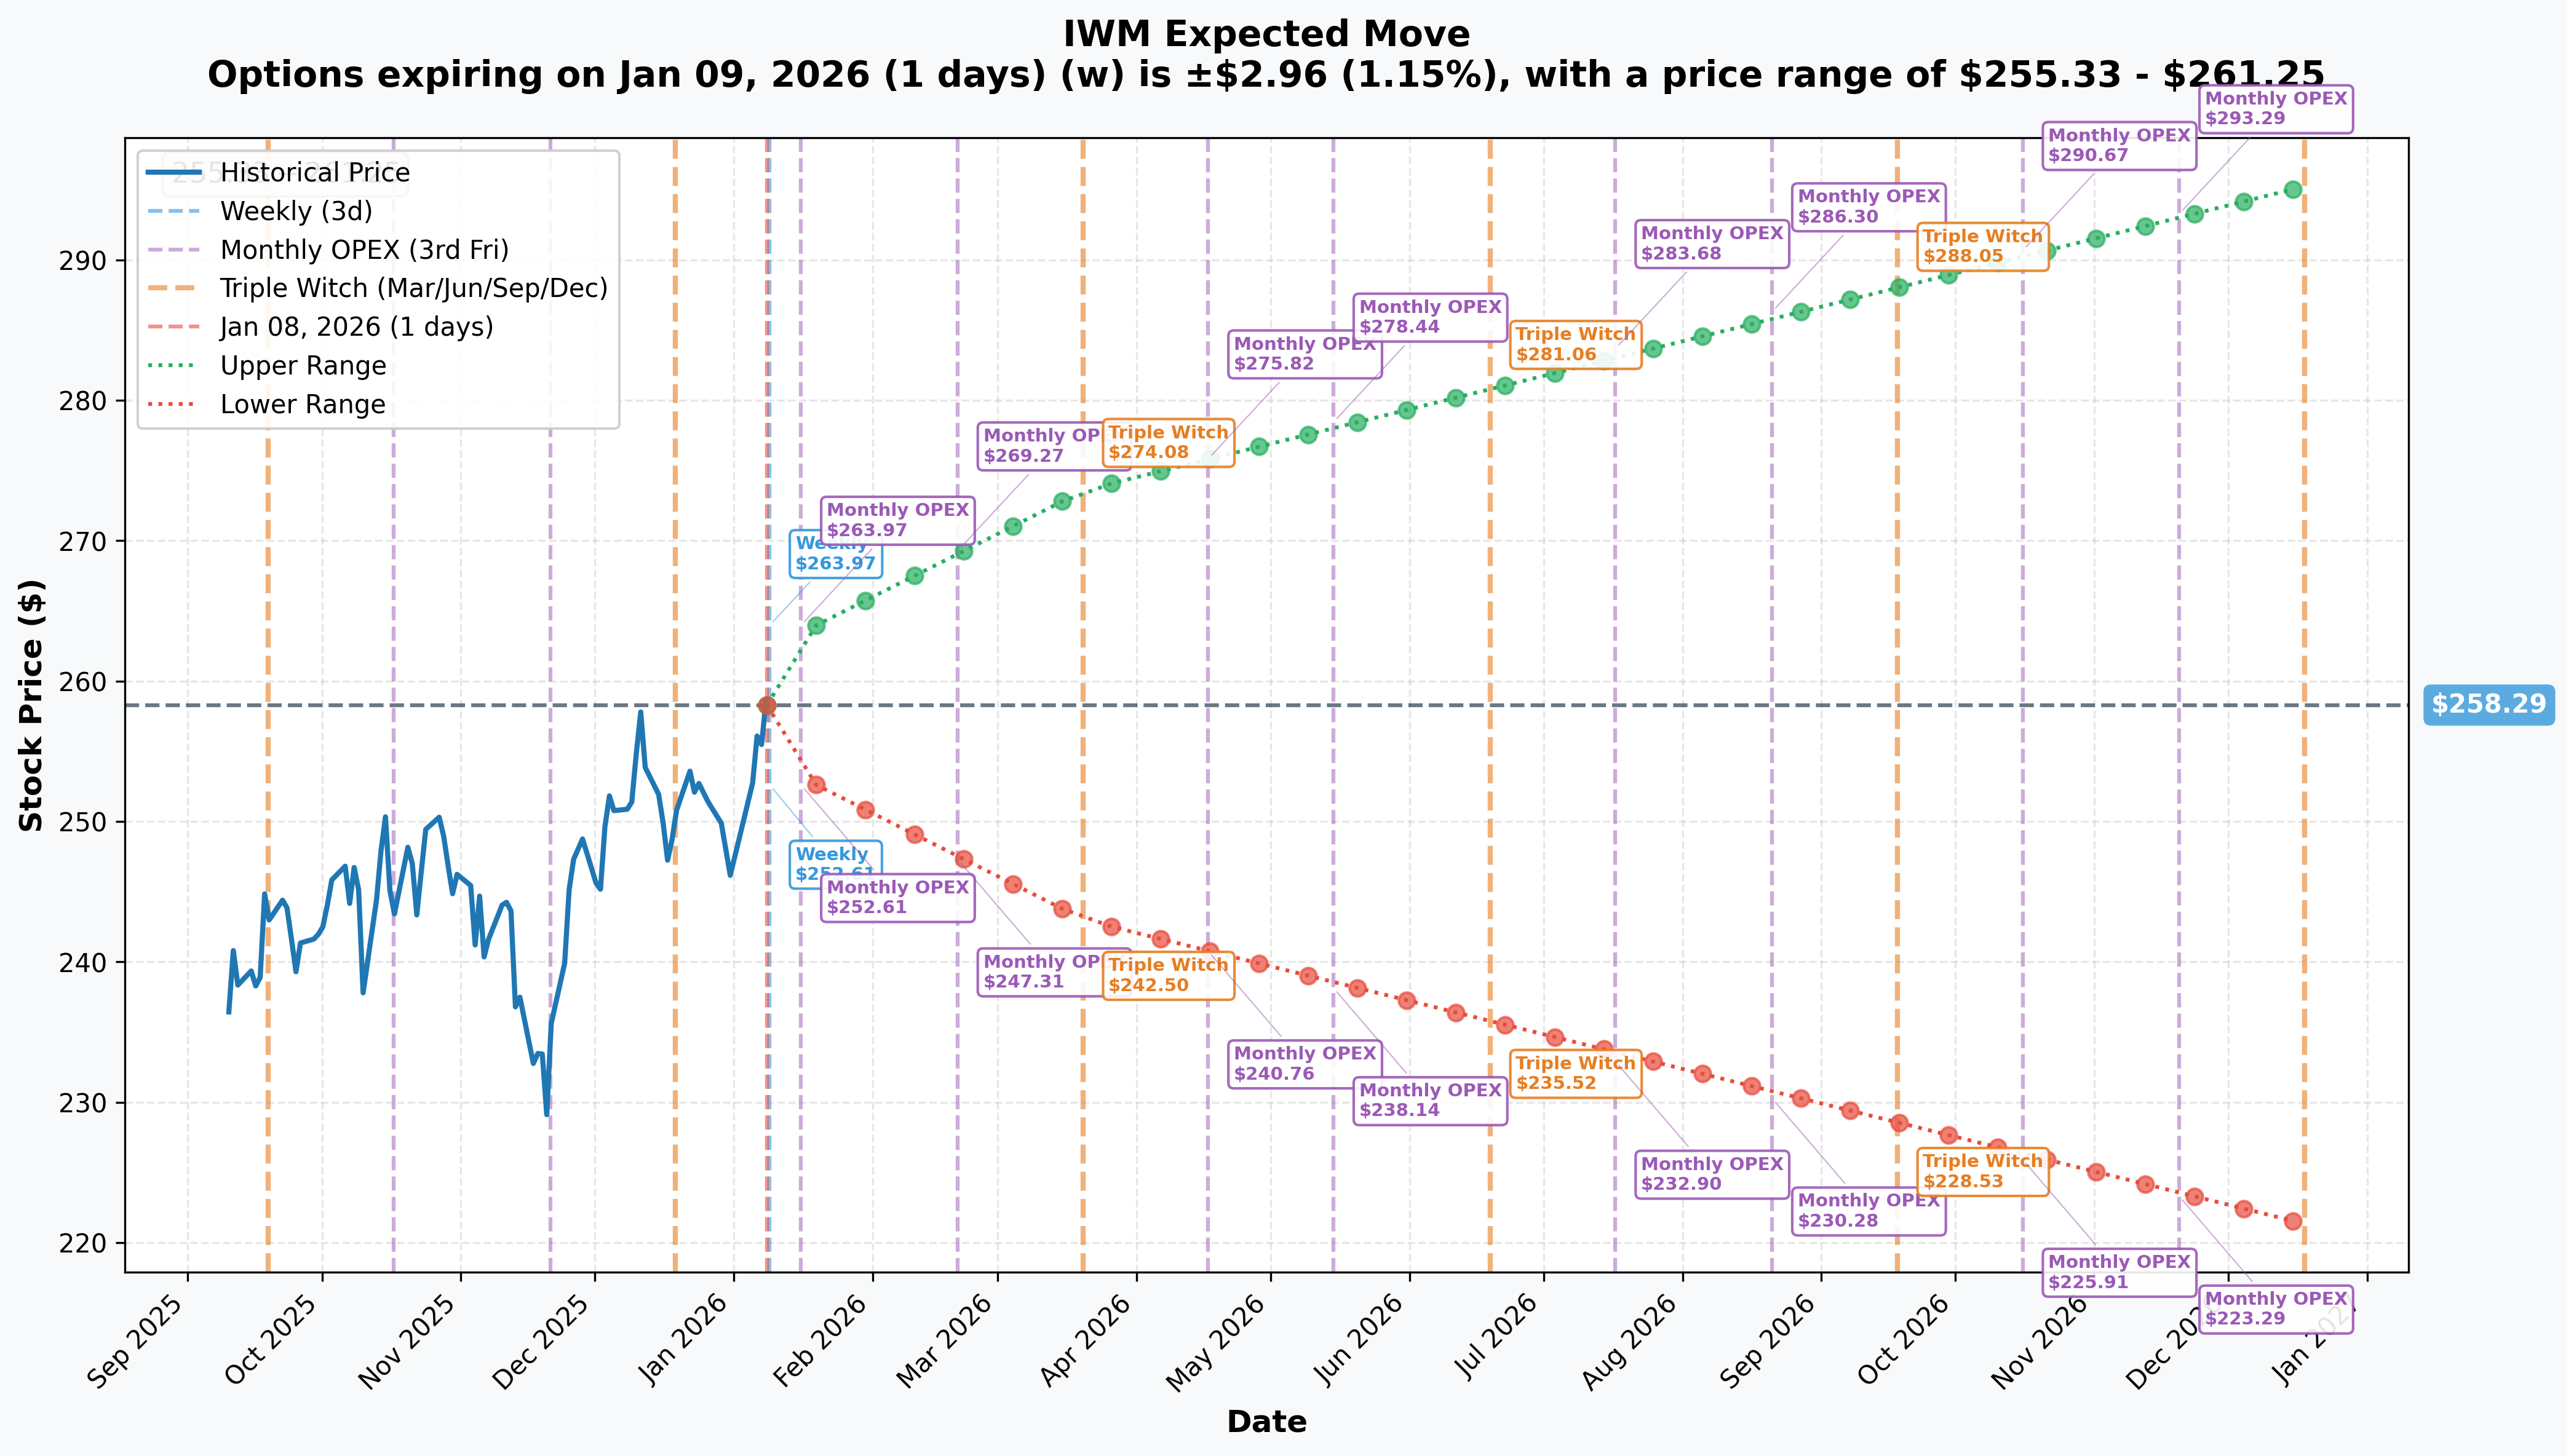
Options Market Expectations:
| Timeframe | Expiration | Expected Move | Range |
|---|---|---|---|
| Weekly | Jan 9, 2026 | +/- 1.15% ($2.96) | $255.33 - $261.25 |
| Monthly OPEX | Jan 16, 2026 | +/- 2.01% ($5.20) | $253.09 - $263.49 |
| Feb OPEX | Feb 20, 2026 | +/- ~4.25% | $247.31 - $269.27 |
| Triple Witch | Mar 20, 2026 | +/- 5.93% ($15.31) | $242.98 - $273.60 |
| LEAPS | Dec 18, 2026 | +/- 14.32% ($36.98) | $221.31 - $295.27 |
Critical Insight: The February 20, 2026 expiration (the date of today's unusual trades) has an implied range of roughly $247-$269. The $245 strike on those puts is just below the expected lower bound, meaning the market sees less than a 15% chance of IWM hitting that level by expiration.
Catalysts
Upcoming Events
| Date | Event | Significance |
|---|---|---|
| Jan 28-29, 2026 | FOMC Meeting | Rate decision - small caps highly sensitive to Fed |
| Feb 2026 | Q4 2025 Earnings Peak | Russell 2000 companies report |
| Mar 18-19, 2026 | FOMC + Projections | Updated dot plot, critical for rates |
| Apr 29-30, 2026 | FOMC Meeting | Expected rate cut per CME FedWatch |
| May 2026 | Powell Term Expires | Leadership transition potential volatility |
Recent Catalysts (Already Happened)
- Jan 7, 2026: Russell 2000 plunged 2.4%+ intraday on sticky inflation data reviving "higher-for-longer" fears
- Jan 2-6, 2026: Initial "January Effect" rally pushed IWM to all-time highs with 6.2% surge
- Dec 2025: Russell 2000 jumped 12% for the month, crossing 2,500 for the first time
- Q4 2025: Fed delivered 3 consecutive rate cuts bringing rates to 3.50%-3.75%
Price Targets & Probabilities
Based on gamma levels, implied move data, and catalyst analysis:
Bull Case: $265-270 (Probability: 35%)
Why: The "Great Rotation" from mega-cap tech into small caps has momentum. JPMorgan says they're "convinced 2026 is year to be overweight small- and mid-cap stocks." Jefferies targets Russell 2000 at 2,825 (+14% from current).
Triggers: Fed confirms April rate cut, inflation data cools, earnings beat expectations
Base Case: $253-260 (Probability: 45%)
Why: Current implied move suggests this range by February. Gamma levels show heavy activity at $255-260 creating a natural trading range. Market digests recent gains while waiting for FOMC clarity.
Triggers: Status quo - no major surprises, inflation stays sticky but contained
Bear Case: $243-247 (Probability: 20%)
Why: The put strikes ($243-245) represent downside targets if things go wrong. Goldman Sachs warns that consensus EPS growth estimates of 61% are "far too optimistic." 40% of Russell 2000 companies remain unprofitable and face refinancing risks.
Triggers: Hot inflation forces Fed to pause cuts, credit conditions tighten, regional bank stress emerges
Trading Ideas
Conservative: Cash-Secured Put at Support
The Play: Sell IWM Feb 20 $245 Put (same strike as institutional activity)
Details:
- Premium: ~$1.50-2.00 per contract
- Max Profit: Premium collected if IWM stays above $245
- Break-even: ~$243-243.50
- Margin/Cash Required: ~$24,500 per contract
Why This Works: You're getting paid to potentially buy IWM at a 5% discount to current price. The $245 level has strong gamma support, and options market implies less than 15% chance of reaching this level by expiration. Worst case: you own a diversified small-cap ETF at a reasonable price.
Risk: IWM crashes below $243 - you're assigned and underwater.
Balanced: Bull Put Spread
The Play: Sell IWM Feb 20 $250 Put / Buy IWM Feb 20 $245 Put
Details:
- Net Credit: ~$1.50-2.00 per spread
- Max Profit: Credit received ($150-200 per spread)
- Max Loss: $5.00 - credit = ~$3.00-3.50 ($300-350 per spread)
- Break-even: ~$248-248.50
Why This Works: IWM needs to stay above $250 by February 20 for max profit. That's only 3% below current price with gamma support at $250-255. You're essentially betting against the same levels the institution is hedging. Risk is defined and limited.
Risk: Sharp decline below $245 - max loss of $300-350 per spread.
Aggressive: Call Spread on Rotation Thesis
The Play: Buy IWM Feb 20 $260 Call / Sell IWM Feb 20 $270 Call
Details:
- Net Debit: ~$3.00-3.50 per spread
- Max Profit: $10.00 - debit = ~$6.50-7.00 ($650-700 per spread)
- Max Loss: Premium paid ($300-350 per spread)
- Break-even: ~$263-263.50
Why This Works: If the "Great Rotation" continues and small caps outperform, IWM has room to run toward $270. Wall Street consensus puts the 12-month target at $311.34 - this trade only needs IWM to reach $270 by February. The institutional put activity today suggests big money is actively managing downside risk rather than aggressively positioning for a crash.
Risk: IWM stalls or pulls back - lose full premium.
Risk Factors
High Risk
- Zombie Company Refinancing Wall: ~40% of Russell 2000 companies are unprofitable and face significant refinancing risk in 2026-2027 as ultra-low-rate debt comes due
- Sticky Inflation: The January 7 sell-off showed how quickly small caps can crater on inflation fears - monthly inflation at 0.3% keeps Fed uncertain
Medium Risk
- Regional Bank Exposure: IWM has 18% financials weight; regional banks face $1.5 trillion CRE maturity wall in 2026
- ISM Contraction: Manufacturing PMI contracted to 47.9 in December - 10th consecutive month of contraction
- Fed Leadership Transition: Powell's term expires May 2026 - policy uncertainty ahead
Lower Risk
- Tariff Uncertainty: Supreme Court evaluating Trump tariff legality - ruling expected early 2026
The Bottom Line
Real talk: Today's $17.1M put activity in IWM shows an institution actively managing their downside exposure after the small-cap rally. They're closing some existing hedges (likely profitable after the January 7 selloff) while opening new long put positions at $245 - that's selective repositioning rather than panic buying or wholesale exit.
Here's your action plan:
If you're bullish on small caps: The balanced bull put spread ($250/$245) lets you collect premium while defining your risk. You're betting IWM stays above $250 - a reasonable assumption given gamma support and the "Great Rotation" thesis.
If you're watching from the sidelines: Keep an eye on the January 28-29 FOMC meeting. Small caps are hyper-sensitive to rate expectations. A dovish surprise could push IWM toward $265-270; a hawkish surprise could send it back to $250 quickly.
If you're bearish: Consider the Jefferies warning that Wall Street's 61% EPS growth estimates are "far too optimistic." A put spread below $245 offers defined-risk downside exposure, but you're fighting the Fed cutting cycle.
Mark your calendar: FOMC January 28-29 is the next major catalyst. If you're trading options expiring February 20, that meeting will set the tone for your position.
Disclaimer
This analysis is for educational purposes only and does not constitute investment advice. Options involve significant risk and are not suitable for all investors. You can lose more than your initial investment. Past unusual activity does not guarantee future price movement. Always do your own research and consider consulting a financial advisor before making trading decisions. The author may hold positions in securities mentioned.
Analysis generated January 8, 2026 | Data sources: AInvest