IWM Bear Put Spread Signals Small-Cap Caution Ahead!
January 9, 2026 | Unusual Activity Detected
The Quick Take
Someone just dropped $14.7M in total premium on a massive bear put spread in IWM, the Russell 2000 ETF that tracks small-cap stocks. The weird part? It's structured as a credit spread - they collected $1.7M net - which means they're betting IWM stays above $249 but want protection if small caps take a dive. With the Russell 2000 just hitting all-time highs and the FOMC meeting looming on January 28, this looks like a hedge from a major player who's nervous about the "January Effect" rally running out of steam.
ETF Overview
iShares Russell 2000 ETF (IWM) provides exposure to small-capitalization U.S. equities:
- Assets Under Management: $74.81 Billion
- Current Price: $260.74
- Expense Ratio: 0.19%
- 52-Week Range: $171.73 - $260.18
- P/E Ratio: 67.13
- Dividend Yield: 1.2%
- Average Daily Volume: 35.56 million shares
- Tracking Index: Russell 2000 Index
IWM tracks approximately 2,000 of the smallest securities in the Russell 3000 Index, representing about 7% of total U.S. equity market capitalization. Key sector exposures include Industrials (~17.7%), Healthcare (~17.4%), Financials (~14-15%), and Consumer Discretionary (~12-13%).
The Option Flow Breakdown
The Tape (January 9, 2026 @ 12:24:32):
| Time | Symbol | Side | Buy/Sell | Type | Expiration | Premium | Strike | Volume | OI | Z-Score | Spot | Option Price |
|---|---|---|---|---|---|---|---|---|---|---|---|---|
| 12:24:32 | IWM | BID | BUY | PUT $246 | 2026-02-20 | $6.5M | $246 | 48K | - | 1.92 | $260.74 | $1.35 |
| 12:24:32 | IWM | ASK | SELL | PUT $249 | 2026-02-20 | $8.2M | $249 | 36K | - | 25.71 | $260.74 | $2.28 |
What This Actually Means
This is a textbook bear put spread structured as a credit - an unusual configuration! Here's the breakdown:
Bear Put Spread Structure:
- Long leg: Bought 48,000 contracts of February 20, 2026 $246 puts for $1.35 each = $6.5M total
- Short leg: Sold 36,000 contracts of February 20, 2026 $249 puts for $2.28 each = $8.2M total
- Net Premium: $1.7M CREDIT (unusual - typically these are debit spreads!)
- Max Risk: $3 per share x 36,000 contracts = $10.8M potential loss
- Breakeven: $249 (above current $260.74 = 4.5% cushion)
- Expiration: 42 days to February 20 OPEX
What's the trader's thesis?
Real talk: This is NOT a straightforward bearish bet. Here's the playbook:
The Setup: By selling the $249 puts for MORE than they paid for the $246 puts, this trader is collecting premium upfront. They profit if IWM stays above $249 by expiration.
The Hedge: BUT if IWM crashes below $246, they have protection. The long $246 puts limit their downside.
Translation: This looks like a large fund that's LONG small caps, collecting premium while maintaining a hedge. They're saying: "I think we stay above $249, but if we don't, I want insurance."
Unusual Score: HIGHLY UNUSUAL (Z-score 25.71 on the $249 short leg, 1.92 on $246 long leg)
The 25.7x Vol/OI ratio on the $249 strike is absolutely massive - this is the kind of activity you might see a few times per quarter, not everyday. Someone with serious capital is positioning here.
Technical Setup / Chart Check-Up
YTD Chart
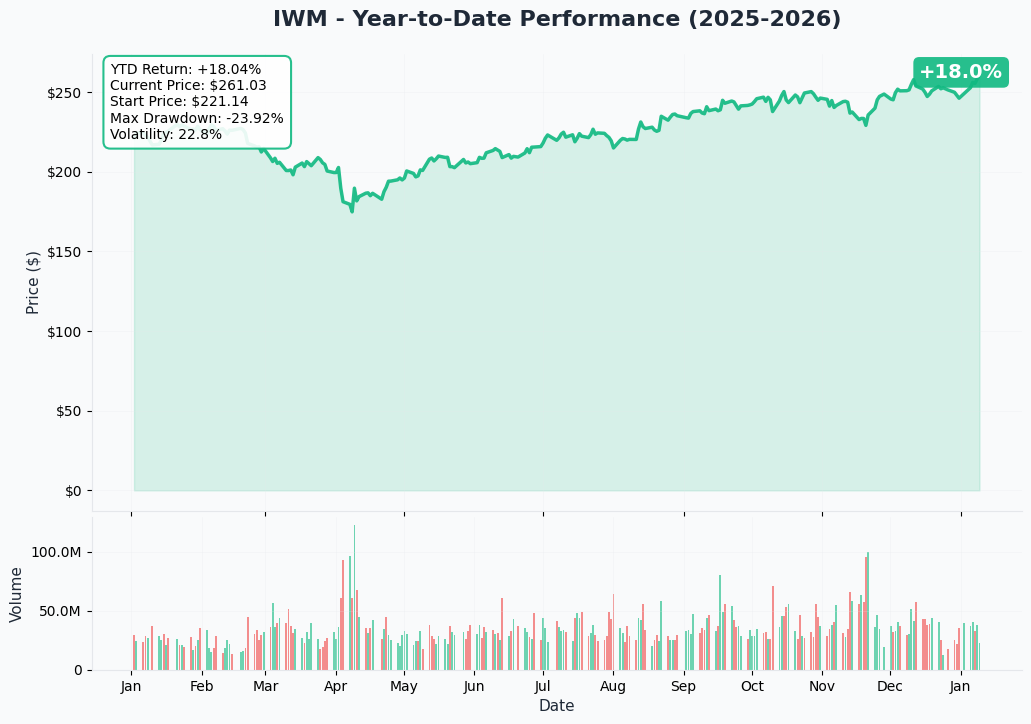
IWM has been on a tear in early 2026, surging 6.2% in the first week alone according to Financial Content's analysis. The Russell 2000 hit a new all-time high of 2,603.90 on January 8, 2026, confirming the breakout. But after such a parabolic move, a pullback wouldn't surprise anyone.
Key Technical Levels:
- Current Price: $260.74
- 50-Day MA: $248.37 (BUY signal per Barchart)
- 200-Day MA: $243.13 (BUY signal)
- 14-Day RSI: 56.39 (neutral-bullish)
- MACD: 0.890 (BUY signal)
IWM is trading above all major moving averages with momentum indicators positive. However, the 5-day MA at $251.16 is flashing a SELL signal, suggesting near-term consolidation is possible.
Gamma-Based Support & Resistance Analysis
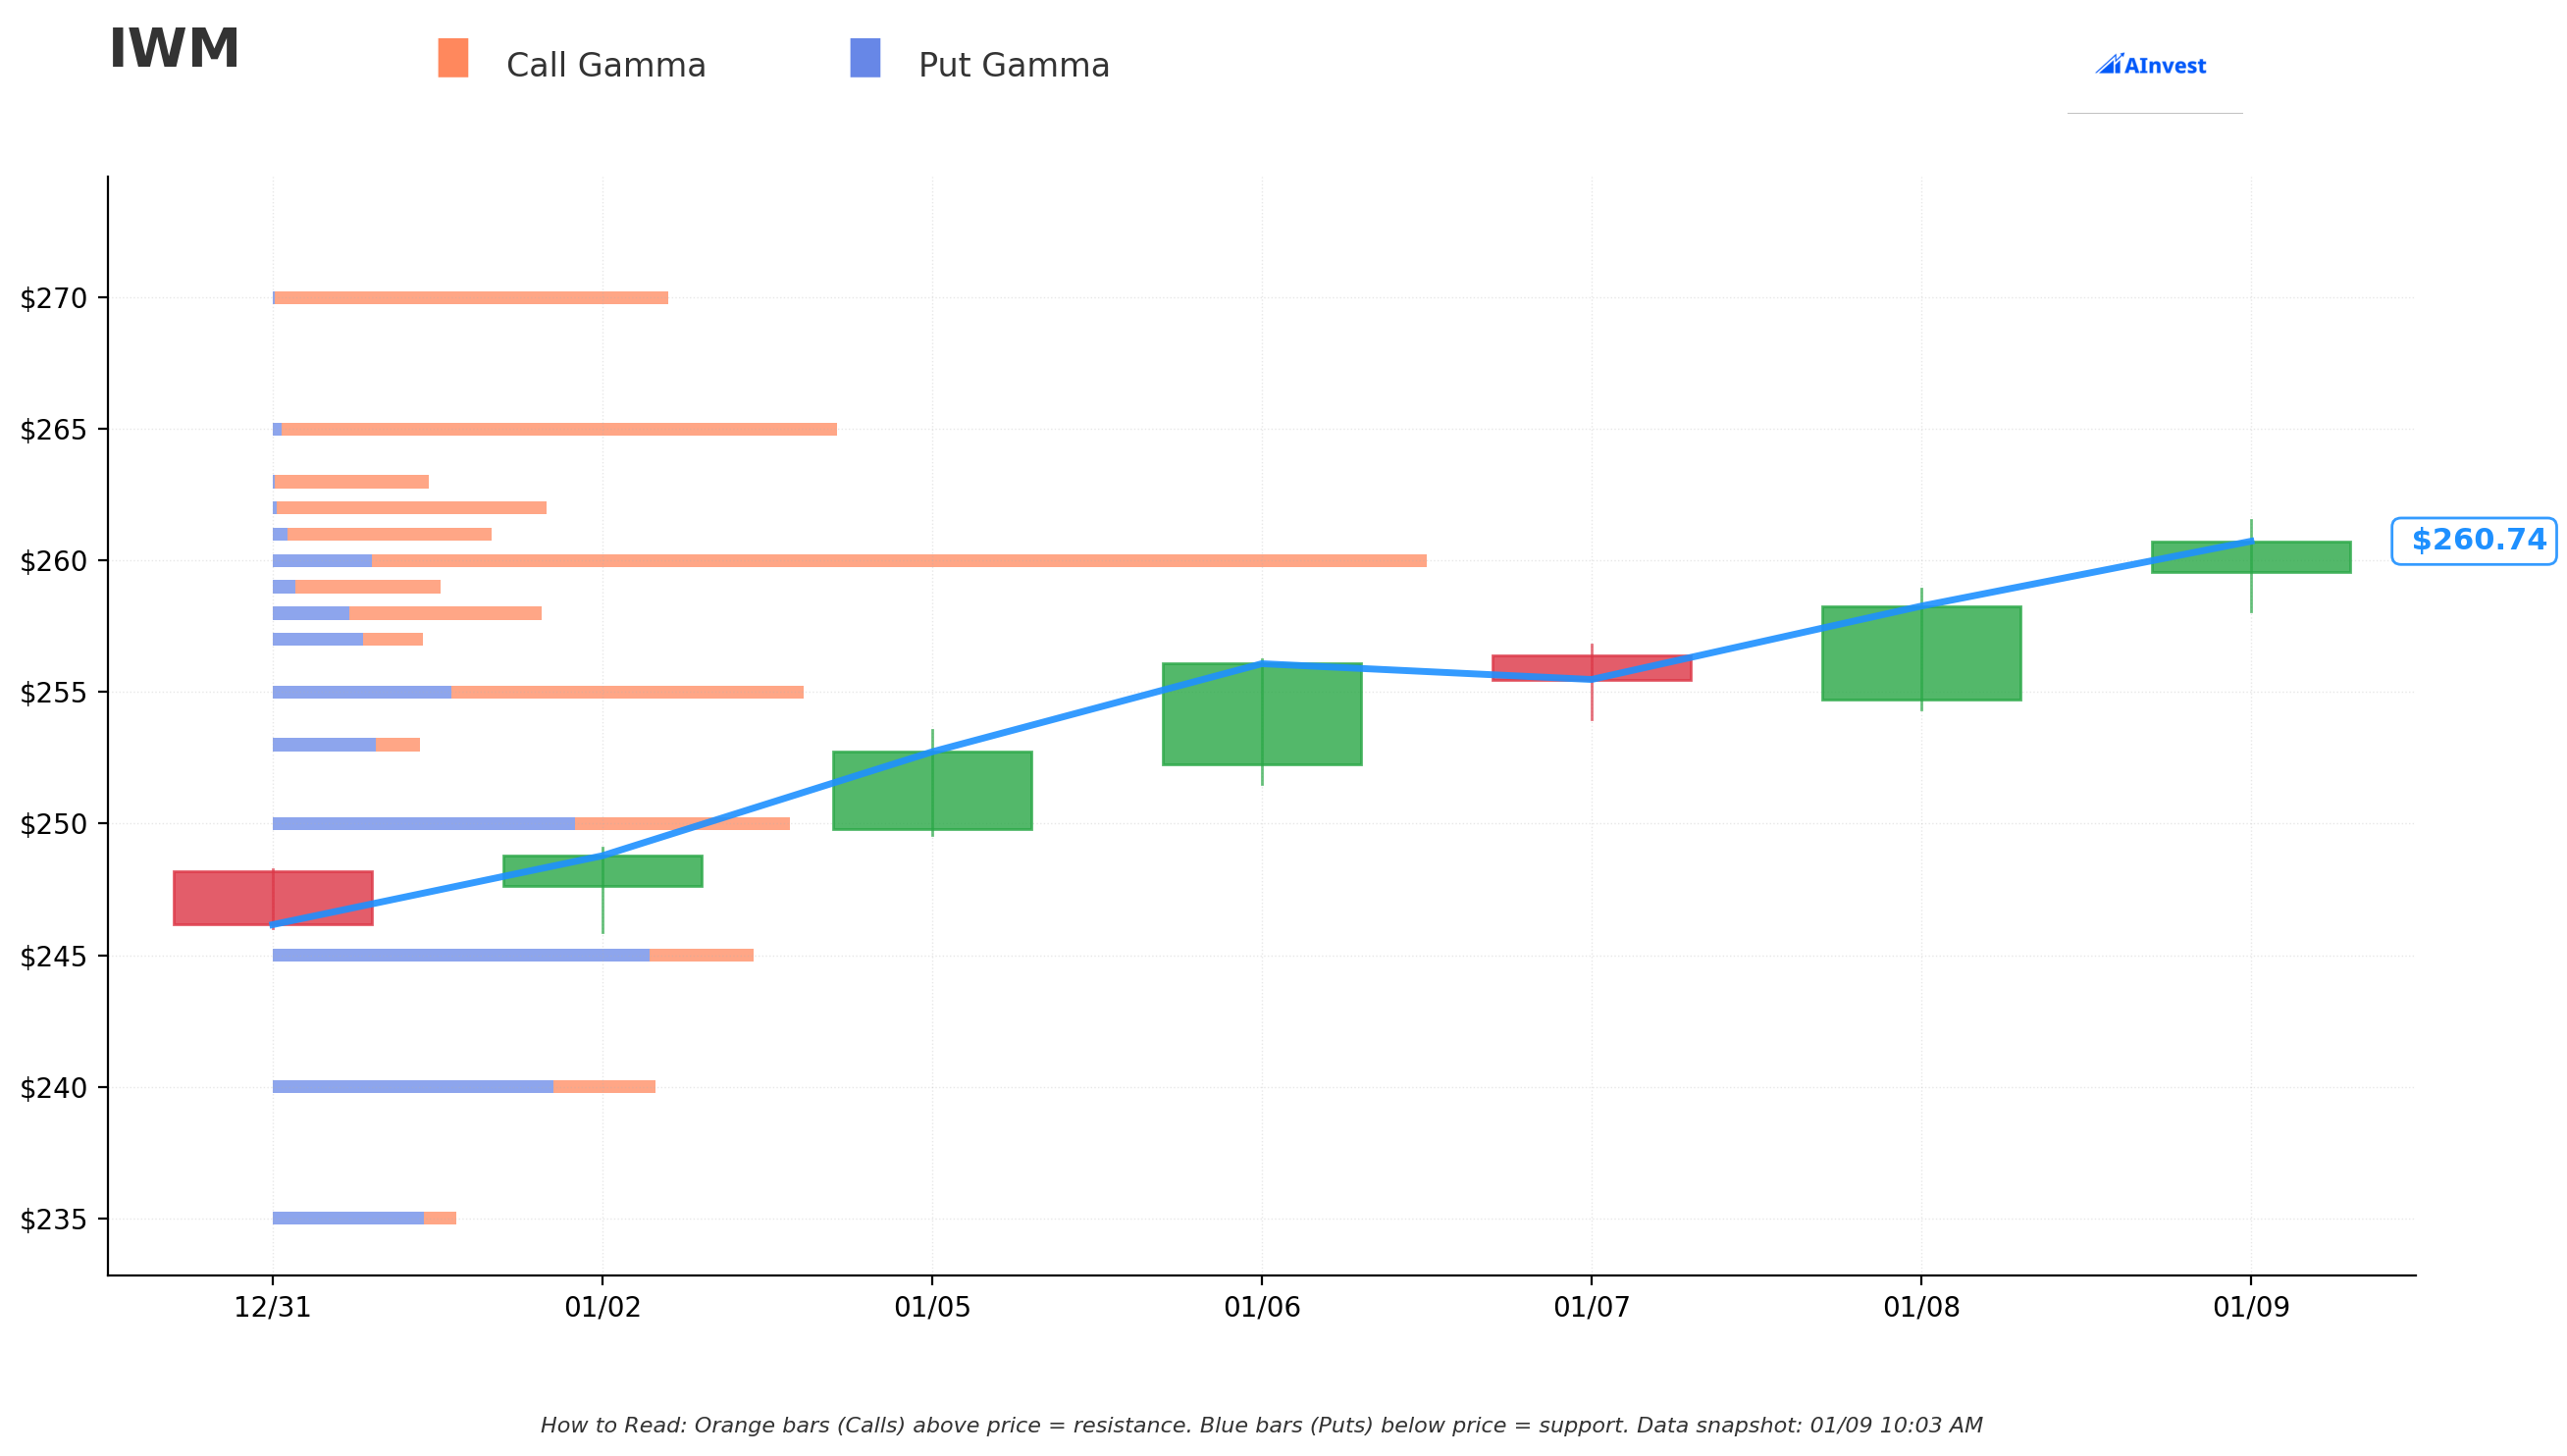
Current Price: $260.74
The gamma exposure map reveals the magnetic price levels where market makers hold massive positions:
Support Levels (Put Gamma Below Price):
| Strike | Net GEX | Distance from Current |
|---|---|---|
| $260 | 239.76 | -0.3% |
| $255 | 44.92 | -2.2% |
| $250 | -20.80 | -4.1% |
| $245 | -65.49 | -6.0% |
| $240 | -42.12 | -8.0% |
The $260 strike has MASSIVE gamma support - 239.76 net GEX - this is the strongest level on the board. Expect dip buyers to show up here. Below that, $250 and $245 flip to negative gamma territory, meaning moves could accelerate.
Resistance Levels (Call Gamma Above Price):
| Strike | Net GEX | Distance from Current |
|---|---|---|
| $262 | 61.59 | +0.5% |
| $265 | 131.40 | +1.6% |
| $270 | 93.93 | +3.6% |
The $265 strike shows the highest call gamma - expect IWM to face resistance there. This aligns with the implied move upper range of $265.65 for the weekly expiration.
What this means for the bear put spread:
The trader perfectly structured their spread around gamma dynamics! Notice:
- $260 support (239.76M net GEX) provides strong floor - unlikely to drop much below entry
- $249 short put strike sits below major support - trader betting IWM stays above this level
- $246 long put strike aligns with March Triple Witch lower range ($246.22) - maximum protection point
Net GEX Bias: BULLISH (Total Call GEX: 1,287.68 vs Put GEX: 787.01)
Translation: Market makers are positioned in a way that should provide support to IWM - they'll be buying dips and selling rallies, which tends to reduce volatility.
Implied Move Analysis
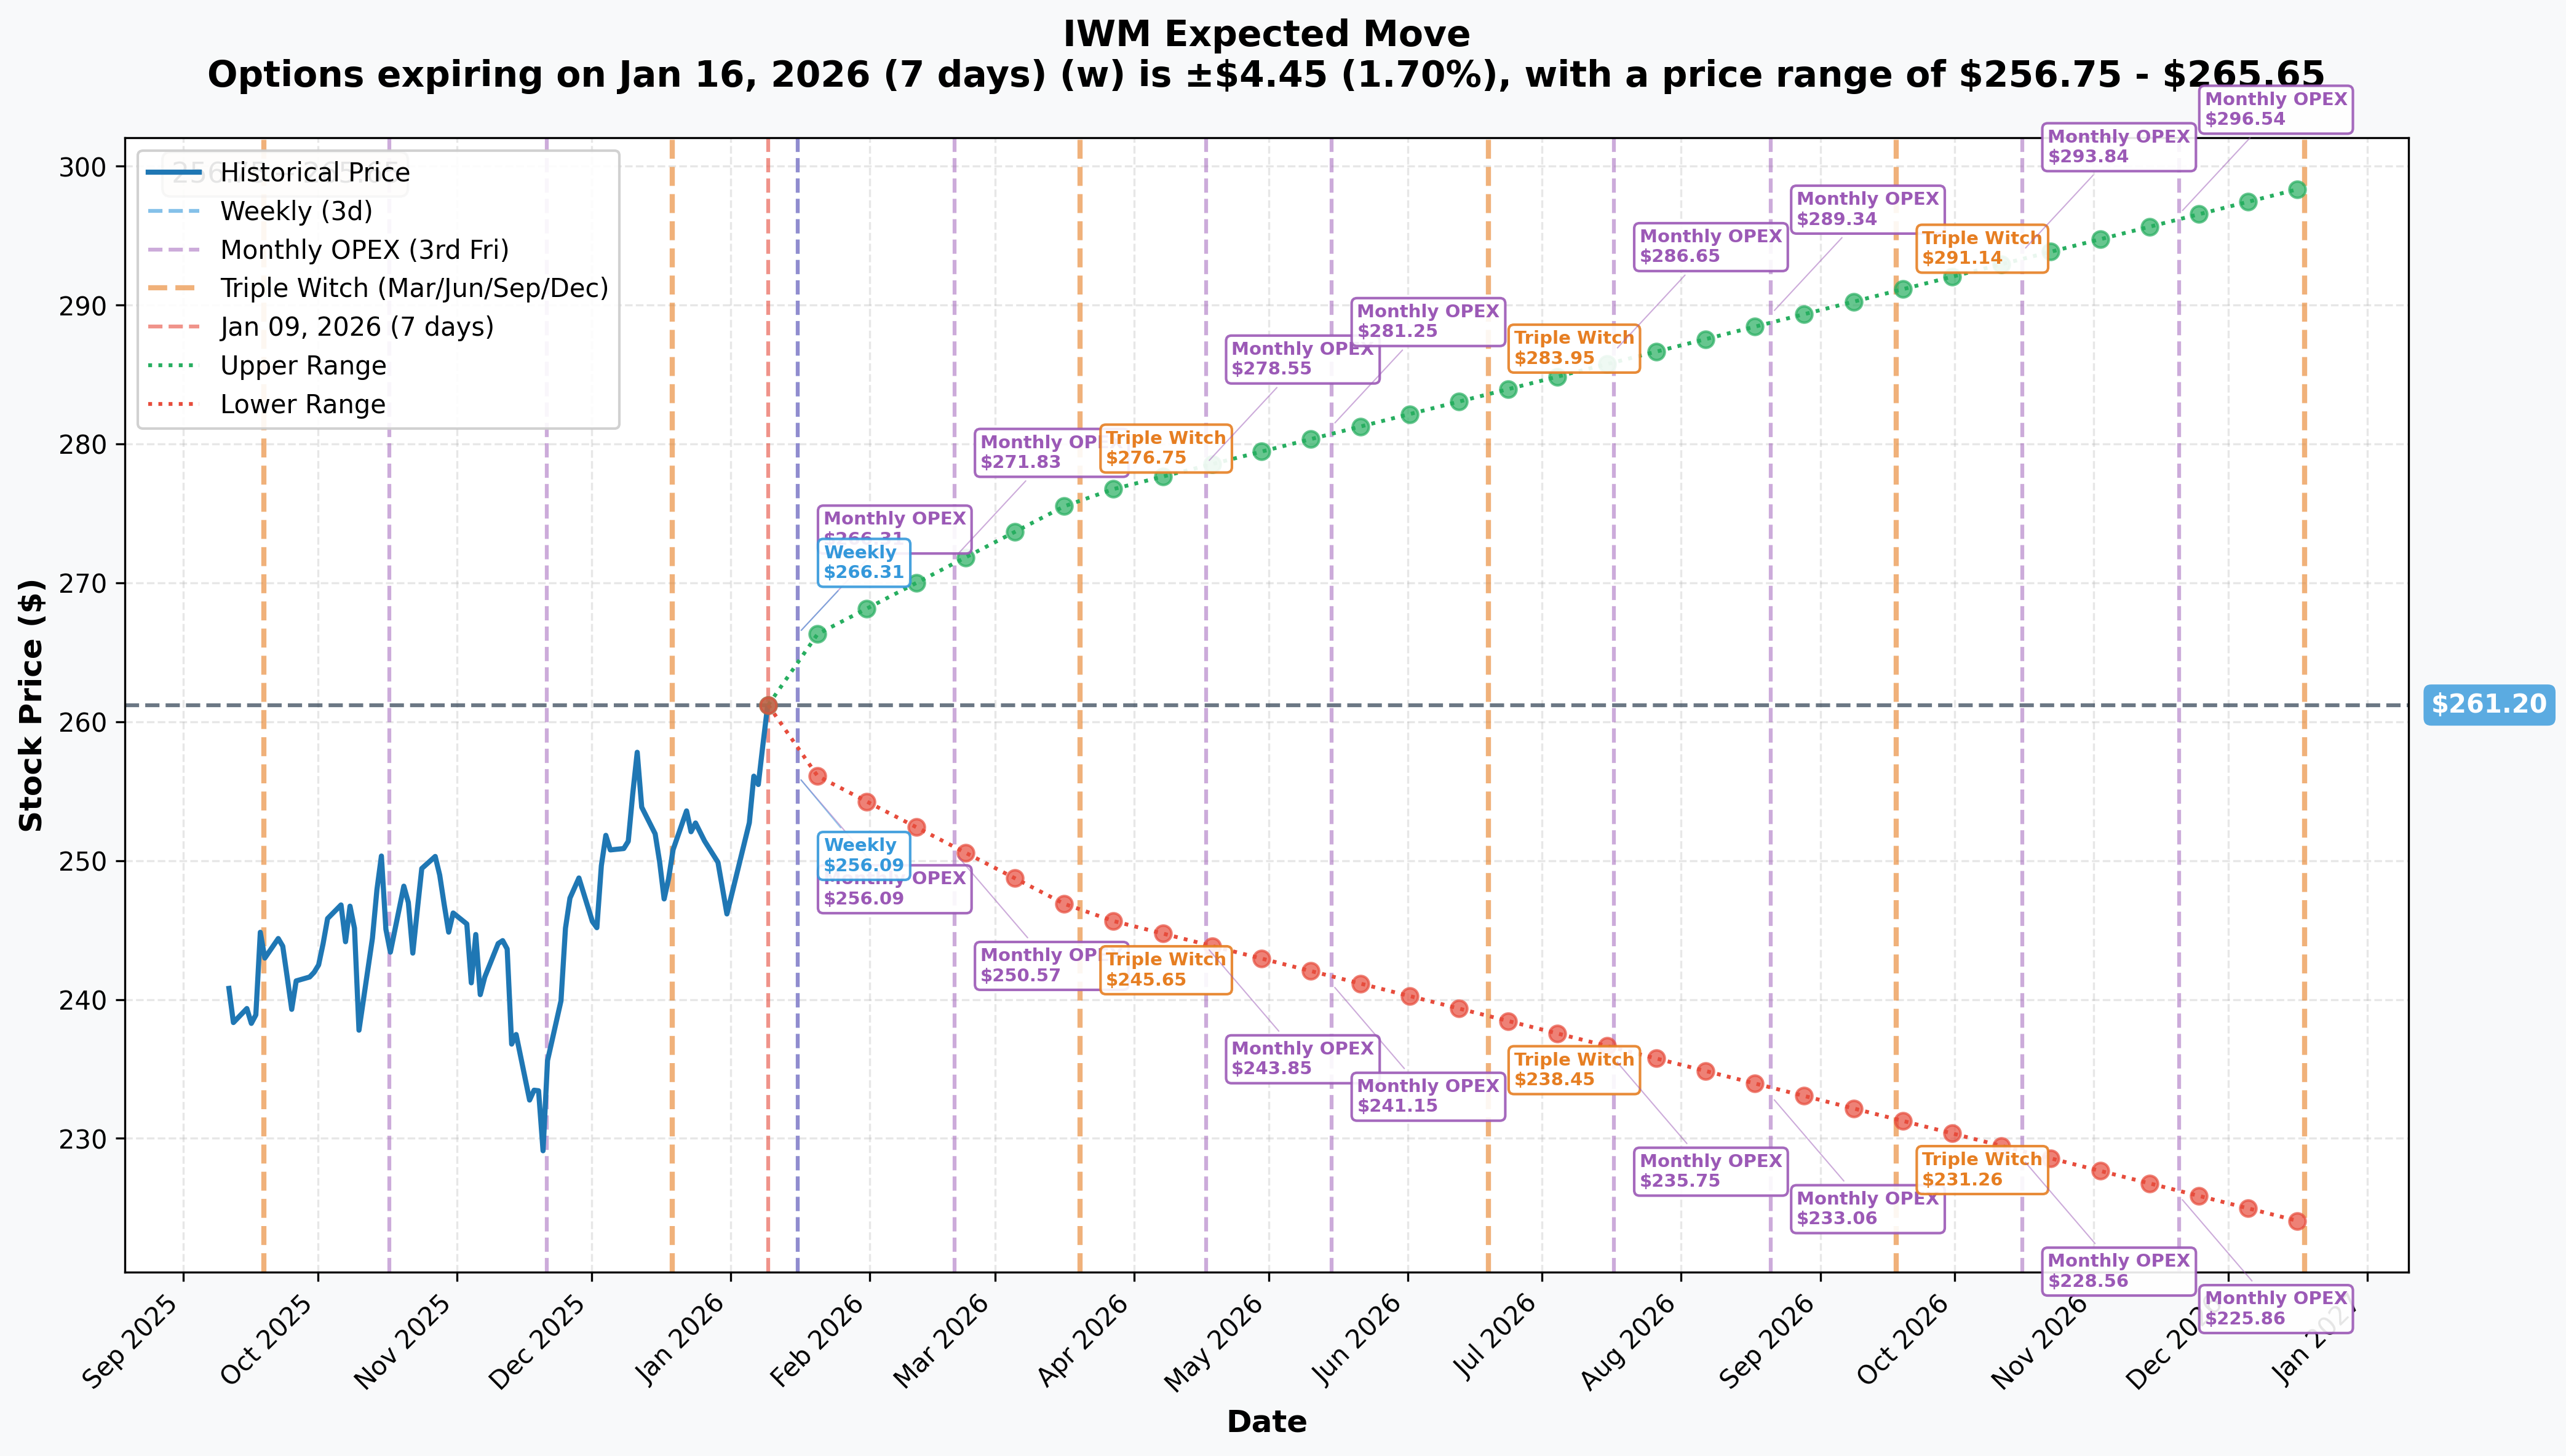
Options are pricing in these expected ranges:
| Timeframe | Expiry | Implied Move | Range |
|---|---|---|---|
| Weekly | Jan 16 | +/-1.7% (+/-$4.45) | $256.75 - $265.65 |
| Feb OPEX | Feb 20 | +/-4.1% (+/-$10.63) | $250.57 - $271.83 |
| Triple Witch | Mar 20 | +/-5.7% (+/-$14.98) | $246.22 - $276.18 |
| LEAPS | Dec 18 | +/-14.3% (+/-$37.30) | $223.90 - $298.50 |
Key Insight for the Trade:
- The $246 long put strike is at the LOWER END of the March Triple Witch implied range ($246.22)
- The $249 short put strike is within the Feb OPEX lower range ($250.57)
- This trader is betting we DON'T hit those levels by February 20
Catalysts
Recent Events (Already Happened)
| Date | Event | Impact |
|---|---|---|
| Jan 8, 2026 | Russell 2000 All-Time High | Record 2,603.90 - bullish breakout |
| Jan 7, 2026 | 2.4% Intraday Sell-off | FOMC minutes showed "deep divisions" |
| Late 2025 | Fed Cut Rates 3x | 75bps total cuts, now at 3.50-3.75% |
| Jan 1-7, 2026 | January Effect Rally | +6.2% in first week |
Upcoming Events
| Date | Event | Expected Impact |
|---|---|---|
| Jan 27-28, 2026 | FOMC Meeting | Hold expected (16% cut probability) - could be volatile |
| Late Jan-Mar | Q4 Earnings Season | Small-cap earnings growth 17-22% expected |
| Feb 20, 2026 | Monthly OPEX (Trade Expiration!) | Gamma pinning likely |
| March 2026 | Next FOMC | ~30% cut probability |
| June 2026 | Russell Reconstitution | First semi-annual rebalance |
| Nov 2026 | Midterm Elections | Policy uncertainty historically choppy |
Price Targets & Probabilities
Based on gamma levels, implied move data, and catalyst timing:
Bull Case: $270 (+3.6%)
Probability: 30%
- Requires break above $265 resistance (heavy call gamma)
- Would need dovish FOMC language or strong earnings
- Gamma support at $260 acting as floor
- Implied move for Feb 20 tops out at $271.83 - this is the ceiling
Base Case: $255-$265 (Range-bound)
Probability: 50%
- Strongest gamma support at $260 keeps dips shallow
- Resistance at $265 caps upside
- High gamma environment = volatility compression
- Perfect for the credit spread trade structure
Bear Case: $245-$250 (-4% to -6%)
Probability: 20%
- Would require hawkish Fed surprise or earnings disappointment
- $250 strike flips to negative gamma = accelerated selling
- $246 long put strike aligns with March Triple Witch lower range
- ~40% of Russell 2000 companies unprofitable = vulnerability
Trading Ideas
Conservative: "The Insurance Policy"
Strategy: Buy IWM Feb 20 $255 Put
- Cost: ~$3.50-$4.00 per contract
- Max Loss: Premium paid ($350-$400 per contract)
- Breakeven: $251-$251.50
- Why This Works: Pure downside protection if you're long small caps. The $255 level sits below gamma support at $260 but above the major $250 level. If the January Effect reverses, you're covered.
Balanced: "The Flow Follower"
Strategy: Bear Put Spread - Buy $248P / Sell $245P Feb 20
- Cost: ~$0.80-$1.00 debit
- Max Gain: $3 spread width - cost = ~$2.00-$2.20
- Max Loss: Premium paid
- Breakeven: $247-$247.20
- Why This Works: Follows the institutional flow but on a smaller scale. If IWM drops to implied move support near $250, you profit. Limited risk, defined outcome.
Aggressive: "The Contrarian Call"
Strategy: Buy IWM Feb 20 $265 Call
- Cost: ~$4.50-$5.00 per contract
- Max Loss: Premium paid
- Breakeven: $269.50-$270
- Why This Works: Going against the put spread flow. If the Fed's Miran is right about needing 100+ bps of cuts in 2026, small caps could rip higher. The "Great Rotation" into small-caps continues, and $265 is just 1.6% away.
Risk Factors
For the Detected Trade:
- Credit Spread Risk: Max loss of $10.8M if IWM drops below $246 by expiration
- FOMC Wildcard: January 28 meeting could trigger sharp moves either direction
- Sticky Inflation: Core inflation stuck at 3% could force hawkish Fed stance
For IWM in General:
- Zombie Companies: ~40% of Russell 2000 unprofitable - vulnerable to credit stress
- 2026 Refinancing Wall: Many small caps face debt maturities at higher rates
- Tariff Uncertainty: Supreme Court weighing Trump tariff powers
- Put/Call Ratio at 2.37: Elevated bearish positioning per Fintel
- Midterm Year Volatility: 2026 historically choppy for equities
The Bottom Line
Here's the deal: A major player just laid down $14.7M in premium on a bear put spread, but structured it to COLLECT $1.7M upfront. That's not a panic move - that's a sophisticated hedge from someone who's probably long small caps and wants protection while earning income.
What does this mean for you?
If you're bullish on small caps: The gamma structure supports your thesis. Massive support at $260, bullish net GEX, and strong momentum. But consider adding hedges here - the smart money is.
If you're bearish: Wait for a break below $260 (strongest support). If that goes, $250-$245 becomes the target zone. The Feb 20 puts at $248-$246 offer defined risk ways to play downside.
If you're neutral: This is actually a great environment for selling premium. High implied volatility, strong gamma support, and a trader just showed you their playbook - sell puts against long puts for credit.
Mark Your Calendar: January 28 FOMC is the key event before this trade expires. If the Fed sounds dovish, IWM rallies and this trade prints. If they're hawkish, watch $255-$250 for potential entries.
More IWM analysis at Ainvest
Disclaimer: This analysis is for informational purposes only and does not constitute investment advice. Options trading involves significant risk and is not suitable for all investors. You could lose your entire investment. Always do your own research and consult with a qualified financial advisor before making any investment decisions.