IWM Massive $16.3M Put Position Unwind - Institutional Profit-Taking at Small-Cap Peak!
January 20, 2026 | Unusual Activity Detected
The Quick Take
Someone just closed out $16.3 million worth of Russell 2000 put positions in two massive trades this morning! These BTC (buy-to-close) orders on February 20th expiration puts suggest big money is locking in profits from hedges or bearish bets placed during the "Great Rotation" rally. With IWM hitting new 52-week highs around $265-266, institutional players are taking chips off the table right as small caps surge to their strongest start in over a decade. Translation: The hedgers are closing their insurance policies - they no longer expect a crash!
ETF Overview
iShares Russell 2000 ETF (IWM) is the most widely-traded small-cap index ETF, tracking 1,951-1,966 small-cap U.S. stocks:
- Current Price: $261.94-$263.11 (near 52-week high of $267.22)
- 52-Week Range: $171.73 - $267.22
- YTD Performance: +7.79% to +7.92% (strongest start since 2015)
- Total AUM: ~$73.7 billion
- Expense Ratio: 0.19%
- P/E Ratio: 18.11x (31% cheaper than S&P 500)
- Shares Outstanding: ~291.8 million
The Russell 2000 represents small-cap America - think regional banks, biotech startups, small manufacturers, and local service companies. Unlike mega-cap tech, these are domestic-focused businesses that benefit from lower interest rates and a strong U.S. economy.
The Option Flow Breakdown
What Just Happened
The Tape (January 20, 2026):
| Date | Time | Symbol | Buy/Sell | Call/Put | Expiration | Premium | Strike | Volume | OI | Size | Spot Price | Option Price | Option Symbol |
|---|---|---|---|---|---|---|---|---|---|---|---|---|---|
| 2026-01-20 | 09:34:09 | IWM | BUY | PUT | 2026-02-20 | $9,000,000 | $253 | 35,000 | 70,000 | 28,000 | $261.94 | $3.23 | IWM20260220P253 |
| 2026-01-20 | 09:34:09 | IWM | BUY | PUT | 2026-02-20 | $7,300,000 | $250 | 29,000 | 9,500 | 28,000 | $261.98 | $2.59 | IWM20260220P250 |
Combined activity: $16.3 million in put premium, 64,000 contracts total volume
What This Actually Means
These are buy-to-close (BTC) orders on existing short put positions. Let me break this down:
Trade #1 - $253 Strike Puts ($9M):
- Action: Closing existing put position
- Volume vs OI: 35,000 volume vs 70,000 OI
- Signal: Someone is exiting a bearish position
Trade #2 - $250 Strike Puts ($7.3M):
- Action: Closing existing put position
- Volume vs OI: 29,000 volume vs 9,500 OI (volume 3x open interest!)
- Signal: Major position closure happening here
Translation for regular folks: Back when IWM was lower (or when markets were nervous), someone bought these put options as downside protection betting small caps would fall. Now with IWM surging to 52-week highs during the "Great Rotation" into small caps, these hedges are underwater and the trader is closing them out. The $250 strike trade is particularly notable - volume exceeded open interest by 3x, suggesting this was a major fund unwinding a significant hedge position.
Why this matters: When institutional hedgers close their downside protection, it's often a signal they no longer expect a crash. However, it could also mean they're freeing up capital for other opportunities. Either way, $16.3 million in put closure activity right at new highs is noteworthy positioning data.
Technical Setup / Chart Check-Up
YTD Chart
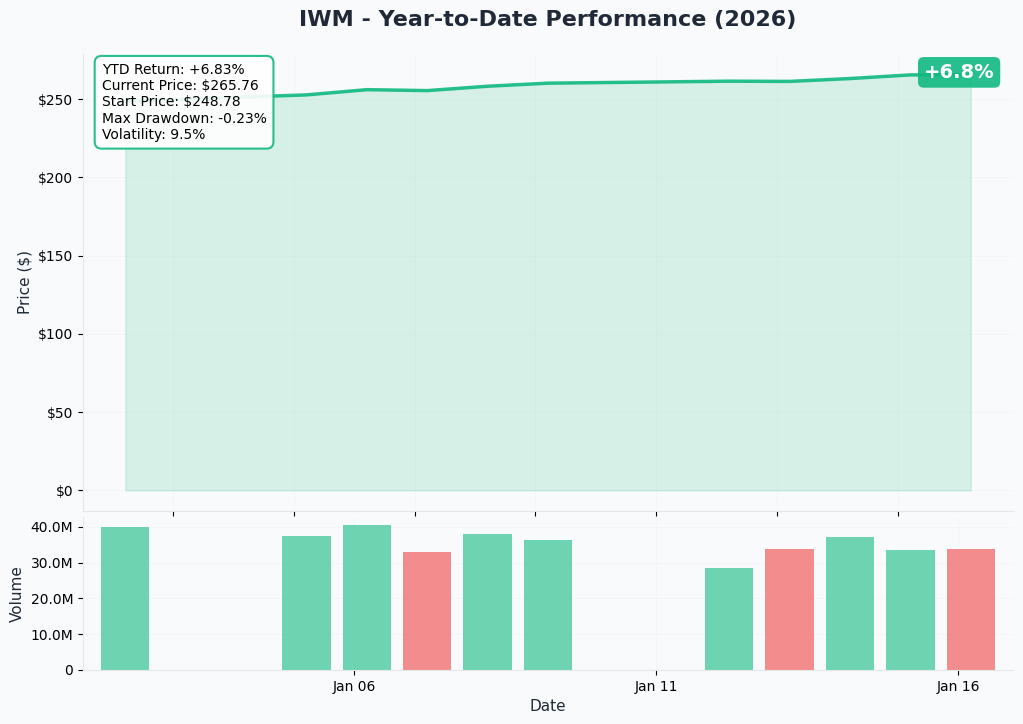
IWM is having its best start to a year in over a decade. The "Great Rotation" from mega-cap tech to domestic small caps has pushed the Russell 2000 to fresh highs, outperforming the Nasdaq 100 by nearly 4 percentage points YTD.
Key observations:
- Strong momentum since October 2025 Fed rate cuts
- Broke through previous resistance at $260 level
- Trading near 52-week highs with bullish structure
- Volume patterns suggest institutional accumulation
Gamma-Based Support & Resistance Analysis
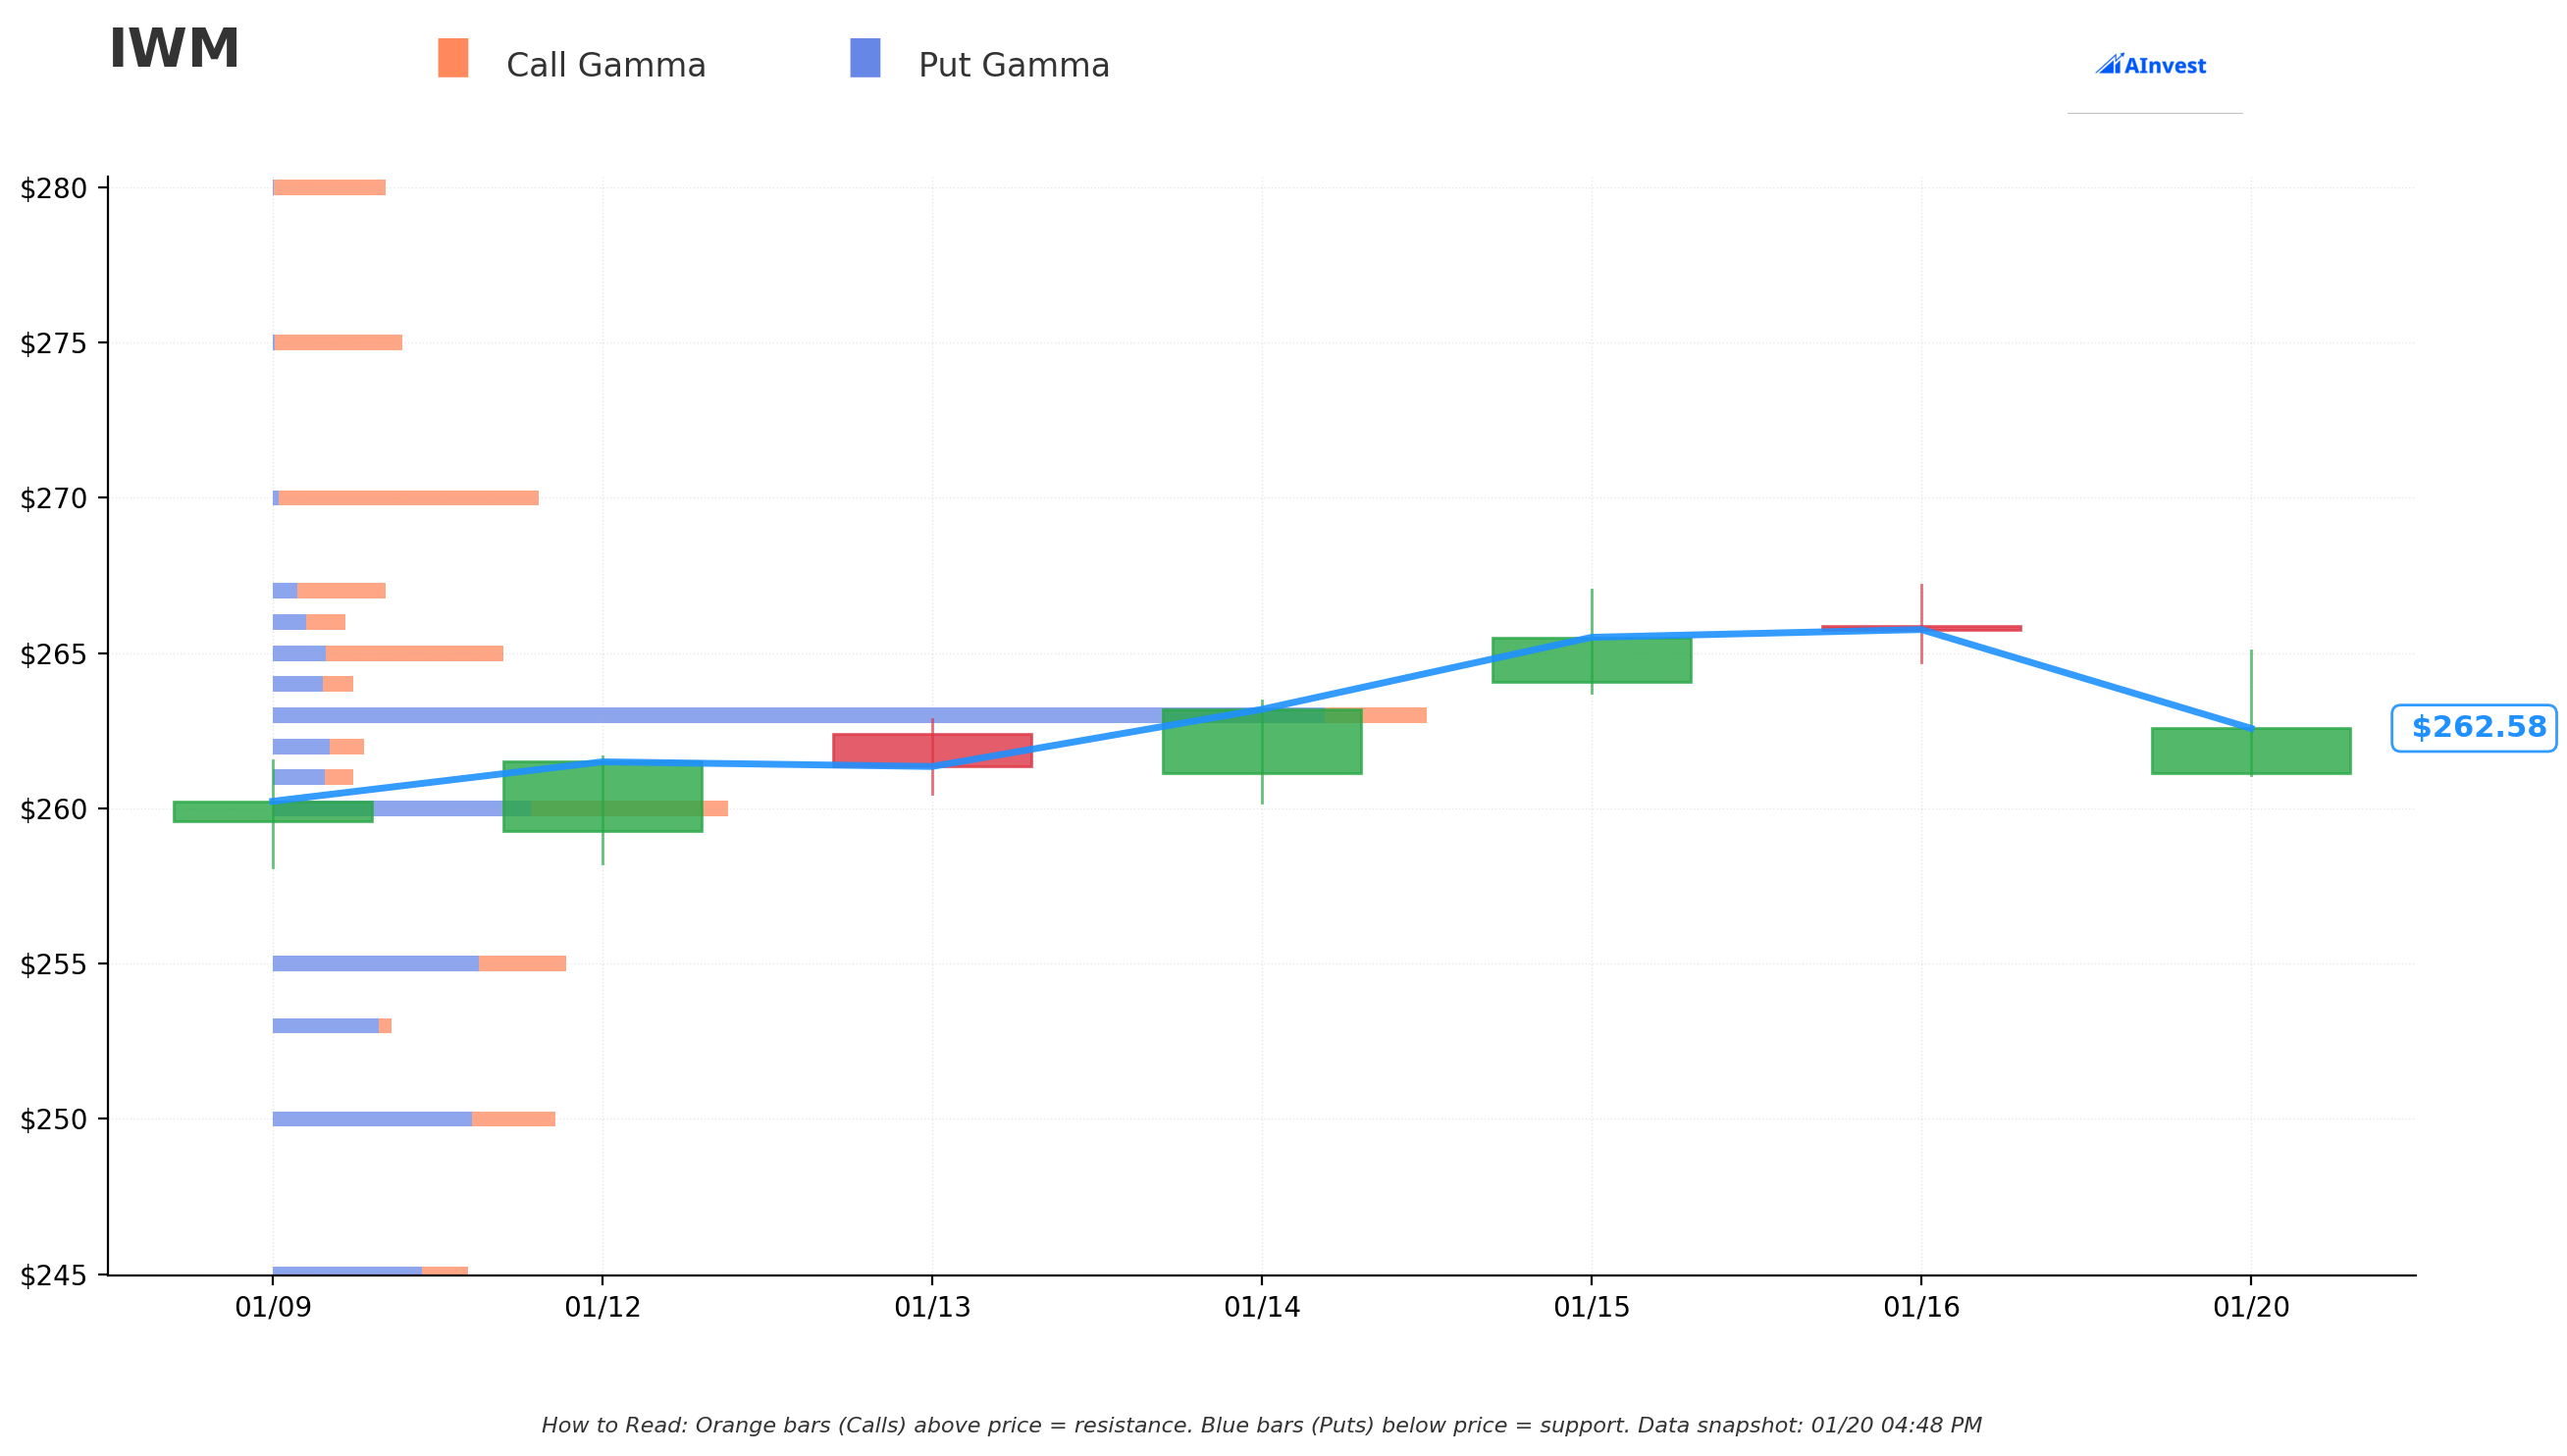
Current Price: $263.11
The gamma exposure map reveals where market makers will buy or sell to hedge their option positions:
Support Levels (Put Gamma - Blue Bars):
- $263 - Immediate support with 347.5B total gamma exposure (strongest nearby level!)
- $260 - Major floor with 184.0B gamma (dealers will buy dips here)
- $255 - Secondary support at 119.0B gamma
- $250 - Deep support with 114.7B gamma
- $245 - Extended support at 79.7B gamma
- $240 - Final support zone at 78.0B gamma
Resistance Levels (Call Gamma - Orange Bars):
- $264 - Immediate resistance with 49.8B gamma
- $265 - Nearby ceiling at 104.4B gamma
- $270 - Major resistance with 108.8B gamma (strongest above price!)
- $275 - Extended resistance at 52.8B gamma
What this means for traders: The gamma data shows IWM has strong support immediately below at $263 and major support at $260. Above, resistance clusters at $265-$270. The Net GEX Bias is Bearish (825B call gamma vs 1,310B put gamma), suggesting market makers are positioned for potential downside. This creates natural buying pressure if IWM dips, but could also mean dealers are hedging for a pullback.
Translation: Strong floor at $260-$263, but breaking above $270 requires significant buying pressure. The current price sits in a "pinned" zone between support and resistance.
Implied Move Analysis
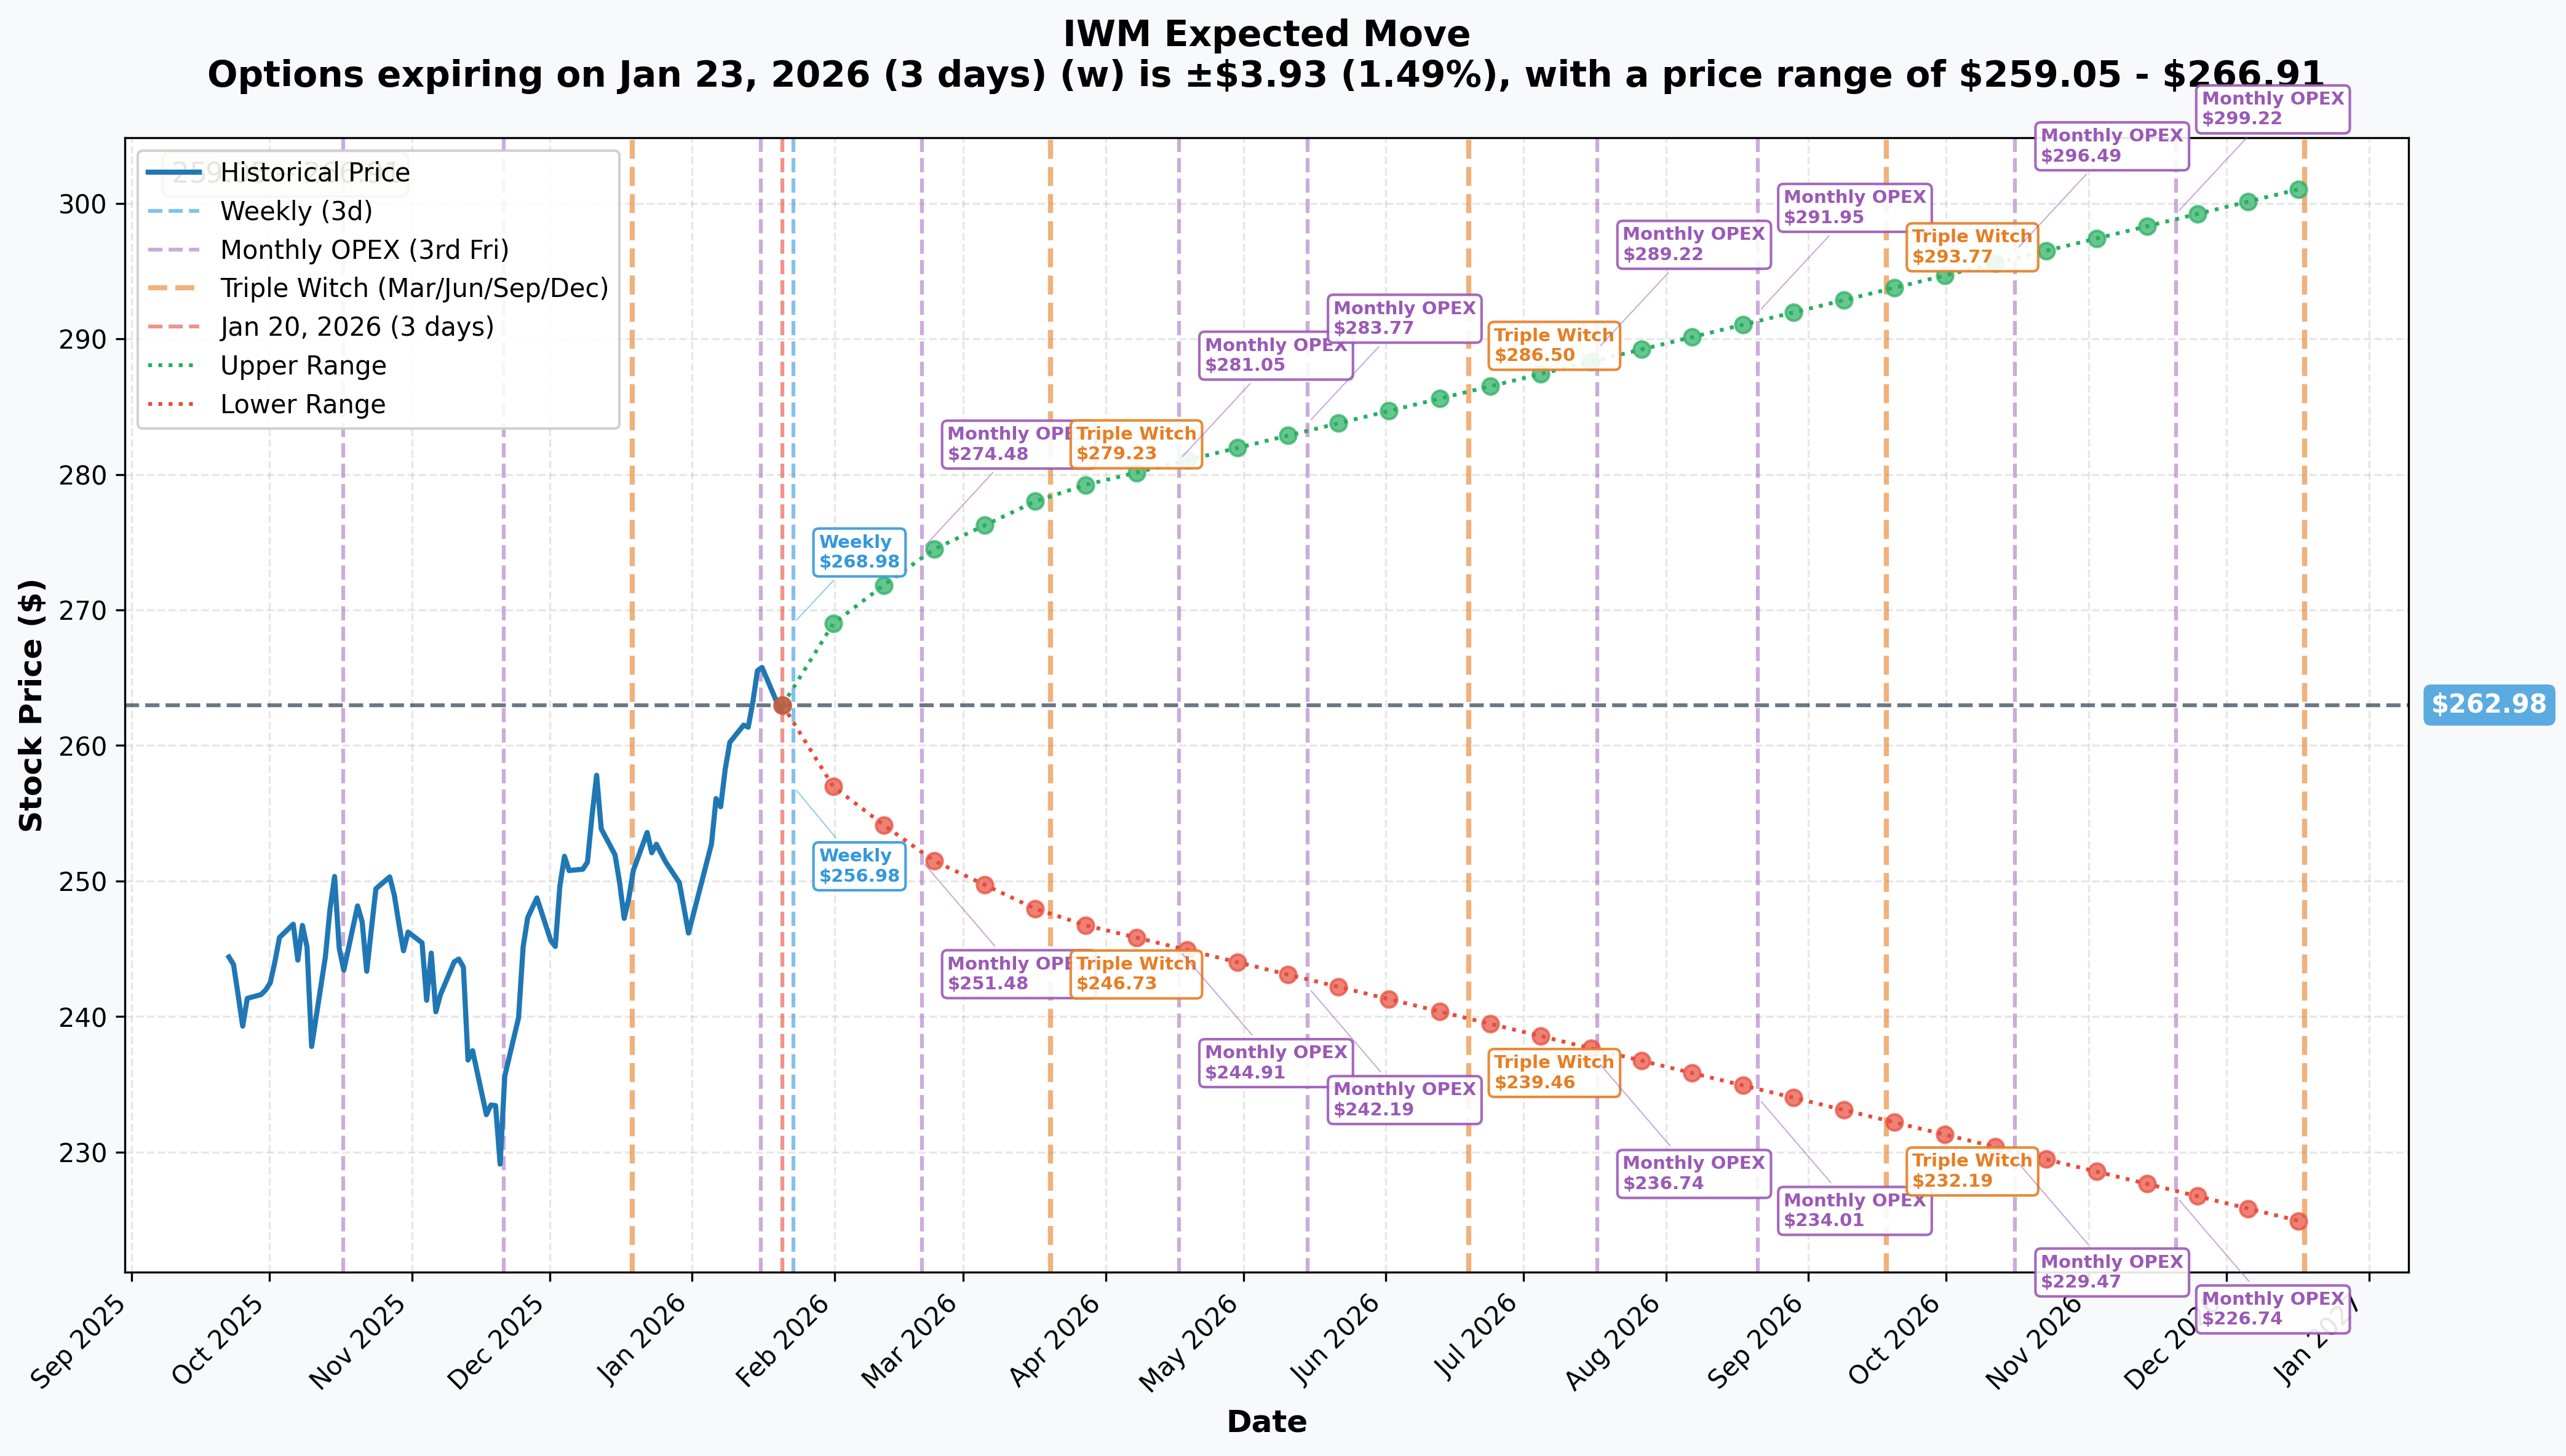
Options market pricing for upcoming expirations:
| Timeframe | Expiry Date | Days to Expiry | Implied Move % | Implied Move $ | Upper Range | Lower Range |
|---|---|---|---|---|---|---|
| Weekly | 2026-01-23 | 3 | 1.49% | $3.93 | $266.91 | $259.05 |
| Monthly OPEX | 2026-02-20 | 31 | 4.25% | $11.18 | $274.16 | $251.80 |
| Quarterly (Triple Witch) | 2026-03-20 | 59 | 5.96% | $15.67 | $278.65 | $247.31 |
| Yearly LEAPS | 2026-12-18 | 332 | 14.53% | $38.22 | $301.20 | $224.76 |
Translation for regular folks: Options traders are pricing in a 1.5% move ($4) by this Friday and a 4.25% move ($11) through February OPEX. That's moderate volatility for an index ETF. The February 20th expiration (where today's massive trades occurred) has an expected range of $251.80-$274.16. Those $250 and $253 puts being closed were trading near the lower end of expected move territory.
By year-end, the market expects IWM could move anywhere from $225 to $301 - a wide range reflecting uncertainty about whether the small-cap rally continues or reverses.
Catalysts
Already Happened (Driving Current Rally)
The "Great Rotation" Begins (January 2026) The long-awaited rotation from mega-cap tech to domestic small caps has materialized with historic intensity. According to Financial Content, the Russell 2000 surged 5.8% YTD through mid-January, marking its strongest opening to a year in over a decade. Key drivers:
- Record-breaking outperformance vs S&P 500 (longest streak since 2008)
- New all-time highs reached in January 2026
- Valuation gap at 25-year extreme finally closing
Federal Reserve Rate Cuts (September-December 2025) The Fed delivered three consecutive 0.25% rate cuts in late 2025, bringing the federal funds rate to 3.50%-3.75%. This significantly reduced borrowing costs for small-cap companies with floating-rate debt, unlocking growth opportunities.
Q4 2025 Economic Strength
- GDP Growth: 5.3% annualized rate in Q4 2025
- Jobless Claims: 198,000 weekly - second-lowest in two years
- Full-Year 2025 Return: Russell 2000 posted approximately 12.8% total return
Upcoming Catalysts
FOMC Meeting - January 27-28, 2026 (1 WEEK AWAY!) The Fed meets next week with 84% probability of holding rates at current levels. Philadelphia Fed President Anna Paulson sees room for further cuts later in 2026. Small caps are highly sensitive to rate expectations.
Small-Cap Earnings Season (Q1 2026) Consensus forecasts project 15.4-22% earnings growth for small caps vs 14-15% for S&P 500. Bank of America expects 17% growth for small caps vs 14% for large caps. The earnings delta favors small-cap outperformance.
Russell Index Reconstitution - June 2026 FTSE Russell announced a historic shift to semi-annual reconstitution effective 2026. The June full reconstitution and new December semi-annual rebalance could create significant trading opportunities around these dates.
M&A Activity Catalyst Record private equity dry powder suggests increased acquisition activity targeting Russell 2000 companies. Per Financial Content, the S&P Small Cap 600 trades at 15.6x vs 22.6x for S&P 500 (31% discount), making small caps attractive takeover targets.
Key Dates to Watch:
| Date | Event | Potential Impact |
|---|---|---|
| January 27-28, 2026 | FOMC Meeting | Rate decision (expected hold) |
| February 2026 | Q4 Earnings Season | Small-cap earnings validation |
| March 2026 | FOMC Meeting | First potential 2026 cut |
| June 2026 (Fourth Friday) | Russell Reconstitution | Annual rebalancing |
| September 2026 | FOMC Meeting | Expected rate cut priced in |
| December 2026 (Second Friday) | Semi-Annual Reconstitution | NEW in 2026 |
Price Targets & Probabilities
Based on gamma levels, implied move data, and catalyst analysis:
Bull Case (35% probability)
Target: $275-$285
How we get there:
- Fed signals additional rate cuts, small-cap rally extends
- Q4 earnings confirm 17-22% growth projections
- M&A activity accelerates, creating bid under small caps
- Great Rotation continues with institutional reallocation
- Break through $270 gamma resistance triggers momentum buying
Supporting evidence: Wall Street consensus from Bank of America, JPMorgan, BTIG, and Polar Capital projects 15-30% upside for Russell 2000 in 2026.
Base Case (45% probability)
Target: $255-$270 range
Most likely scenario:
- Trading within strong gamma support ($260) and resistance ($270) bands
- Consolidation after strong YTD rally
- Earnings growth solid but already priced in
- Fed holds rates, provides gradual cuts later in year
- Put/call ratio remains elevated indicating hedging continues
This aligns with today's trade: Closing puts at $250-$253 suggests traders don't expect a crash to those levels, but the bearish net GEX bias indicates caution about further upside near-term.
Bear Case (20% probability)
Target: $240-$250
What could go wrong:
- 40% of Russell 2000 constituents remain unprofitable - highest since COVID
- $709 billion refinancing wall in 2026-27 creates bankruptcy risk
- Tariff volatility under Trump administration disrupts markets
- RSI above 70 indicates overbought conditions
- Fed pause on sticky inflation sends small caps lower
- Recession probability at 20-35% per major banks
Key support: Strong put gamma at $250-$260 should limit downside unless fundamentals deteriorate significantly.
Trading Ideas
Conservative: The "Wait for Pullback" Strategy
Play: Stay patient, wait for entry at gamma support
Why this works:
- IWM already up 7.9% YTD and trading near 52-week highs
- Put/call ratio at 2.0-2.37 shows elevated hedging - smart money is cautious
- Strong gamma support at $260 provides better risk/reward entry
- FOMC meeting next week could create volatility
Action plan:
- Set alerts at $260 and $255 support levels
- If pullback occurs, consider buying IWM shares or March calls
- Target $270-$275 on rebound (8-12% upside from support)
- Stop loss at $250 (gamma floor)
Risk level: Low | Skill level: Beginner-friendly
Balanced: Post-FOMC Call Spread
Play: After FOMC, buy bull call spread targeting gamma resistance
Structure: Buy $265 calls / Sell $275 calls (March 20 Triple Witch expiration)
Why this works:
- FOMC meeting January 27-28 likely holds rates but could provide dovish guidance
- Triple Witch expiration provides 59 days for trade to work
- Defined risk spread limits downside to debit paid
- $275 target aligns with bull case and gamma resistance breakthrough
- Implied move suggests $278.65 upper range by March
Estimated P&L:
- Entry: ~$3-4 debit per spread ($300-400 risk)
- Max profit: $600-700 if IWM above $275 at expiration
- Breakeven: ~$268-269
- Max loss: Premium paid if IWM below $265
Entry timing: Wait until after FOMC meeting for rate path clarity
Risk level: Moderate | Skill level: Intermediate
Aggressive: Bullish Put Credit Spread (The "Great Rotation" Bet)
Play: Sell put spread below gamma support to collect premium
Structure: Sell $255 puts / Buy $250 puts (February 20 expiration - same as today's trades)
Why this works:
- Collects premium betting IWM stays above strong $255 support
- Today's massive put closure at $250-$253 suggests institutional confidence at those levels
- February expiration gives 31 days for theta decay
- Support at $255-$260 from gamma and implied move data
Estimated P&L:
- Collect: ~$1.50-2.00 credit per spread ($150-200)
- Max profit: Keep full credit if IWM above $255 at expiration
- Max loss: $300-350 (spread width minus credit)
- Breakeven: ~$253-253.50
Warning: If small-cap rally reverses, $250 support could be tested. Only take this trade if you believe the Great Rotation continues.
Risk level: Higher | Skill level: Intermediate-Advanced
Risk Factors
Don't get caught by these potential landmines:
-
40% of Russell 2000 companies are unprofitable: According to Fortune, this is the highest proportion since COVID and roughly double 2008 crisis levels. Another 25% are "zombie companies" where operating income doesn't cover interest expenses.
-
$709 billion refinancing wall in 2026-27: Per Investing.com analysis, Russell 2000 companies face $368B in 2026 maturities and $341B in 2027. Cost of capital exceeds ROIC for nearly half of the small-cap universe.
-
Tariff and trade policy volatility: Under the Trump administration, average effective tariff rate sits at 11.2% - highest since 1943. Supreme Court is reviewing IEEPA tariff legality with ruling expected early 2026. While small caps are relatively domestic-focused, trade uncertainty creates market volatility.
-
Technical overbought conditions: RSI(14) at 72.17 indicates overbought territory. Previous approaches to 2,500 resistance triggered sharp pullbacks. Bollinger Band broke above upper band on January 9, 2026.
-
Elevated put/call ratios signal caution: Put/call ratio at 2.0-2.37 indicates significant bearish positioning or hedging activity. Put open interest at 7.1 million contracts is above 52-week average.
-
Interest rate sensitivity: Small caps carry higher levels of floating-rate debt. Fed pause or reversal would disproportionately hurt this segment. "Higher-for-longer" inflation remains a risk according to recent analysis.
-
Recession risk persists: Probability estimates vary from 20% (Goldman Sachs) to 35% (J.P. Morgan). Trade wars, sticky inflation, and weakening labor market are key risks. Small caps historically underperform during recessions.
-
Net fund outflows despite rally: Despite the YTD surge, IWM has seen $2.75B in 1-month outflows and $5.89B in 1-year outflows. This divergence between price and flows suggests some investors are selling strength.
The Bottom Line
Here's the deal: Two massive trades totaling $16.3 million just closed out bearish put positions right as small caps hit their strongest start to a year in over a decade. This isn't someone getting bullish - it's profit-taking on hedges that worked or unwinding protection that's no longer needed.
What these trades tell us:
- Institutional hedgers no longer expect a crash to $250-$253 levels
- They're freeing up capital, possibly to redeploy elsewhere
- The "Great Rotation" momentum has reduced perceived downside risk
- However, they're not adding bullish exposure either - just closing hedges
If you own IWM or small-cap stocks:
- Strong gamma support at $260-$263 provides cushion
- Consider holding through FOMC meeting for rate guidance
- Take some profits at $270+ resistance if you're overweight
- Watch the February expiration ($251.80-$274.16 expected range)
If you're watching from the sidelines:
- January 27-28 FOMC meeting is next major catalyst - mark your calendar
- Pullback to $260 support would be attractive entry point
- Earnings season will validate if 17-22% growth projections are realistic
- M&A activity and June reconstitution provide longer-term catalysts
If you're bearish:
- Elevated put/call ratio (2.0+) validates your concerns
- 40% unprofitable constituents and refinancing wall are real risks
- Consider put spreads below $255 support for defined-risk downside plays
- Wait for technical breakdown below $260 before getting aggressive
Final verdict: The massive put closure suggests institutional hedgers are less worried about downside, but the bearish net gamma exposure and elevated put/call ratios indicate the market isn't all-in bullish either. Small caps have had an incredible run, and the fundamental case for outperformance (cheaper valuations, higher earnings growth, rate cuts) remains intact. However, 40% unprofitable companies and a $709 billion refinancing wall are genuine risks. The smart play is patience - let the FOMC meeting provide clarity and look for pullbacks to strong support at $260 for better entry points.
Key dates:
- January 27-28, 2026 - FOMC Meeting (rate decision)
- February 20, 2026 - Monthly OPEX (today's trades expiration)
- March 20, 2026 - Triple Witch (quarterly expiration)
- June 2026 (Fourth Friday) - Russell Annual Reconstitution
- December 2026 (Second Friday) - NEW Semi-Annual Reconstitution
Disclaimer: Options trading involves substantial risk of loss and is not suitable for all investors. This analysis is for educational purposes only and not financial advice. Past performance doesn't guarantee future results. ETFs can decline in value and you could lose your entire investment. Always do your own research and consider consulting a licensed financial advisor before trading.
About iShares Russell 2000 ETF (IWM): IWM is the most widely-traded small-cap index ETF with ~$73.7 billion in assets, tracking nearly 2,000 small-cap U.S. stocks across all sectors. It provides diversified exposure to domestic small-cap companies at a 0.19% expense ratio.