🐻 IWM $10.2M Put Activity - Institutions Hedging Small-Cap Record Highs! 🛡️
📅 January 21, 2026 | 🔥 Unusual Activity Detected
🎯 The Quick Take
Someone just moved $10.2 MILLION in IWM puts this morning at 09:49:04! We're seeing a coordinated institutional adjustment around the $250-$252 strike zone for February 20th expiration - rolling up put protection as the Russell 2000 trades near all-time highs. With IWM up +6.62% YTD and riding "The Great Rotation" away from mega-cap tech, smart money is recalibrating downside protection while small caps are hot. Translation: Institutions are upgrading their insurance policies at the peak of the small-cap rally!
📊 ETF Overview
iShares Russell 2000 ETF (IWM) is the most popular small-cap ETF tracking the Russell 2000 Index - your gateway to 2,000 small-cap U.S. stocks:
- AUM: $77.71 billion
- Expense Ratio: 0.19%
- Current Price: $264.02 (January 20, 2026)
- Dividend Yield: 1.1% - 1.27%
- Holdings: 1,951 stocks diversified across sectors
- Top Sectors: Industrials (17.7%), Healthcare (17.4%), Financials (14.2%)
- 52-Week Range: $171.73 - $267.22
- 52-Week High Date: January 16, 2026 (just 5 days ago!)
Key Observation: IWM hit its 52-week high of $267.22 on January 16, 2026, with the Russell 2000 notching intraday record highs in 10 consecutive sessions through mid-January, according to CNBC.
💰 The Option Flow Breakdown
📊 The Tape (January 21, 2026 @ 09:49:04)
| Time | Symbol | Side | Type | Expiration | Strike | Volume | Premium | Order Type | Strategy | Z-Score | Classification |
|---|---|---|---|---|---|---|---|---|---|---|---|
| 09:49:04 | IWM | BUY | PUT | 2026-02-20 | $252 | 36,000 | $3.5M | BTO | Long Put | 20.9 | EXTREMELY_UNUSUAL |
| 09:49:04 | IWM | SELL | PUT | 2026-02-20 | $250 | 36,000 | $3M | STC | Close Short Put | 2.19 | HIGHLY_UNUSUAL |
| 09:49:04 | IWM | BUY | PUT | 2026-02-20 | $252 | 21,000 | $2M | BTO | Long Put | 11.93 | EXTREMELY_UNUSUAL |
| 09:49:04 | IWM | BUY | PUT | 2026-02-20 | $250 | 21,000 | $1.7M | BTC | Close Long Put | 1.17 | ABOVE_AVERAGE |
Total Premium Moved: $10.2 MILLION
Option Symbols:
- IWM20260220P252 (February 20, 2026 $252 Put)
- IWM20260220P250 (February 20, 2026 $250 Put)
🤓 What This Actually Means
Let me break down what's happening here - this is a sophisticated institutional adjustment:
The 36,000 Contract Block:
- 💸 Bought 36,000 IWM20260220P252 puts for $3.5M - Opening new long put protection at $252 strike
- 🔄 Sold 36,000 IWM20260220P250 puts for $3M - Closing an existing short put position at $250
- 📊 Net cost: $500K to roll UP the strike price by $2 (upgrading protection)
The 21,000 Contract Block:
- 💸 Bought 21,000 IWM20260220P252 puts for $2M - Adding MORE long put protection at $252
- 🔄 Bought to close 21,000 IWM20260220P250 puts for $1.7M - Closing existing long puts at $250
- 📊 Net cost: $300K to roll UP from $250 to $252 strikes
What's really happening: This trader is ROLLING UP their put protection from $250 to $252 strikes. With IWM trading around $264-$267, they're moving their "insurance policy" higher - from 5.7% out-of-the-money to 4.9% out-of-the-money. This signals they want protection to kick in SOONER if the market drops.
Why this matters:
- 🛡️ 57,000 total contracts represent 5.7 million shares worth ~$1.5 BILLION in underlying exposure
- ⏰ 30 days to February 20th OPEX captures potential volatility around Fed meeting (Jan 28-29) and earnings season
- 📈 Rolling UP protection near all-time highs shows defensive posture despite bullish momentum
- 🎯 The $252 strike sits roughly 5% below current price - reasonable downside cushion
Unusual Score Analysis:
- 🔥 Z-Score of 20.9 on the main $252 put buy = happens maybe a few times per year
- 📊 Z-Score of 11.93 on the secondary buy = still highly unusual
- 🐋 Combined 57,000 contracts at $252 strike shows major institutional positioning
📈 Technical Setup / Chart Check-Up
YTD Performance Chart
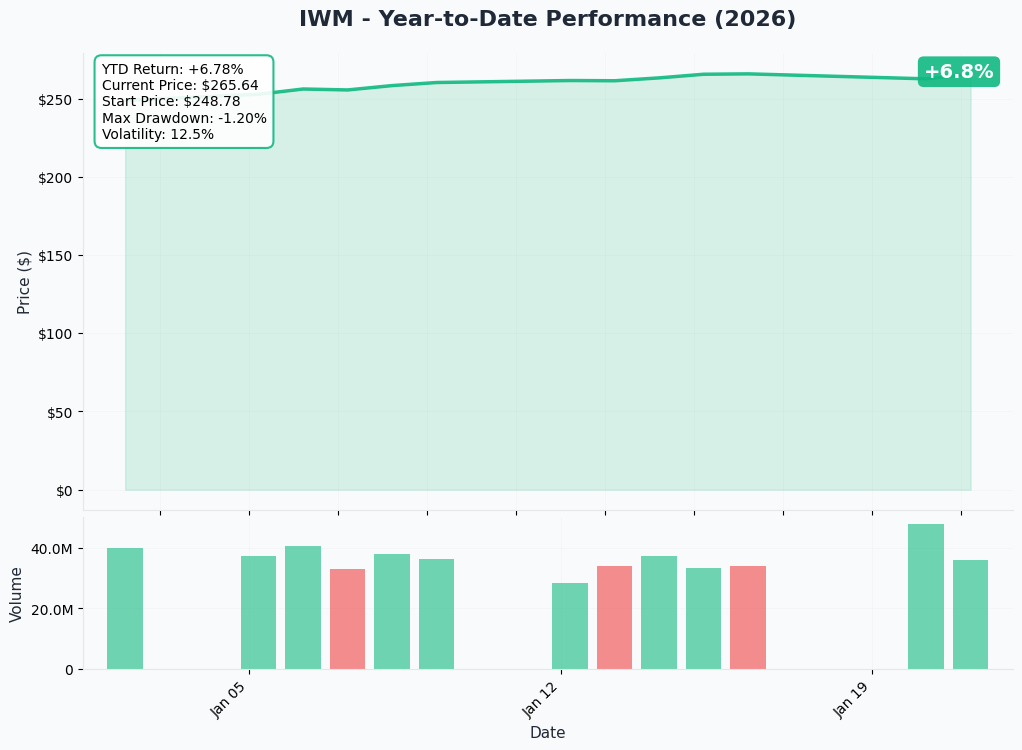
IWM is having a strong start to 2026 - up +6.62% YTD with the Russell 2000 hitting record highs in early January. The chart tells the story of "The Great Rotation" - money flowing from mega-cap tech into small caps as investors seek value.
Key observations:
- 🚀 Record highs: Russell 2000 reached all-time closing high above 2,600 in January
- 📈 Momentum: 10 consecutive days of intraday record highs through January 16
- 🔥 Outperformance: IWM up 7.8% vs S&P 500's 1.5% through mid-January
- ⚠️ Overbought signal: RSI at 71 signals overbought conditions per Equiti
- 📊 Volume surge: Strong institutional buying during January rally
📊 Gamma-Based Support & Resistance Analysis
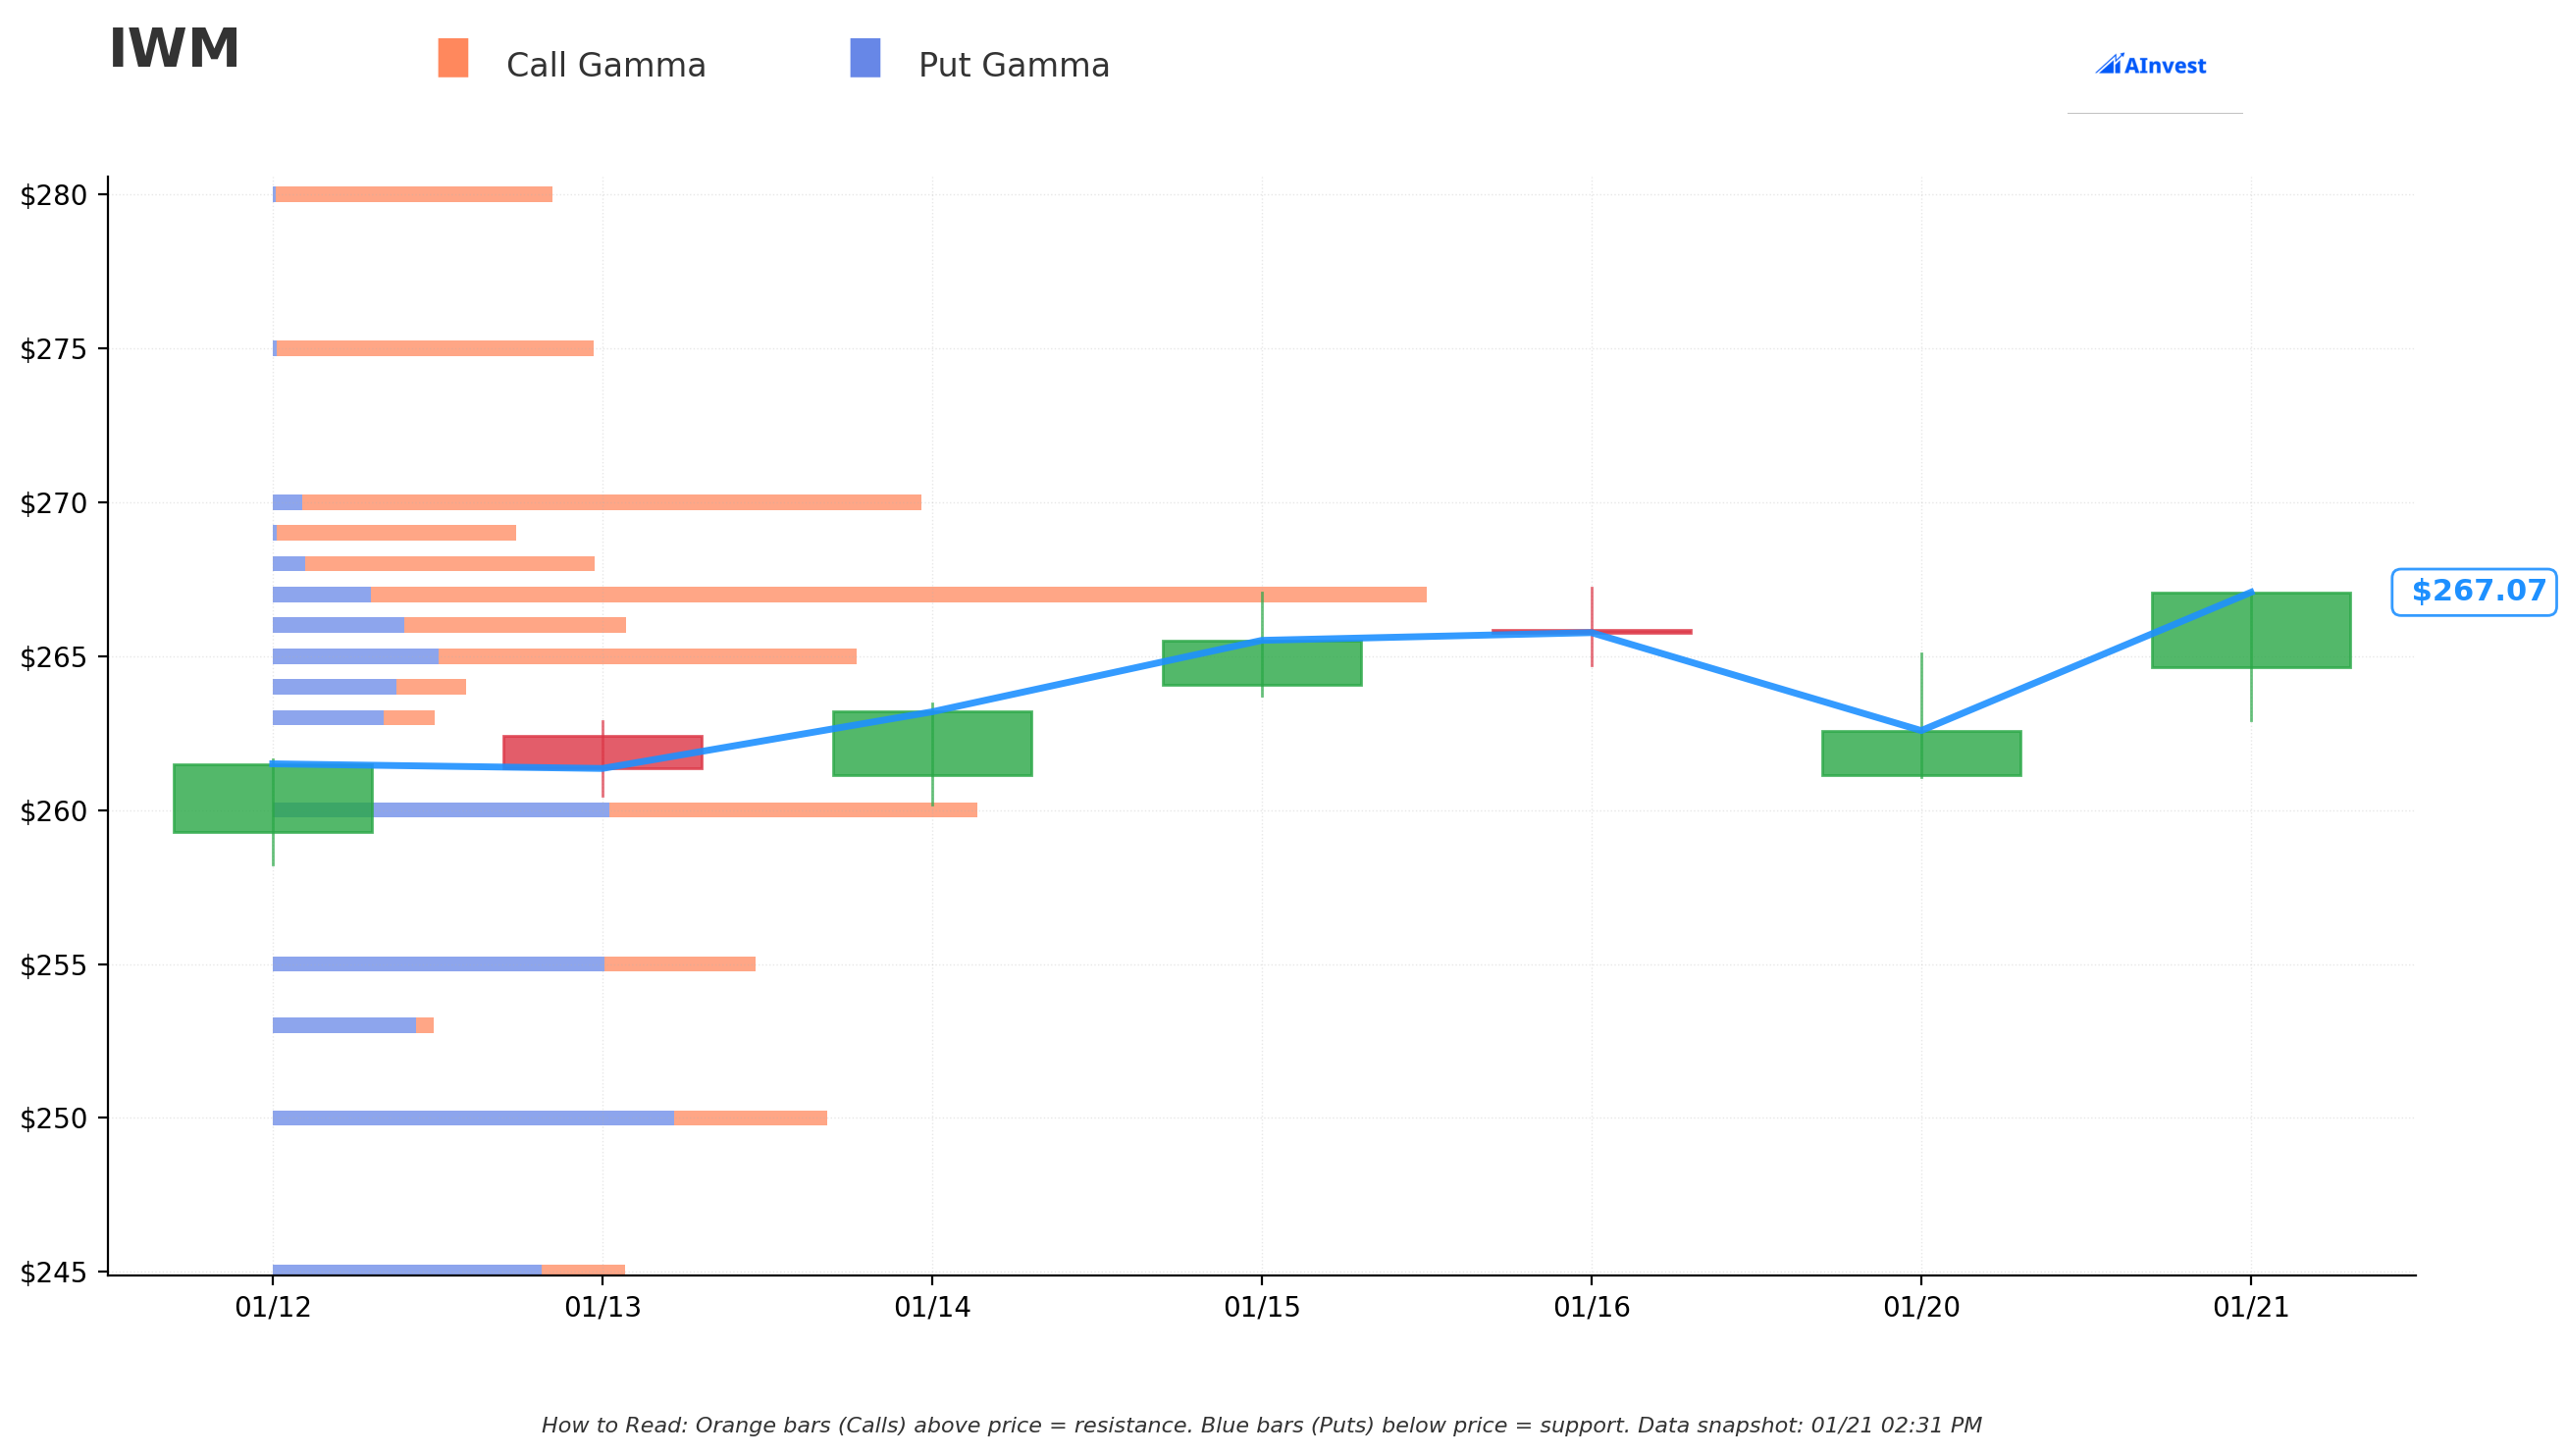
Current Price: $267.24
The gamma exposure map reveals critical price magnets where market makers will buy or sell to hedge:
🔵 Support Levels (Put Gamma Below Price):
- $267 - Immediate support with 98.5 total GEX (closest floor, 0.09% below)
- $265 - Secondary support at 113.2 total GEX (0.84% below)
- $260 - Major structural support with 137.4 total GEX (highest total - this is the LINE IN THE SAND, 2.7% below)
- $255 - Support at 94.3 total GEX (4.6% below)
- $250 - Deep support at 108.7 total GEX (6.5% below - near the put strike zone!)
- $245 - Extended support at 69.4 total GEX (8.3% below)
- $240 - Disaster floor at 68.2 total GEX (10.2% below)
🟠 Resistance Levels (Call Gamma Above Price):
- $268 - Immediate resistance with 64.6 total GEX (0.28% above)
- $270 - MAJOR resistance with 131.9 total GEX (strongest resistance - 1.03% above)
- $275 - Extended ceiling at 65.3 total GEX (2.9% above)
What this means for traders: IWM is trading just below a MASSIVE gamma wall at $270. The 120.4 net GEX at $270 means dealers hold enormous call positions that create natural selling pressure as price approaches. Breaking above $270 would require significant buying conviction.
On the downside, the $260 level with 137.4 total GEX is THE critical support - break below that and momentum could accelerate toward $250-$255 where these put trades are positioned.
Notice something? The put buyer struck at $252 - just above the $250 gamma support level. They're positioning for a scenario where IWM pulls back 5-6% from current levels, which would test that critical $260 support zone. Smart hedging.
Net GEX Bias: Bullish (971.3 call GEX vs 865.0 put GEX) - Overall positioning remains bullish, but immediate price action constrained by overhead resistance at $270.
📊 Implied Move Analysis
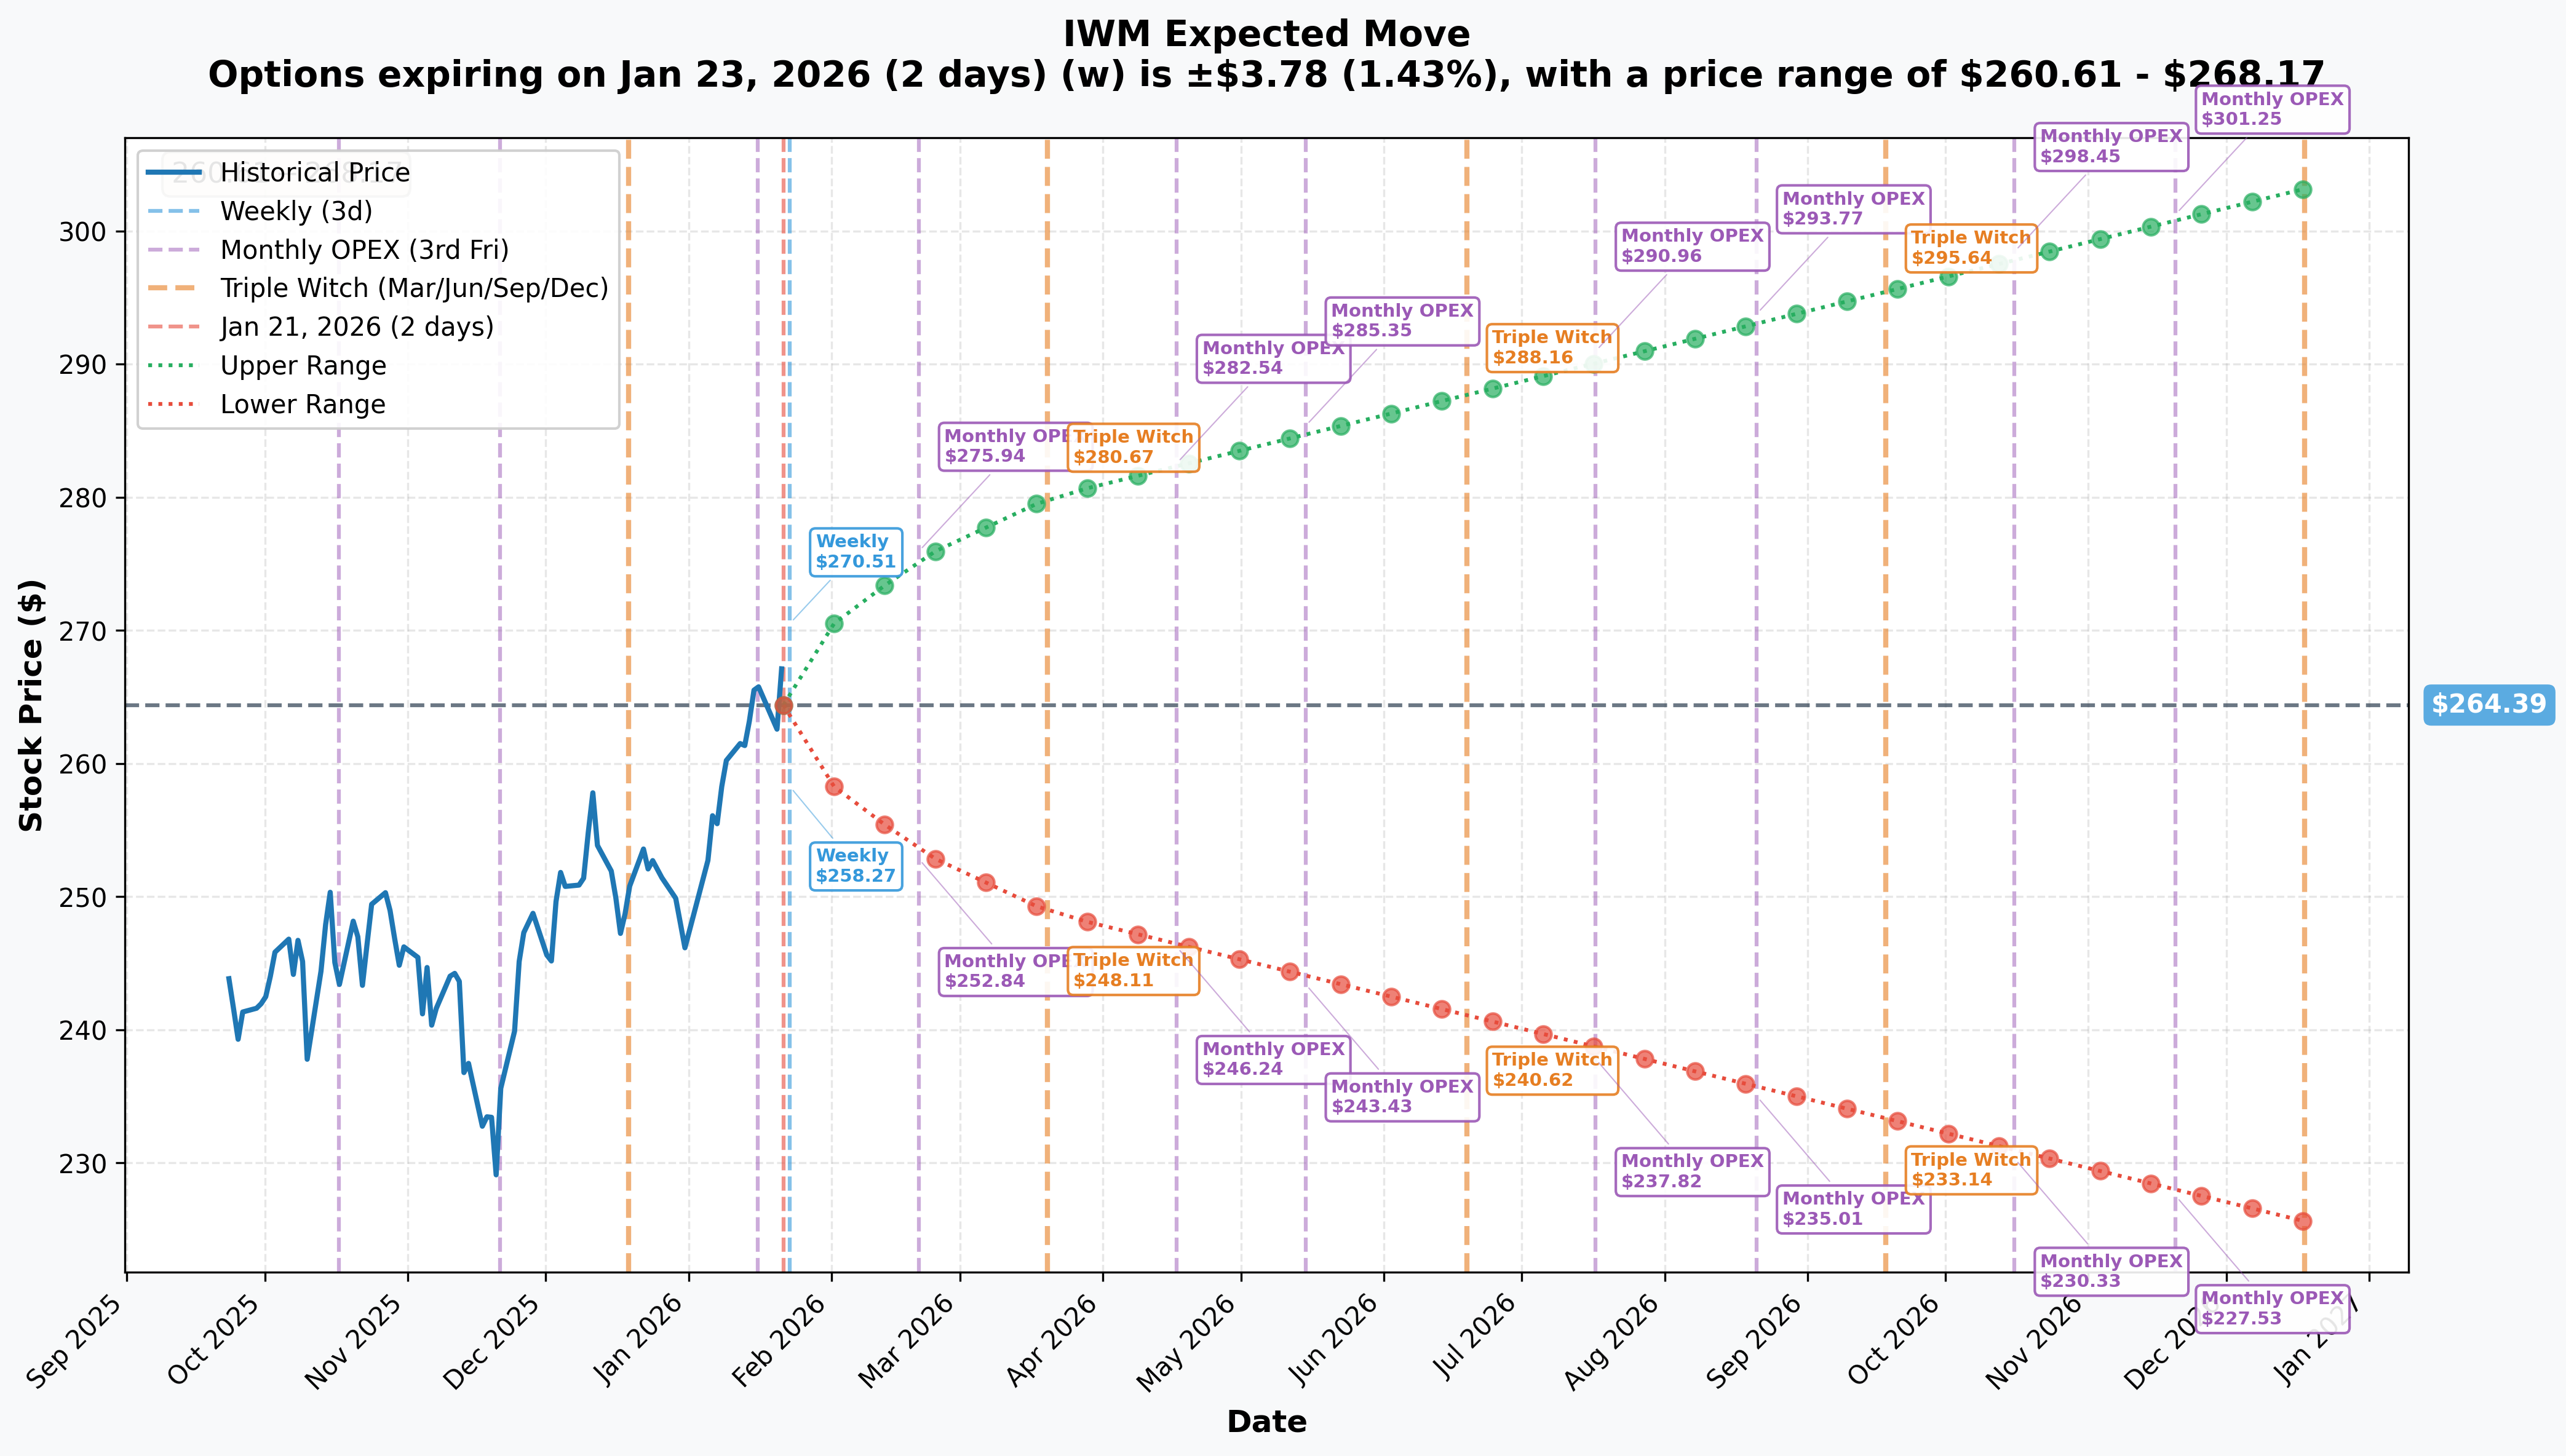
Options market pricing for upcoming expirations:
- 📅 Weekly (Jan 23 - 2 days): ±1.43% ($3.78) → Range: $260.61 - $268.17
- 📅 Monthly OPEX (Feb 20 - 30 days - THIS TRADE!): ±4.18% ($11.06) → Range: $253.33 - $275.45
- 📅 Quarterly Triple Witch (Mar 20 - 58 days): ±5.90% ($15.60) → Range: $248.79 - $279.99
- 📅 Yearly LEAPS (Dec 18 - 331 days): ±14.68% ($38.82) → Range: $225.57 - $303.21
Translation for regular folks: The options market is pricing in a 4.18% move ($11) by February 20th - that's the expiration of today's big put trades. The lower end of that range ($253.33) sits almost EXACTLY at the $252 strike where institutions are buying protection. Coincidence? Not likely.
Key insight: The implied move suggests IWM could trade anywhere from $253 to $275 over the next 30 days. The put buyer is positioned for a move toward the lower end of that range - a reasonable hedge given the overbought RSI reading and all-time high positioning.
🎪 Catalysts
🔥 Upcoming Catalysts (Next 1-3 Months)
Federal Reserve Meeting - January 28-29, 2026 📊
The FOMC meets next week, and this is THE near-term catalyst for small caps:
- 📊 Current expectation: Hold at 3.50%-3.75% (95% probability) per CME FedWatch
- ⚠️ Key risk: December CPI at 2.7% remains above 2% target - any hawkish surprise hurts small caps
- 📈 Best case: Dovish guidance hinting at June/September cuts fuels continued rotation
- 📉 Worst case: Inflation concerns push rate cut expectations further out
Why small caps care: Russell 2000 companies carry more floating-rate debt than large caps, making them highly sensitive to interest rate expectations, according to Aberdeen.
Q4 2025 Earnings Season (January-February 2026) 💰
Small-cap earnings growth is projected to significantly outpace large caps:
- 📈 Russell 2000 2026 EPS growth: 17-21% vs 12-14% for S&P 500 per Bank of America
- 🏦 Regional banks: Key driver - Truist expects recovery with steepening yield curve per CNBC
- 🏭 Industrials: Benefiting from onshoring trends and infrastructure spending
- ⚠️ Risk: High expectations (19-21% growth) leave little room for disappointment
Tax Refund Stimulus - H1 2026 💸
The One Big Beautiful Bill Act creates meaningful tailwinds:
- 💰 Consumer boost: $127 billion in after-tax income boost per Bloomberg
- 🛒 Spending impact: $30-100 billion added to consumer spending in H1 2026 per Goldman Sachs
- 📈 Small-cap benefit: Domestic-focused companies (70-80% U.S. revenue) capture more of this spending
✅ Past Catalysts (What Got Us Here)
The "Great Rotation" - Q4 2025 through January 2026
- 🗳️ Trump Election Victory (Nov 2024): Russell 2000 jumped 4.8%, gained 10% in first two weeks
- 💰 Record ETF Inflows: EUR 2.17 billion net inflows in two weeks per Morningstar UK
- 📉 Fed Rate Cuts: Three consecutive 25bp cuts in 2025 brought rates to 3.50%-3.75% per Financial Content
- 📊 Record Highs: Russell 2000 reached all-time high of 2,590.61 on December 11, 2025
- 🚀 January Momentum: 10 consecutive days of intraday record highs through January 16
🎲 Price Targets & Probabilities
Using gamma levels, implied move data, and catalyst timing, here are the scenarios through February 20th expiration:
📈 Bull Case (30% probability)
Target: $275-$280
How we get there:
- 💪 Fed meeting delivers dovish surprise, hinting at earlier cuts
- 🚀 Q4 earnings season shows small-cap earnings acceleration (20%+ growth)
- 📊 Regional banks crush estimates, driving financials higher
- 💰 Tax refund stimulus expectations boost consumer-focused small caps
- 📈 Breakout above $270 gamma resistance triggers technical rally to $275+ (implied move upper range)
Key metrics needed:
- Fed maintains dovish tone
- Earnings growth exceeds 19% consensus
- Regional bank NIM expansion continues
- No inflation spike in January CPI
Probability assessment: 30% because it requires continued rotation momentum and no hawkish Fed surprises. The $270 gamma resistance creates natural headwinds.
🎯 Base Case (50% probability)
Target: $258-$270 range (CONSOLIDATION)
Most likely scenario:
- ✅ Fed holds as expected, provides balanced guidance
- 📊 Earnings meet consensus - solid but not spectacular
- ⚖️ RSI overbought condition leads to normal consolidation
- 🔄 Market digests 7.8% YTD gains, waits for next catalyst
- 📉 Testing $260-$265 support before resuming uptrend
- 💤 Volatility normalizes after January momentum
This is the put buyer's secondary scenario: Stock consolidates near $260-$265, puts provide reasonable protection but likely expire with modest value. The $10.2M is the "insurance premium" for managing risk during uncertain period.
Why 50% probability: Market near all-time highs with overbought RSI typically leads to consolidation rather than straight-line moves higher. Fundamentals remain supportive but valuation less attractive than 3 months ago.
📉 Bear Case (20% probability)
Target: $248-$255 (TEST THE PUT STRIKE!)
What could go wrong:
- 😰 Fed turns hawkish on inflation concerns - rate cut expectations pushed to late 2026
- 🚨 Regional bank earnings disappoint - loan growth slowing
- ⏰ Earnings growth comes in below 15% - misses elevated expectations
- 🇨🇳 Tariff uncertainty resurfaces - small caps took 13% hit in early 2025 per Benzinga
- 💸 Broader risk-off move drags equities lower
- 🔨 Break below $260 gamma support triggers cascade to $250
Critical support levels:
- 🛡️ $260: Major gamma floor (137.4 total GEX) - MUST HOLD or momentum shifts bearish
- 🛡️ $255: Secondary support (94.3 total GEX)
- 🛡️ $250-$252: Deep support + this put strike zone - likely buying here
Probability assessment: 20% because it requires multiple negative catalysts. The Fed would need to surprise hawkish AND earnings would need to disappoint. Small-cap fundamentals remain supportive with 22% valuation discount to large caps per Seeking Alpha.
💡 Trading Ideas
🛡️ Conservative: Wait for Pullback Entry
Play: Stay patient and look for 3-5% pullback to gamma support for stock entry
Why this works:
- ⏰ IWM at all-time highs with RSI at 71 (overbought) - chasing here is risky
- 📉 Historical pattern: Overbought conditions typically lead to 3-5% pullbacks
- 🎯 $260-$265 gamma support offers better entry with 5-7% margin of safety
- 💰 Waiting reduces cost basis and improves risk/reward
- 📊 Small-cap thesis remains intact - no rush to enter at the peak
Action plan:
- 👀 Watch Fed meeting next week for any hawkish surprises
- 🎯 Look for pullback to $260-$265 for initial position
- ✅ Scale in: 1/3 at $265, 1/3 at $260, 1/3 at $255
- ⏰ If no pullback comes, wait for March quarterly expiration for next entry window
- 🛡️ Set stop at $248 (below implied move lower range)
Risk level: Low (cash position until better entry) | Skill level: Beginner-friendly
⚖️ Balanced: Put Credit Spread at Support
Play: Sell put spread below gamma support to collect premium while waiting
Structure: Sell IWM20260220P255 / Buy IWM20260220P250 (February 20 expiration)
Why this works:
- 💰 Collect ~$1.00-$1.50 premium per spread ($100-$150 per contract)
- 🛡️ $255 strike sits below major $260 gamma support - needs 4.6% drop to threaten
- 📊 Implied move range ($253-$275) suggests $255 should hold
- 🎯 Defined risk: $5 wide spread = $500 max loss, ~$100-150 max gain
- ⏰ 30 days to expiration aligns with Fed meeting and early earnings
Estimated P&L:
- 💰 Credit received: ~$1.00-$1.50 per spread
- 📈 Max profit: Credit received if IWM stays above $255
- 📉 Max loss: $350-$400 per spread if IWM below $250
- 🎯 Breakeven: ~$253.50-$254.00
- 📊 Probability of profit: ~70-75% based on implied move
Entry timing:
- ⏰ Enter after Fed meeting (Jan 29) if no hawkish surprise
- 🎯 Only enter if IWM trading above $262 (provides cushion)
- ❌ Skip if IWM already testing $260 support (spread too close)
Position sizing: Risk 2-3% of portfolio (defined-risk, income-focused)
Risk level: Moderate (defined risk, neutral-to-bullish) | Skill level: Intermediate
🚀 Aggressive: Copy the Institutional Hedge
Play: Buy protective puts to hedge existing IWM/small-cap exposure
Structure: Buy IWM20260220P252 (February 20 $252 Put) - SAME as today's institutional trade
Why this could work:
- 🐋 Following sophisticated institutional positioning with $10.2M conviction
- 🛡️ Protects against 5-6% downside through February OPEX
- 📊 Captures potential volatility around Fed meeting and earnings
- ⚖️ RSI at 71 suggests near-term pullback risk elevated
- 💰 Cost: ~$3-4 per contract ($300-$400 per 100 shares protected)
Why this could hurt:
- 💸 EXPENSIVE: Paying 1.5% of position value for 30-day protection
- ⏰ TIME DECAY: Theta burns as expiration approaches
- 📉 Consolidation risk: If IWM stays flat at $265, puts expire worthless
- 📈 Upside miss: If rally continues to $280, you paid for insurance you didn't need
Estimated P&L (per contract):
- 💰 Cost: ~$3.50 ($350 per contract)
- 📈 Profit scenario: IWM drops to $248 = put worth ~$4.00 = modest profit
- 🚀 Home run: IWM drops to $240 = put worth ~$12.00 = 243% ROI
- 📉 Loss scenario: IWM stays above $252 = lose entire premium
- 🎯 Breakeven: IWM at ~$248.50 at expiration
When to use:
- ✅ You own significant IWM or small-cap positions
- ✅ You want to protect gains without selling
- ✅ You're worried about Fed meeting or earnings risks
- ❌ Skip if you have no existing long exposure to hedge
Risk level: Moderate to High (premium at risk, directional) | Skill level: Intermediate
⚠️ Risk Factors
Don't get caught by these potential landmines:
-
⏰ Fed meeting in 7 days: FOMC meets January 28-29 with 95% probability of holding rates at 3.50%-3.75% per CME FedWatch. BUT any hawkish inflation commentary could tank small caps - they're highly sensitive to rate expectations given floating-rate debt exposure. December CPI at 2.7% (above 2% target) gives Fed cover to stay cautious.
-
📊 RSI at 71 signals overbought: According to Equiti, the Russell 2000's RSI sits at 71, signaling overbought conditions and potential for near-term pullback. After 10 consecutive days of record highs, some consolidation is normal and healthy.
-
💸 Valuation less attractive after rally: Russell 2000 trades at 18x forward P/E - while still a 22% discount to S&P 500's 24x per Seeking Alpha, the discount has narrowed. Small caps need to deliver 19-21% earnings growth to justify current levels.
-
🏦 Regional bank concentration risk: Russell 2000 has ~14% financial sector weight, heavily concentrated in regional banks. Zions (-13%) and Western Alliance (-11%) plunged on loan fraud disclosures in October 2025 per Barchart. One more regional bank scare could drag the entire index.
-
🇺🇸 Tariff uncertainty: U.S. effective tariff rate rose from 2% to 17% in 2025 per BlackRock. While small caps have 70-80% domestic revenue exposure, tariff volatility "crushed small caps in early 2025" per Benzinga. Any renewed trade tensions are a risk.
-
📉 ~40% of Russell 2000 unprofitable: According to AInvest, roughly 40% of Russell 2000 constituents remain unprofitable. In a risk-off environment, these "zombie companies" could drag the index significantly lower than large-cap indices.
-
🐋 $10.2M institutional put activity: Today's unusual options activity signals sophisticated players are hedging at current levels. When funds move $10M+ into protective puts near all-time highs, it's a caution flag. The Z-score of 20.9 means this type of defensive positioning happens only a few times per year.
-
📊 Gamma ceiling at $270: The 120.4 net GEX at $270 means market makers will systematically sell into rallies to hedge their exposure. Breaking through requires sustained buying pressure that may not materialize if investors get cautious.
🎯 The Bottom Line
Real talk: Institutions just moved $10.2 MILLION rolling up put protection on IWM from $250 to $252 strikes - and they did it right at all-time highs with RSI flashing overbought. This isn't a bearish bet against small caps - it's smart risk management by players who've made good money on "The Great Rotation" and don't want to give it back.
What this trade tells us:
- 🎯 Sophisticated player expects potential 5-6% pullback from current levels through February 20th
- 💰 They upgraded protection from $250 to $252 - wants insurance to kick in sooner
- ⚖️ The timing (near all-time highs, before Fed meeting) shows awareness of near-term risk
- 📊 57,000 contracts at $252 represents conviction worth following
This is NOT a "sell everything" signal - it's a "take some chips off the table" signal.
If you own IWM or small caps:
- ✅ Consider trimming 20-30% at current levels (lock in YTD gains, reduce risk)
- 📊 If holding, consider adding protective puts at $250-$255 strikes
- ⏰ Watch Fed meeting January 28-29 closely for any hawkish surprises
- 🎯 Set mental stop at $255 (below major $260 gamma support)
- 🛡️ The small-cap thesis remains intact - just manage position size at highs
If you're watching from sidelines:
- ⏰ Be patient - don't chase all-time highs with overbought RSI
- 🎯 Look for 3-5% pullback to $255-$260 for better entry
- 📈 Small-cap fundamentals remain compelling: 22% valuation discount, 19%+ earnings growth, domestic focus
- 📊 Consider selling put spreads at support to get paid while waiting
- ⚠️ Avoid aggressive long positioning until RSI cools below 60
If you're bearish:
- 🎯 Wait for break below $260 gamma support before initiating shorts
- 📊 Put spreads ($260/$255 or $255/$250) offer defined-risk downside exposure
- ⚠️ Don't fight "The Great Rotation" momentum - this trade is a hedge, not a crash call
- 📉 First target on breakdown: $250-$252 (today's put strikes)
Mark your calendar - Key dates:
- 📅 January 23 (Thursday) - Weekly OPEX (±1.43% implied move)
- 📅 January 28-29 (Tue-Wed) - FOMC Meeting (hold expected, watch guidance!)
- 📅 February 20 (Friday) - Monthly OPEX, expiration of this $10.2M put trade
- 📅 March 20 (Friday) - Quarterly Triple Witch (±5.9% implied move)
Final verdict: The small-cap bull case remains intact - valuation discount, earnings growth, Fed easing cycle, domestic economic strength, and "The Great Rotation" all support IWM. BUT, at all-time highs with RSI at 71 and $10M+ in institutional put buying, the risk/reward is NO LONGER favorable for aggressive new positioning. The smart money is hedging - you should consider it too.
Be patient. Let the RSI cool. Look for better entry at $255-$260. The small-cap rally isn't going anywhere - you'll sleep better buying a pullback than chasing the highs.
Manage your risk. Protect your gains. 💪
Disclaimer: Options trading involves substantial risk of loss and is not suitable for all investors. This analysis is for educational purposes only and not financial advice. Past performance doesn't guarantee future results. The Z-score of 20.9 reflects this specific trade's size relative to recent IWM history - it occurs a few times per year, not daily. Always do your own research and consider consulting a licensed financial advisor before trading. ETFs carry market risk and can decline in value. The put buyer may have complex portfolio hedging needs not applicable to retail traders.
About iShares Russell 2000 ETF (IWM): IWM tracks the Russell 2000 Index, providing exposure to approximately 2,000 small-cap U.S. stocks across all sectors. With $77.71 billion in AUM and a 0.19% expense ratio, it's the most liquid and widely-traded small-cap ETF, making it the benchmark for small-cap market exposure.