:moneybag: IWM $19.7M Unusual Options Activity - The Great Rotation Heats Up!
:calendar: January 22, 2026 | :fire: Unusual Activity Detected
:dart: The Quick Take
Nearly $20 MILLION in unusual options activity hit IWM today! We're seeing a mix of defensive positioning and fresh directional bets as the "Great Rotation" into small caps reaches fever pitch. A massive $5.9M long put opened at the $257 strike while another institution closed a $4.7M put position - classic smart money hedging as the Russell 2000 trades near all-time highs at $270. Translation: Big players are actively managing risk while staying positioned for upside in the hottest trade of 2026!
:bar_chart: ETF Overview
iShares Russell 2000 ETF (IWM) is the premier vehicle for trading small-cap U.S. equities:
- AUM: $77.76 billion (largest Russell 2000 ETF)
- Fund Type: Exchange-Traded Fund tracking the Russell 2000 Index
- Asset Class: U.S. Small-Cap Equities
- Expense Ratio: 0.19%
- Current Price: $270.68 (near all-time high of $268.59 recently surpassed)
- 52-Week Range: $171.73 - $268.59
- YTD Return: +6.62%
- Dividend Yield: 1.1%
- P/E Ratio: 18.11x (discount to S&P 500's ~22x)
:money_with_wings: The Option Flow Breakdown
:bar_chart: The Tape (January 22, 2026)
| Date | Time | Symbol | Buy/Sell | Call/Put | Expiration | Strike | Volume | Premium | Order Type | Strategy | Z-Score | Classification |
|---|---|---|---|---|---|---|---|---|---|---|---|---|
| 2026-01-22 | 09:57:18 | IWM | BUY | PUT $254 | 2026-02-20 | $254 | 35,000 | $4.7M | BTC | Close Long Put | 1.75 | ABOVE_AVERAGE |
| 2026-01-22 | 09:57:18 | IWM | BUY | PUT $257 | 2026-02-20 | $257 | 38,000 | $5.9M | BTO | Long Put | 36.55 | EXTREMELY_UNUSUAL |
| 2026-01-22 | 13:54:23 | IWM | SELL | PUT $260 | 2026-06-18 | $260 | 12,000 | $9.1M | STO | Short Put | 12.03 | EXTREMELY_UNUSUAL |
Total Premium: $19.7 MILLION
:nerd_face: What This Actually Means
Let's break down each trade:
Trade 1: $4.7M Put Close (BTC) - Taking Profits on Protection
- :chart_with_upwards_trend: Someone CLOSED a protective put position at the $254 strike
- :moneybag: They likely bought these puts lower and are now monetizing as IWM rallied
- :dart: Z-Score of 1.75 = Above average but not extreme - routine profit-taking
- :bulb: Translation: "We rode our insurance up, time to cash out with IWM near highs"
Trade 2: $5.9M Long Put (BTO) - Fresh Downside Protection :rotating_light:
- :fire: THIS IS THE BIG ONE! Z-Score of 36.55 = EXTREMELY UNUSUAL (happens maybe 2-3 times per quarter)
- :shield: New defensive position at $257 strike - only 5% below current price
- :calendar: February 20 expiration captures FOMC meeting (Jan 27-28) and GDP data (Feb 20)
- :whale: 38,000 contracts = 3.8 million shares of protection (~$1 BILLION notional exposure)
- :bulb: Translation: "We're long small caps but worried about near-term volatility around Fed/economic data"
Trade 3: $9.1M Short Put (STO) - Bullish Income Play :rocket:
- :moneybag: Someone SOLD $260 puts expiring June 18 (Triple Witch), collecting fat premium
- :dart: Z-Score of 12.03 = EXTREMELY UNUSUAL - major institutional positioning
- :calendar: June expiration captures Q1 2026 earnings season and potential Fed rate cut
- :bulb: Translation: "Happy to buy IWM at $260 if it drops, and getting paid $9.1M to wait"
- :warning: This is BULLISH positioning - they're betting IWM stays above $260 through June
The Big Picture: We're seeing classic institutional hedging behavior near all-time highs:
- One player took profits on old puts (+$4.7M closed)
- Another opened fresh near-term protection (-$5.9M new puts)
- A third is selling volatility, expecting IWM to hold above $260 (+$9.1M premium collected)
Net interpretation: Cautiously bullish with active risk management - institutions remain long but are hedging around major macro catalysts.
:chart_with_upwards_trend: Technical Setup / Chart Check-Up
YTD Performance Chart
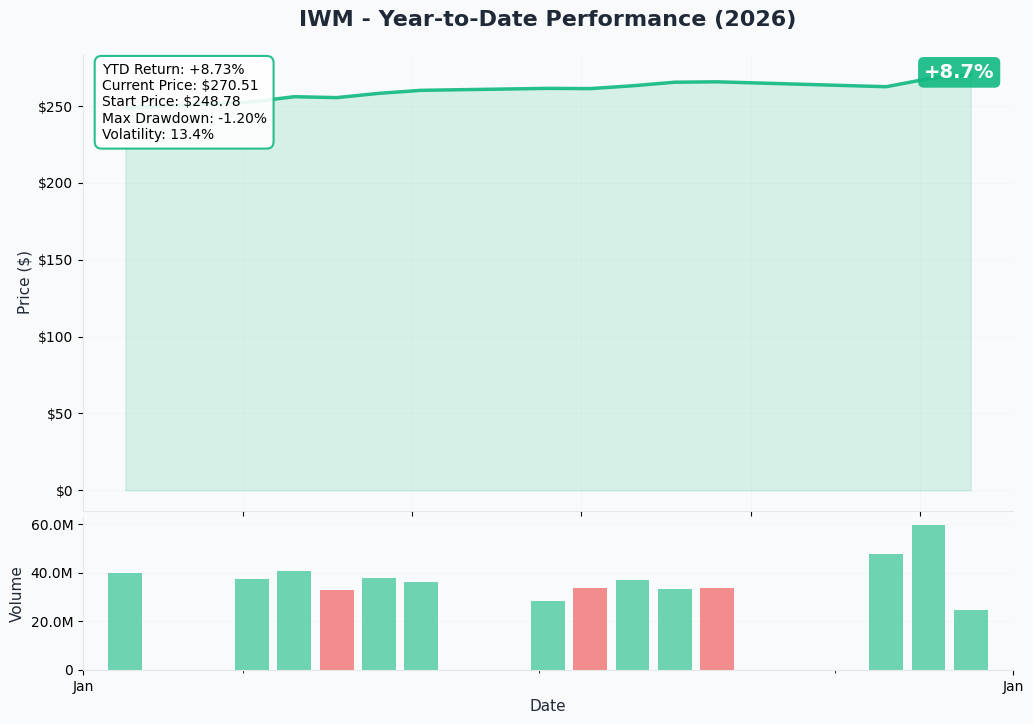
IWM is having a MONSTER year - up 6.62% YTD and trading near all-time highs at $270.68. The chart tells the story of the "Great Rotation" - capital flooding out of mega-cap tech into domestic-focused small caps.
Key observations:
- :rocket: Record highs: Russell 2000 hit 2,603.90 on January 8 - surpassed multiple times since
- :chart_with_upwards_trend: Outperforming large caps: Beat Nasdaq for 10 consecutive sessions in early January - longest streak in 30+ years
- :moneybag: Valuation discount: 18.1x P/E vs S&P 500's 22x creates compelling relative value
- :warning: Overbought territory: +8% in three weeks suggests near-term consolidation possible
Gamma-Based Support & Resistance Analysis
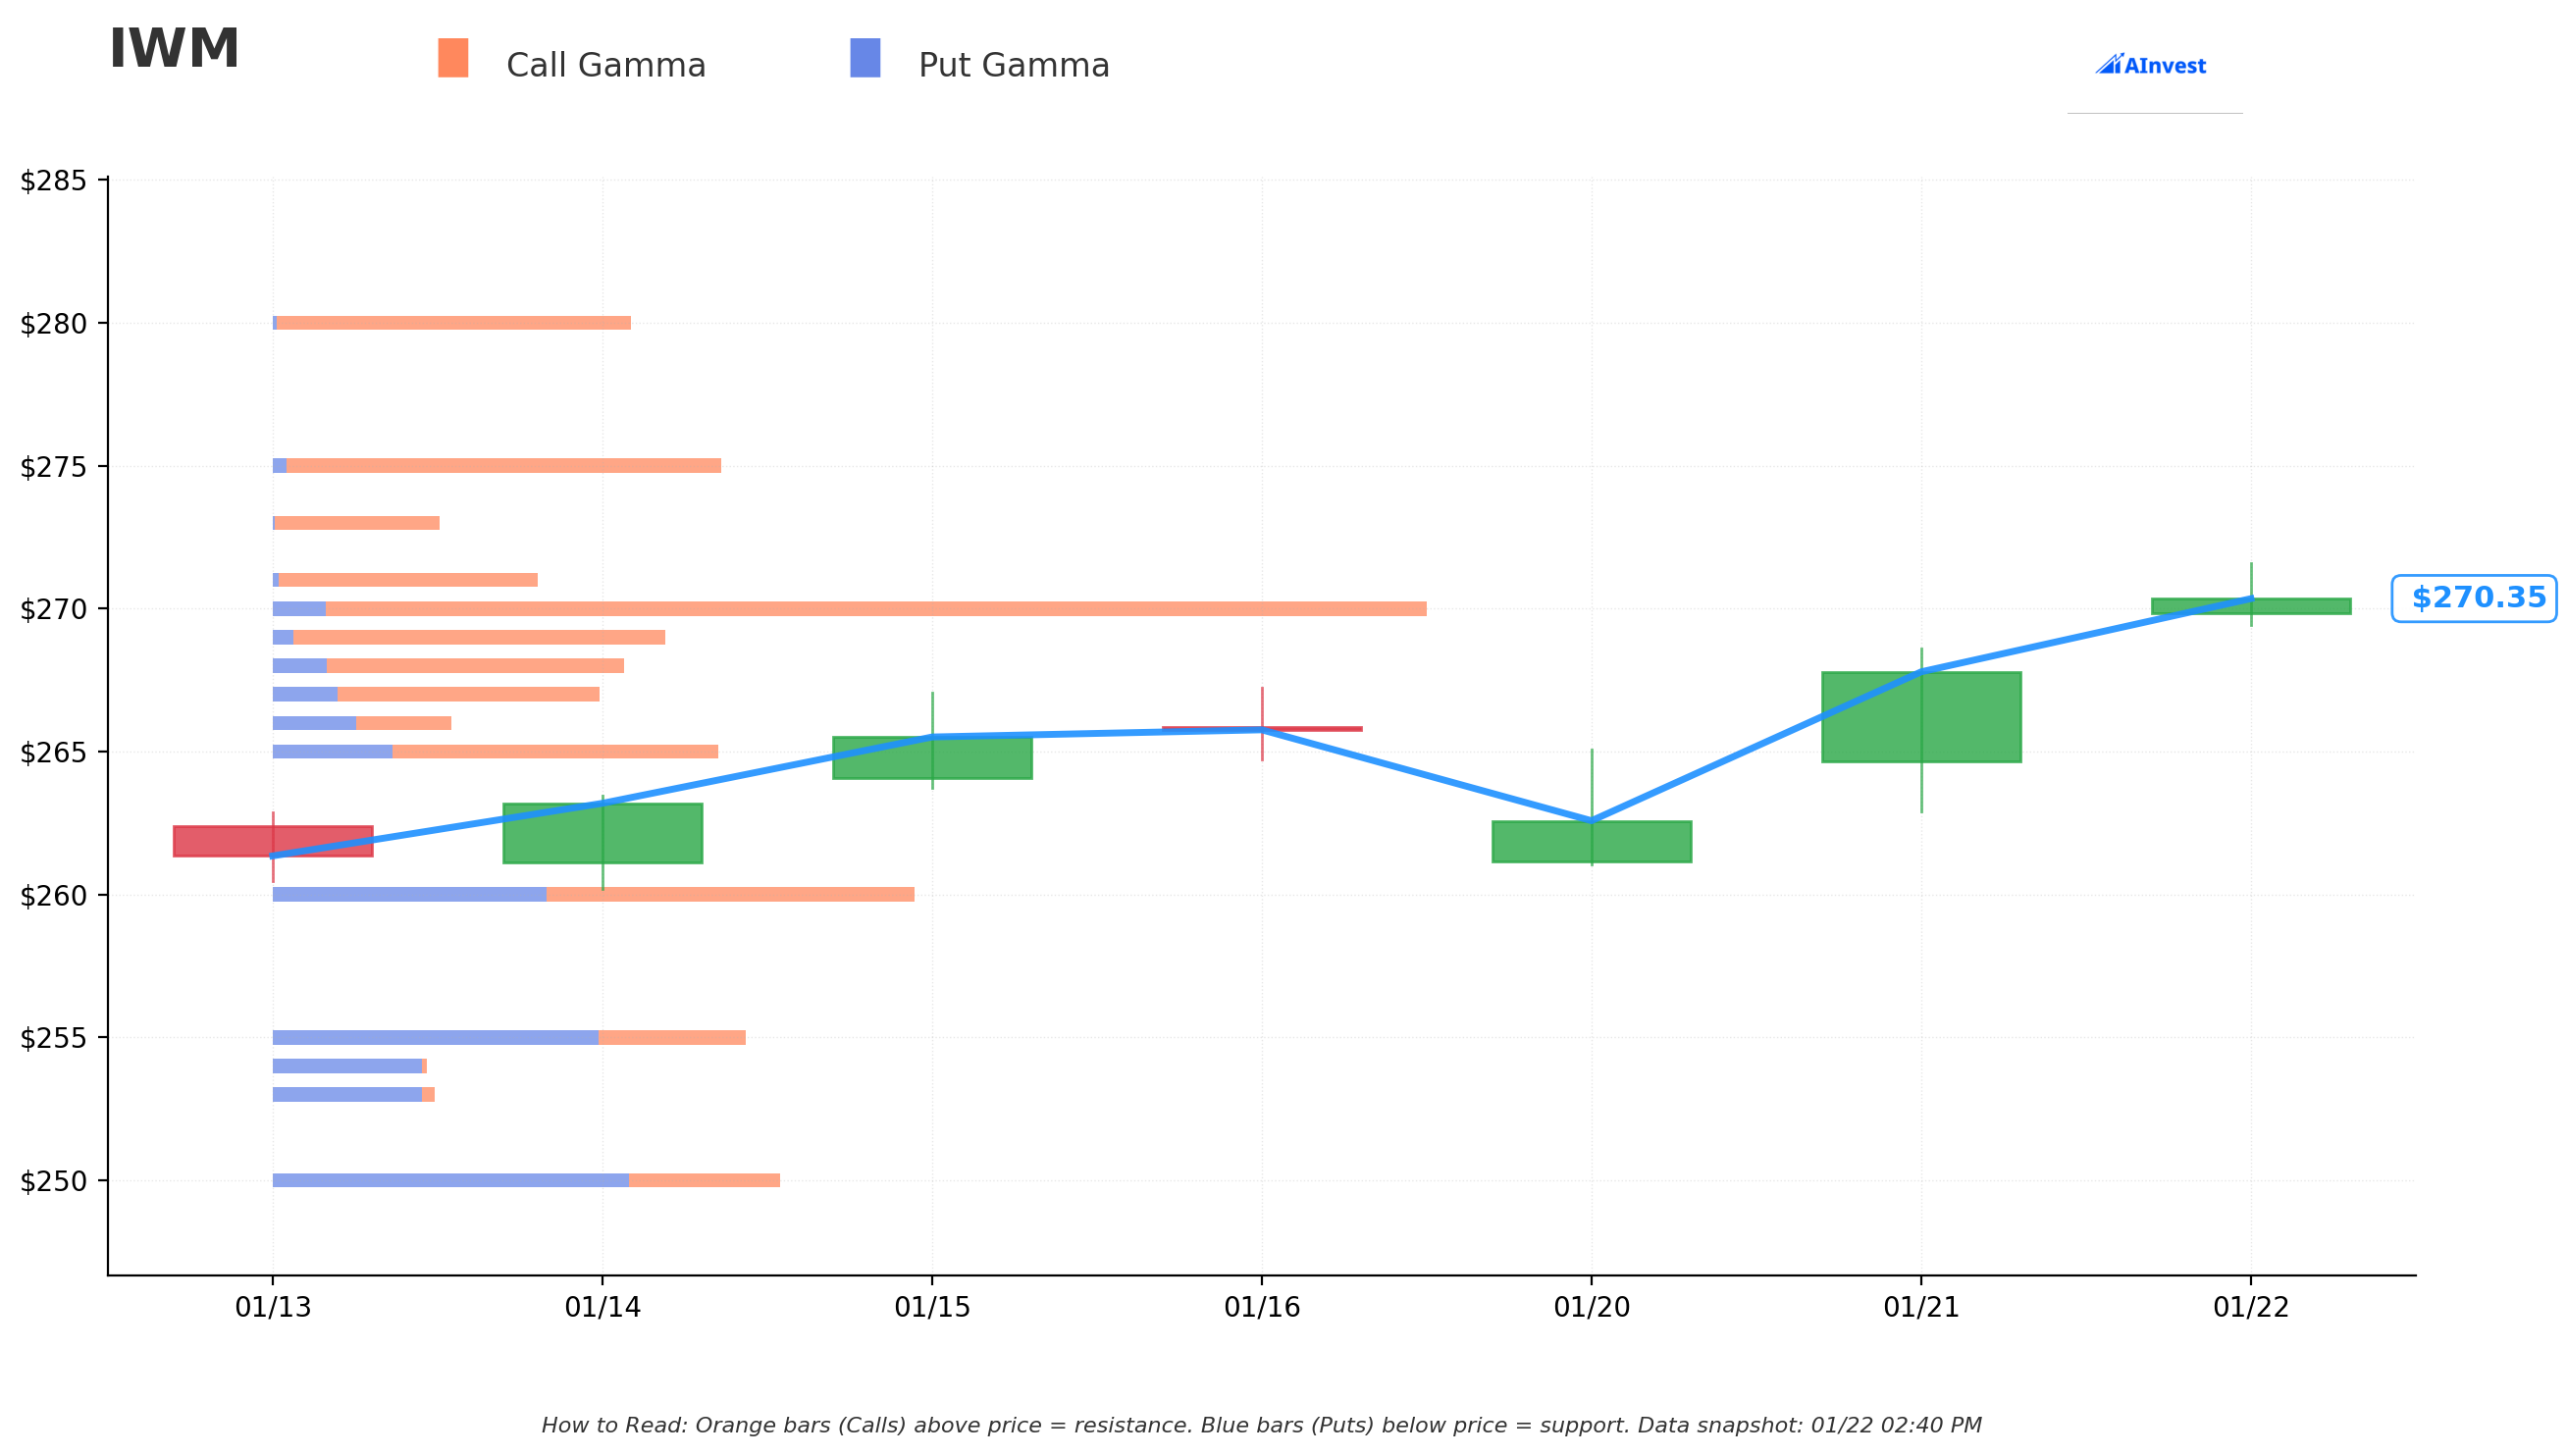
Current Price: $270.45
The gamma exposure map reveals where market makers will buy dips and sell rallies:
:blue_circle: Support Levels (Put Gamma - Where Dealers Buy Dips):
- $270 - Immediate support with 206B total gamma (STRONGEST - right at current price!)
- $269 - Secondary floor at 67.9B gamma (0.5% below)
- $268 - Third support at 62.1B gamma (0.9% below)
- $265 - Major structural floor at 78.8B gamma (2% below)
- $260 - Deep support at 114B gamma (3.9% below) - ALSO THE SHORT PUT STRIKE!
- $255 - Extended support at 84B gamma (5.7% below)
- $250 - Bear case floor at 90.3B gamma (7.6% below)
- $240 - Disaster scenario at 59.7B gamma (11.3% below)
:orange_circle: Resistance Levels (Call Gamma - Where Dealers Sell Rallies):
- $275 - First resistance at 80.3B gamma (1.7% above)
- $280 - Major ceiling at 64.1B gamma (3.5% above)
What this means for traders: IWM is sitting RIGHT ON major $270 gamma support (187.3B net GEX) - this is a CRITICAL level. Market makers will aggressively buy any dips here. The net GEX bias is BULLISH (1,049B call gamma vs 756B put gamma), suggesting mechanical buying pressure on pullbacks.
The $260 level with 114B gamma is particularly important - notice the short put seller struck EXACTLY at this level. They're betting this massive gamma floor holds through June. Smart positioning!
Implied Move Analysis
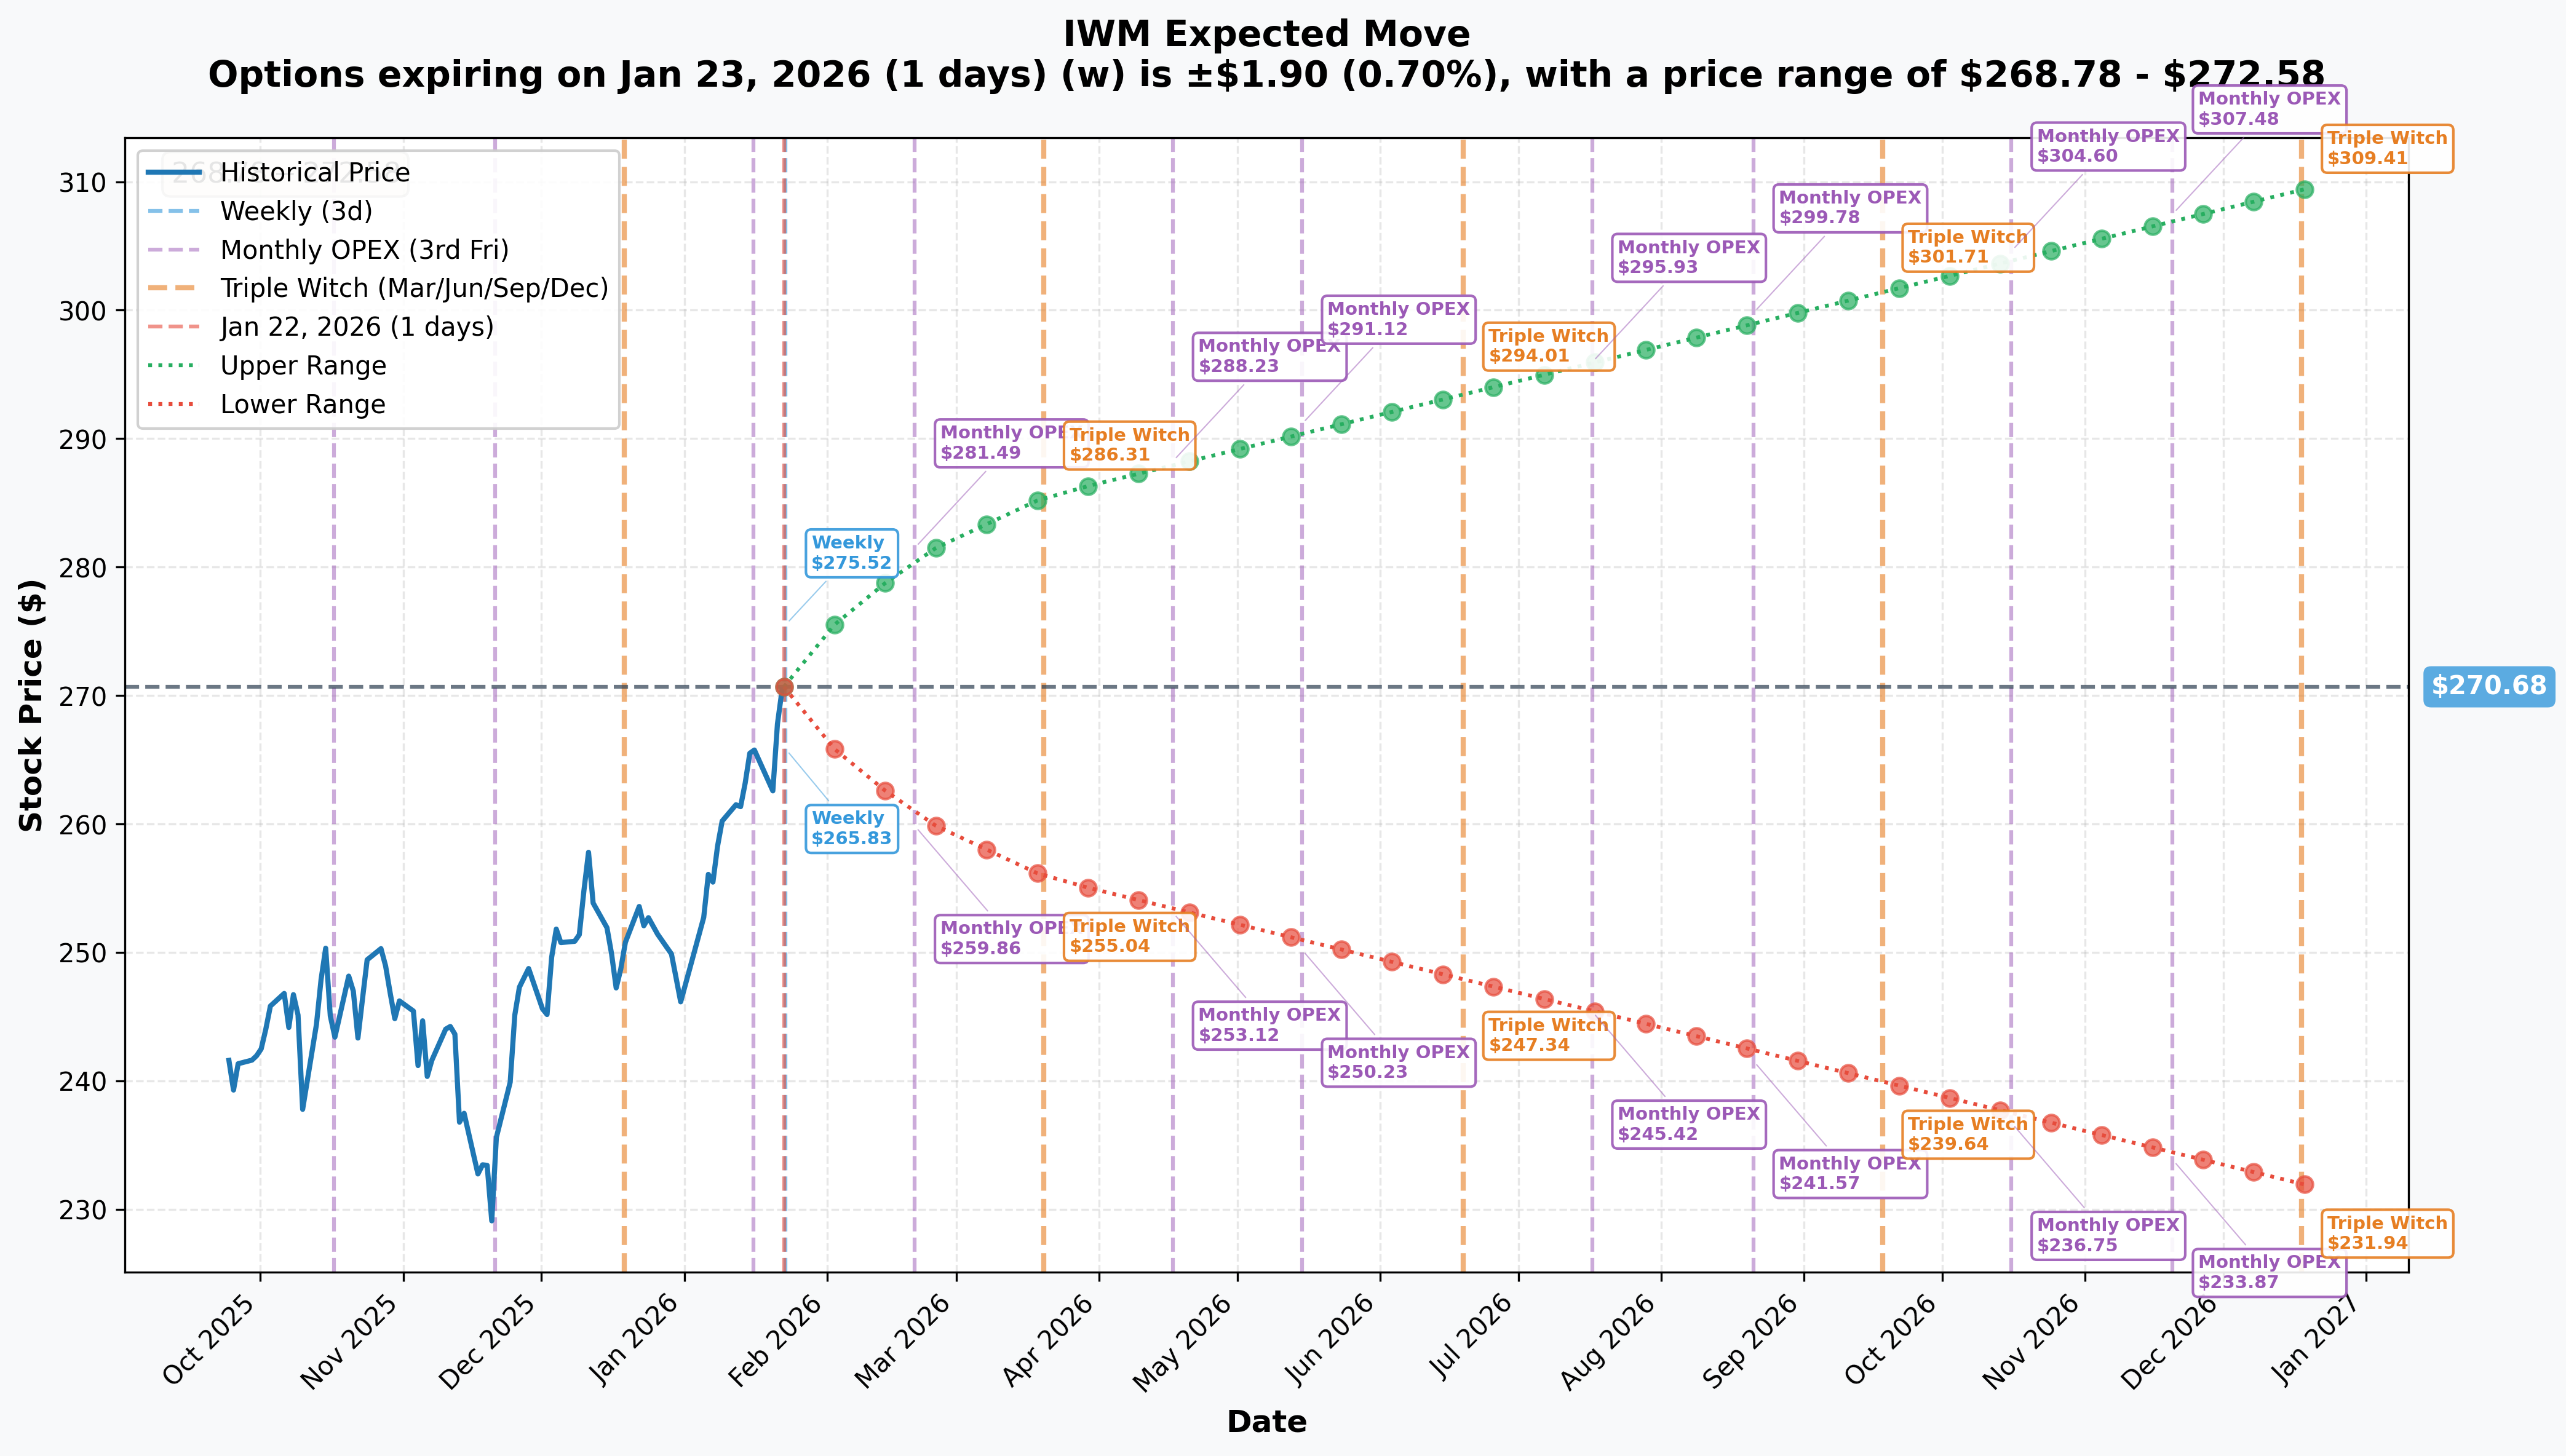
Options market pricing for upcoming expirations:
| Expiration | Days Out | Implied Move | Range |
|---|---|---|---|
| :calendar: Weekly (Jan 23) | 1 day | +/-0.7% ($1.90) | $268.78 - $272.58 |
| :calendar: Monthly OPEX (Feb 20) | 29 days | +/-3.75% ($10.14) | $260.53 - $280.82 |
| :calendar: Triple Witch (Mar 20) | 57 days | +/-5.48% ($14.85) | $255.83 - $285.52 |
| :calendar: Triple Witch (Jun 18) | ~150 days | $243 - $297 | |
| :calendar: LEAPS (Dec 18) | 330 days | +/-14.31% ($38.74) | $231.94 - $309.41 |
Translation for regular folks: Options traders expect IWM to trade in a $260-$281 range through February (monthly OPEX) - that's a 3.75% implied move. The February put buyer at $257 is positioned just below this lower bound, suggesting they're hedging against a worse-than-expected scenario.
The June short put seller at $260 is positioned right at the February implied move floor - they're betting this level holds not just through February but through mid-year.
Key insight: The implied move through June (~10%) suggests options market is pricing meaningful volatility around Fed policy and economic data. The $260 strike for June puts offers attractive premium collection IF you're willing to own IWM at that level.
:circus_tent: Catalysts
:fire: Confirmed Upcoming Catalysts
| Date | Event | Significance |
|---|---|---|
| Jan 27-28, 2026 | FOMC Meeting | Rate decision expected (hold at 3.50-3.75%) |
| Feb 11, 2026 | January 2026 CPI | Critical inflation gauge |
| Feb 20, 2026 | GDP Q4 2025 Advance | Key economic health indicator |
| Mar 2026 | FOMC Meeting | Potential policy guidance update |
| Jun 2026 | Earliest Rate Cut Window | Markets pricing first 2026 cut here |
:rocket: Recent Catalysts Driving the Rally
The "Great Rotation" (November 2025 - Present)
- :chart_with_upwards_trend: Russell 2000 surged ~8% in first three weeks of 2026, reaching record highs near $267-268
- :moneybag: Capital flowing from mega-cap tech into domestic-focused small caps
- :bank: Regional banks leading the charge - KRE up +17% since November lows
Federal Reserve Rate Cuts (2025)
- :chart_with_downwards_trend: Three consecutive 25bp cuts brought rates to 3.50%-3.75%
- :bank: Lower borrowing costs particularly benefit small caps with floating-rate debt
- :warning: Fed expected to HOLD at January meeting - next cut potentially June
Small Business Optimism Surge
- :chart_with_upwards_trend: NFIB Index rose to 99.5 in December 2025 - highest since August
- :briefcase: Business conditions outlook: Net 24% expecting improvement (+9 points)
- :moneybag: Interest rate impact: Net -3% paying higher rates - lowest since January 2021
Analyst Upgrades
- :dart: Jefferies target: Russell 2000 at 2,825 (14% upside from current)
- :chart_with_upwards_trend: Goldman Sachs raised year-end target to 2,825
- :moneybag: IWM average price target: $314.63 (17% upside potential)
:game_die: Price Targets & Probabilities
Using gamma levels, implied move data, and catalyst calendar:
:chart_with_upwards_trend: Bull Case (30% probability)
Target: $285-$310
How we get there:
- :rocket: Fed signals additional rate cuts possible in H1 2026, boosting rate-sensitive small caps
- :chart_with_upwards_trend: Q4 2025 GDP comes in hot (Atlanta Fed tracking 5.4%) supporting "soft landing" narrative
- :moneybag: Small-cap earnings growth delivers 17-22% for 2026 vs 14% for S&P 500
- :bank: Regional bank strength continues as yield curve steepens
- :globe_with_meridians: Tariff situation resolves favorably, removing headwind from small business importers
- :dart: Break above $275 gamma resistance triggers momentum to implied move upper bound ($285)
:dart: Base Case (45% probability)
Target: $260-$280 range (CONSOLIDATION)
Most likely scenario:
- :balance_scale: Fed holds rates through June as inflation remains sticky at 2.7% CPI
- :chart_with_upwards_trend: Solid but not spectacular Q4 2025 earnings season for Russell 2000 (+62.5% YoY blended estimate)
- :balance_scale: Trade between gamma support ($265-$270) and resistance ($275-$280)
- :moneybag: Premium sellers (like our $9.1M short put) profit from range-bound action
- :calendar: Market waits for clearer Fed guidance and Q1 2026 economic data
This is the put seller's target scenario: IWM stays above $260 through June, they keep the entire $9.1M premium.
:chart_with_downwards_trend: Bear Case (25% probability)
Target: $240-$260
What could go wrong:
- :rotating_light: Inflation reaccelerates, Fed signals "higher for longer" - January 7 selloff showed this vulnerability
- :warning: $368 billion "refinancing wall" triggers distress in overleveraged small caps
- :skull: "Zombie companies" (~40% of Russell 2000 unprofitable) begin failing as rates stay elevated
- :moneybag: Tariff costs averaging $25,000/month per small business squeeze margins
- :chart_with_downwards_trend: Break below $265 gamma support triggers cascade to $260, then $255
- :globe_with_meridians: China GDP slowdown (4.5% in Q4 2025) spills over to global risk-off
The put buyer's thesis: Protection at $257 pays off if macro headwinds intensify.
:bulb: Trading Ideas
:shield: Conservative: Cash-Secured Put at $260 Support
Play: Sell June $260 puts (copy the $9.1M institutional trade)
Why this works:
- :moneybag: Collect ~$7-8/contract premium ($700-800 per contract)
- :dart: $260 strike sits at MASSIVE 114B gamma support - dealers will defend this level
- :calendar: June expiration captures potential Fed rate cut catalyst
- :chart_with_upwards_trend: If assigned, buying IWM at effective cost basis of ~$252-253 (4% below current)
- :bank: Bullish on "Great Rotation" thesis but want cushion and income
- :balance_scale: Max loss: Buying IWM at $260 if it crashes (but you're a buyer at these levels anyway)
Position sizing: 1-2 contracts per $30,000 of capital (keep 50%+ cash for assignment)
Risk level: Moderate (unlimited downside but buying an asset you want) | Skill level: Intermediate
:balance_scale: Balanced: Put Spread Hedge (February)
Play: Buy $265/$255 put spread expiring February 20
Structure: Buy $265 puts, Sell $255 puts
Why this works:
- :shield: Protects existing IWM position against Fed/GDP surprises
- :moneybag: Defined risk: $10 wide spread = $1,000 max risk per spread
- :calendar: Captures FOMC (Jan 27-28), CPI (Feb 11), and GDP (Feb 20) volatility
- :dart: Targets gamma support zone at $255-$265 where we expect bounces
- :chart_with_downwards_trend: Max profit if IWM below $255: $1,000 - premium paid
Estimated cost: ~$3-4 per spread | Max profit: ~$600-700 | Risk/Reward: ~1.5:1
Risk level: Moderate (defined risk) | Skill level: Intermediate
:rocket: Aggressive: Call Spread for Rotation Continuation
Play: Buy $275/$285 call spread expiring March 20 (Triple Witch)
Structure: Buy $275 calls, Sell $285 calls
Why this could work:
- :rocket: Betting "Great Rotation" continues with IWM breaking to new highs
- :dart: Targets analyst price targets of $285+ (Jefferies/Goldman)
- :calendar: March expiration captures full Q4 earnings season and February macro data
- :moneybag: Defined risk: $10 wide spread caps exposure
- :chart_with_upwards_trend: Implied move upper range for March: $285.52 - right at our target!
Estimated cost: ~$2.50-3 per spread | Max profit: $700-750 (2.5:1 reward/risk)
Risk level: High (directional bet near all-time highs) | Skill level: Advanced
:warning: Risk Factors
Don't get caught by these potential landmines:
-
:rotating_light: "Higher for Longer" Fed Risk: Sticky inflation at 2.7% CPI may delay rate cuts beyond June. January 7 selloff demonstrated IWM's sensitivity to hawkish Fed expectations. Small caps carry more floating-rate debt, making them particularly vulnerable.
-
:skull: Zombie Company Exposure: 40-46% of Russell 2000 constituents are unprofitable - highest since COVID and double the 2008 level. The $368 billion "refinancing wall" in 2026 could trigger a wave of defaults as pandemic-era debt issued at 0.5-1% rolls over at 4-5%.
-
:moneybag: Tariff Headwinds: Small business importers facing ~$25,000/month in tariff costs - projected to exceed $500,000 per business in 2026 if current pace continues. Retaliatory tariffs from Canada, China, and Mexico add further pressure.
-
:chart_with_downwards_trend: Overbought After Historic Run: IWM up 8% in three weeks, Russell 2000 outperformed Nasdaq for 10 consecutive sessions - longest streak in 30+ years. Technical consolidation likely even without fundamental catalyst.
-
:globe_with_meridians: China/Global Slowdown: Q4 2025 China GDP at 4.5% - weakest in nearly 3 years. Global risk-off could drag small caps despite domestic focus.
-
:calendar: Fed Leadership Transition: Jerome Powell's term expires May 15, 2026, creating policy uncertainty. New Fed Chair appointment could shift rate expectations dramatically.
-
:warning: Concentration Risk: Despite broad diversification (2,000 stocks), quality dispersion between profitable small caps and overleveraged speculative names creates uneven risk. Passive IWM exposure includes significant "zombie" allocation.
:dart: The Bottom Line
Real talk: We're seeing classic institutional hedging near all-time highs. The $5.9M put buy at $257 (Z-Score 36.55 - extremely unusual) tells us smart money is protecting gains while remaining bullish. The $9.1M short put at $260 tells us another institution is willing to buy any dip and getting paid handsomely to wait.
What these trades tell us:
- :dart: Institutions remain BULLISH on the "Great Rotation" thesis
- :shield: They're actively managing risk around FOMC (Jan 27-28) and economic data releases
- :moneybag: The $260 level is a LINE IN THE SAND - massive gamma support + institutional positioning
- :calendar: February and June expirations are key dates for positioning
If you own IWM:
- :white_check_mark: Consider protective puts at $260-$265 through February to hedge Fed/GDP risk
- :chart_with_upwards_trend: Set mental support at $265 gamma floor - break below signals caution
- :moneybag: Take partial profits near $275-$280 resistance if rally continues
- :shield: The rotation thesis is INTACT but manage position size given all-time high valuation
If you're watching from sidelines:
- :dart: Pullback to $260-$265 gamma support would be EXCELLENT entry
- :calendar: Wait for Fed meeting clarity (Jan 27-28) before aggressive positioning
- :moneybag: Consider selling cash-secured puts at $260 to get paid while waiting for dip
- :chart_with_upwards_trend: Long-term thesis remains compelling: 77% domestic revenue, 18x P/E discount, Fed tailwinds
If you're bearish:
- :shield: February put spreads ($265/$255) offer defined-risk way to play downside
- :chart_with_downwards_trend: Watch for break below $265 gamma support as trigger
- :warning: Don't fight the tape - rotation has serious momentum, wait for catalyst
Mark your calendar - Key dates:
- :calendar: January 27-28 - FOMC Meeting (rate decision)
- :calendar: February 11 - January CPI release
- :calendar: February 20 - February Monthly OPEX + GDP release (put expires!)
- :calendar: March 20 - Triple Witch quarterly expiration
- :calendar: June 18 - Triple Witch (short put expires!)
Final verdict: The "Great Rotation" into small caps is REAL - supported by Fed rate cuts, valuation discount, and domestic revenue exposure. But with IWM near all-time highs and significant macro uncertainty (Fed, tariffs, zombie companies), smart money is hedging while staying long. Follow their lead: stay bullish but protect your gains. The $260 gamma wall is your friend - use it as your floor.
Be greedy when others are hedging, but hedge when you're greedy. :muscle:
Disclaimer: Options trading involves substantial risk of loss and is not suitable for all investors. This analysis is for educational purposes only and not financial advice. Past performance doesn't guarantee future results. The Z-scores reflect these specific trades' size relative to recent IWM history - they do not imply the trades will be profitable or that you should follow them. Always do your own research and consider consulting a licensed financial advisor before trading. ETFs carry market risk and can decline in value.
About iShares Russell 2000 ETF (IWM): The iShares Russell 2000 ETF tracks the Russell 2000 Index, providing broad exposure to small-cap U.S. equities. With $77.76 billion in assets under management and 0.19% expense ratio, it is the largest and most liquid Russell 2000 tracking fund. The ETF holds approximately 2,000 small-cap stocks across all sectors, with financials, industrials, and healthcare comprising the largest weights.