🔄 IWM Options Alert: $12.6M Put Roll Signals Position Adjustment
January 23, 2026 | Unusual Options Activity Analysis
Hey traders! 👋 We just spotted some significant positioning changes in IWM - someone's rolling out of a combined $12.6 million put position. Let me break down what's happening and why this matters for the small-cap outlook.
📊 What is IWM?
The iShares Russell 2000 ETF (IWM) is your gateway to America's small-cap universe. It tracks approximately 2,000 smaller U.S. companies - think regional banks, biotech startups, and industrial specialists rather than the mega-cap tech giants.
- Assets Under Management: ~$78 billion
- Expense Ratio: 0.19%
- What it tracks: Russell 2000 Index - the gold standard for small-cap benchmarking
- Current Context: Russell 2000 just came off a historic 13-session winning streak, now in the "Great Rotation of 2026"
🚨 Today's Unusual Options Activity
Here's what hit the tape at 12:45 PM ET:
| Time | Symbol | Buy/Sell | Call/Put | Expiration | Premium | Strike | Volume | Activity Level | Classification | Option Symbol |
|---|---|---|---|---|---|---|---|---|---|---|
| 12:45:07 | IWM | BUY | PUT | 2026-02-20 | $7.1M | $256 | 29,000 | ~1.6x avg | ABOVE_AVERAGE | IWM20260220P256 |
| 12:45:07 | IWM | BUY | PUT | 2026-02-20 | $5.5M | $253 | 28,000 | ~0.6x avg | TYPICAL | IWM20260220P253 |
🔄 Understanding the ROLL Strategy
Before you panic and think someone's betting $12.6M that small-caps are about to crash, let me explain what's actually happening here.
This is a ROLL, not a new bearish bet.
Both trades were marked as BTC (Buy to Close), meaning the trader is:
- Closing existing short put positions
- NOT opening new bearish bets
- Removing downside protection or premium-collection positions
What does this tell us?
- Position Unwinding: Someone previously sold these puts (either for premium income or as part of a larger strategy) and is now exiting
- Bullish Signal?: Closing short puts can actually be bullish - it suggests the trader no longer wants the obligation to buy shares at $253-$256
- Cost to Close: They paid $12.6M to exit these positions, meaning the puts had value (IWM is trading near/at these strikes)
The Numbers:
- $256 Put: ~3.6% out-of-the-money from current $265.125 price
- $253 Put: ~4.6% out-of-the-money
- Combined Volume: 57,000 contracts
- Days to Expiration: 28 days (Feb 20 OPEX)
📈 Technical Analysis
YTD Performance
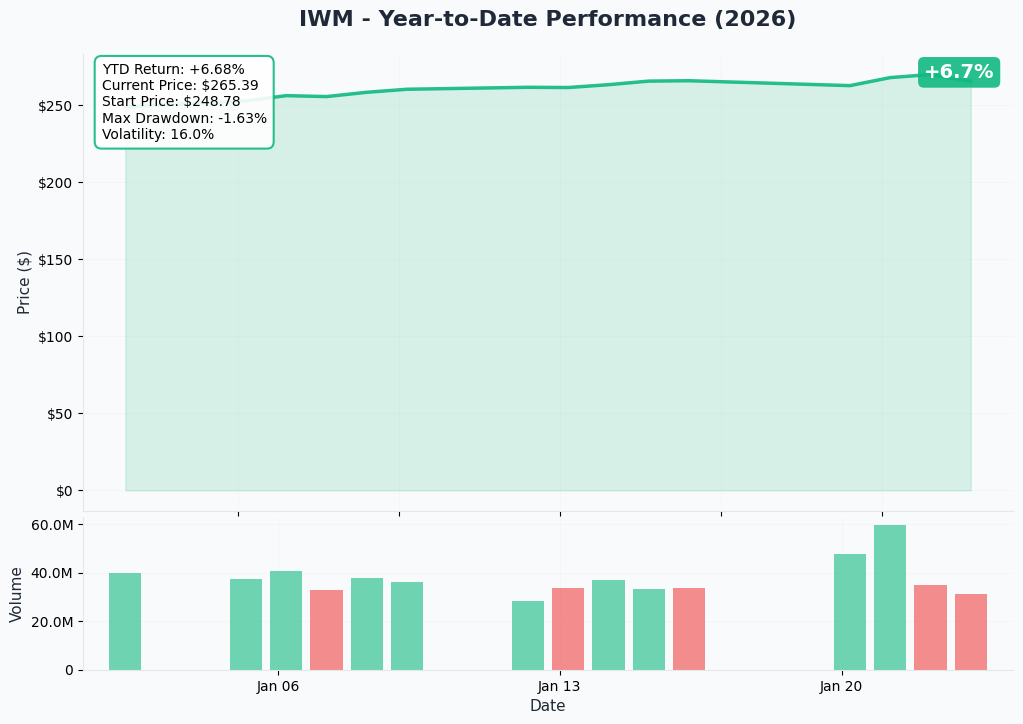
The chart tells an impressive story for 2026:
- Current Price: $265.125
- YTD Return: +6.8% to +8.75% (Russell 2000 Index)
- 52-Week High: $271.60 (hit January 22, 2026)
- Historic Streak: 13 consecutive winning sessions through Jan 21 - tying the 2008 record!
Gamma Exposure & Key Levels
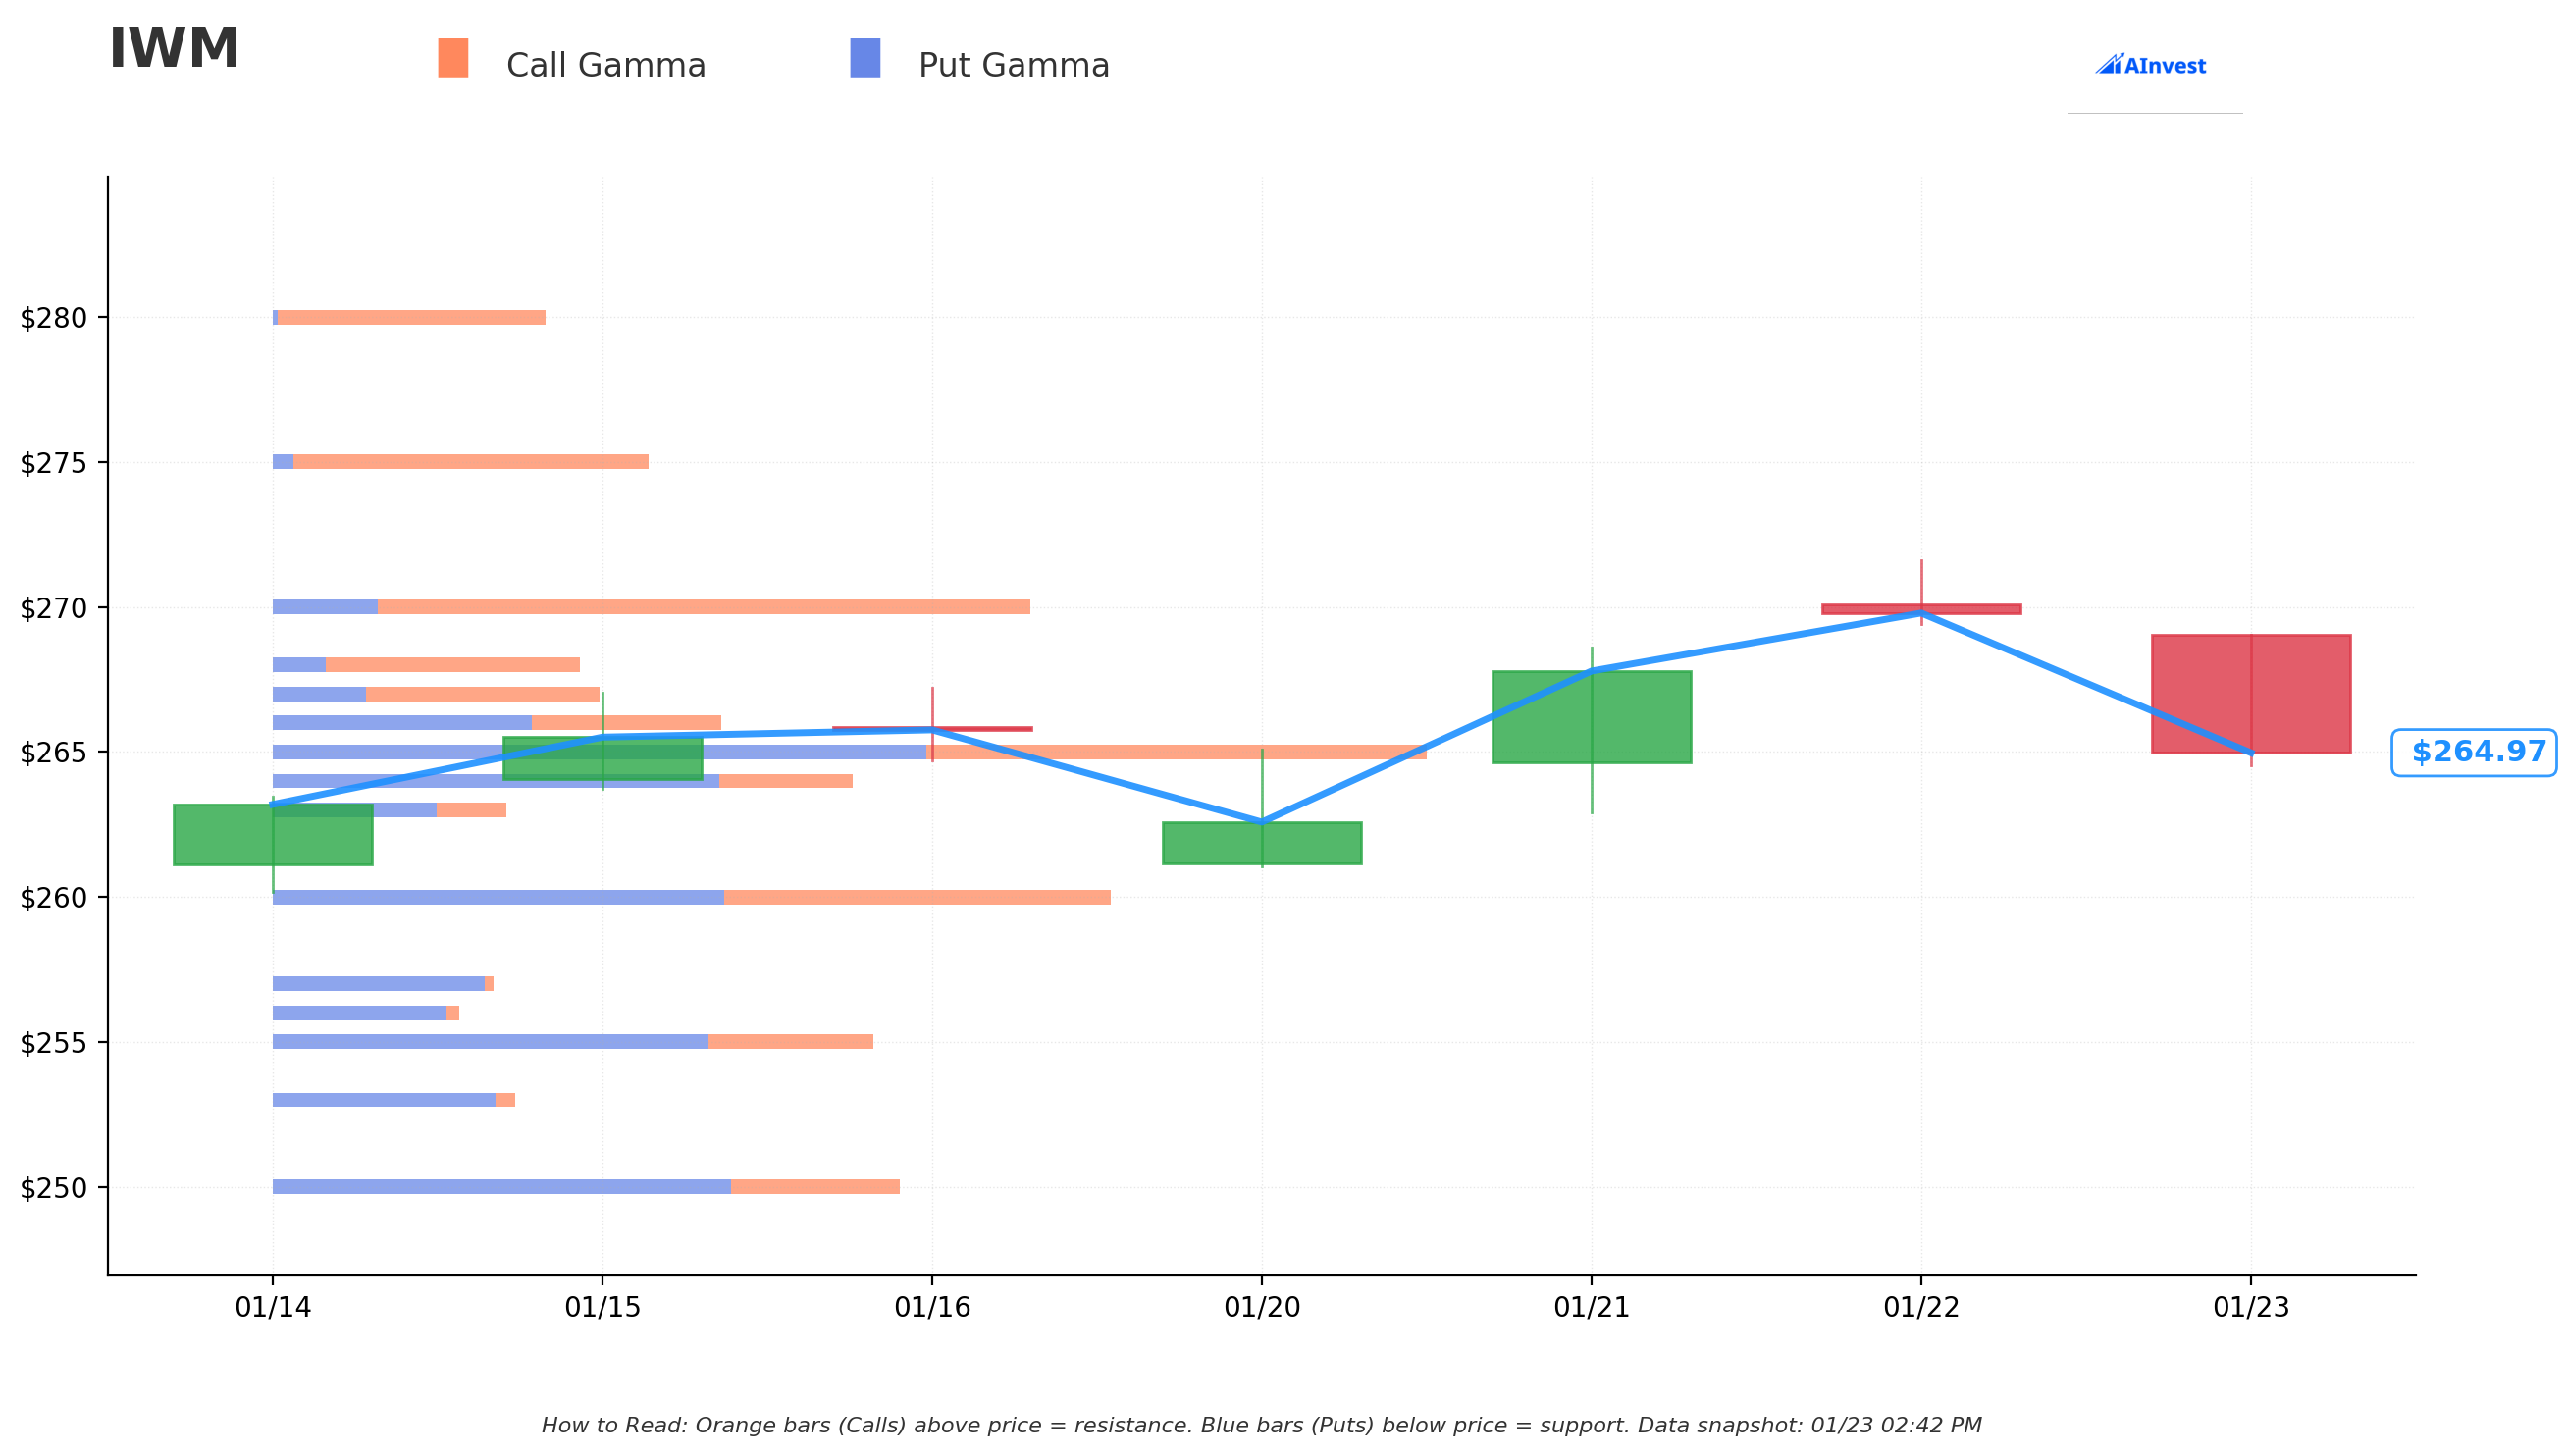
Here's where the options market is showing us something unusual - the GEX (Gamma Exposure) is BEARISH despite IWM sitting near all-time highs.
Net GEX Bias: BEARISH (Put Gamma > Call Gamma)
- Total Call GEX: 970.5
- Total Put GEX: 1,338.9
- Implication: More put gamma means dealers are short puts, creating potential downside acceleration if we break support
Key Support Zones 🛡️
- $265: CRITICAL - Right at current price! Strongest support
- $264: Secondary support
- $260: Major support level
- $255-256: Where today's rolled puts were struck
- $250: Deep support
- $245-240: Emergency support levels
Resistance Levels 🚀
- $266: Immediate resistance (just 0.3% above)
- $270: Next major target
- $275: Upper channel resistance
The Bearish GEX Setup: This is unusual - typically at all-time highs you'd expect bullish gamma. The heavy put gamma suggests market makers are positioned for volatility. If IWM breaks below $265, the delta hedging could accelerate selling.
Implied Move Analysis
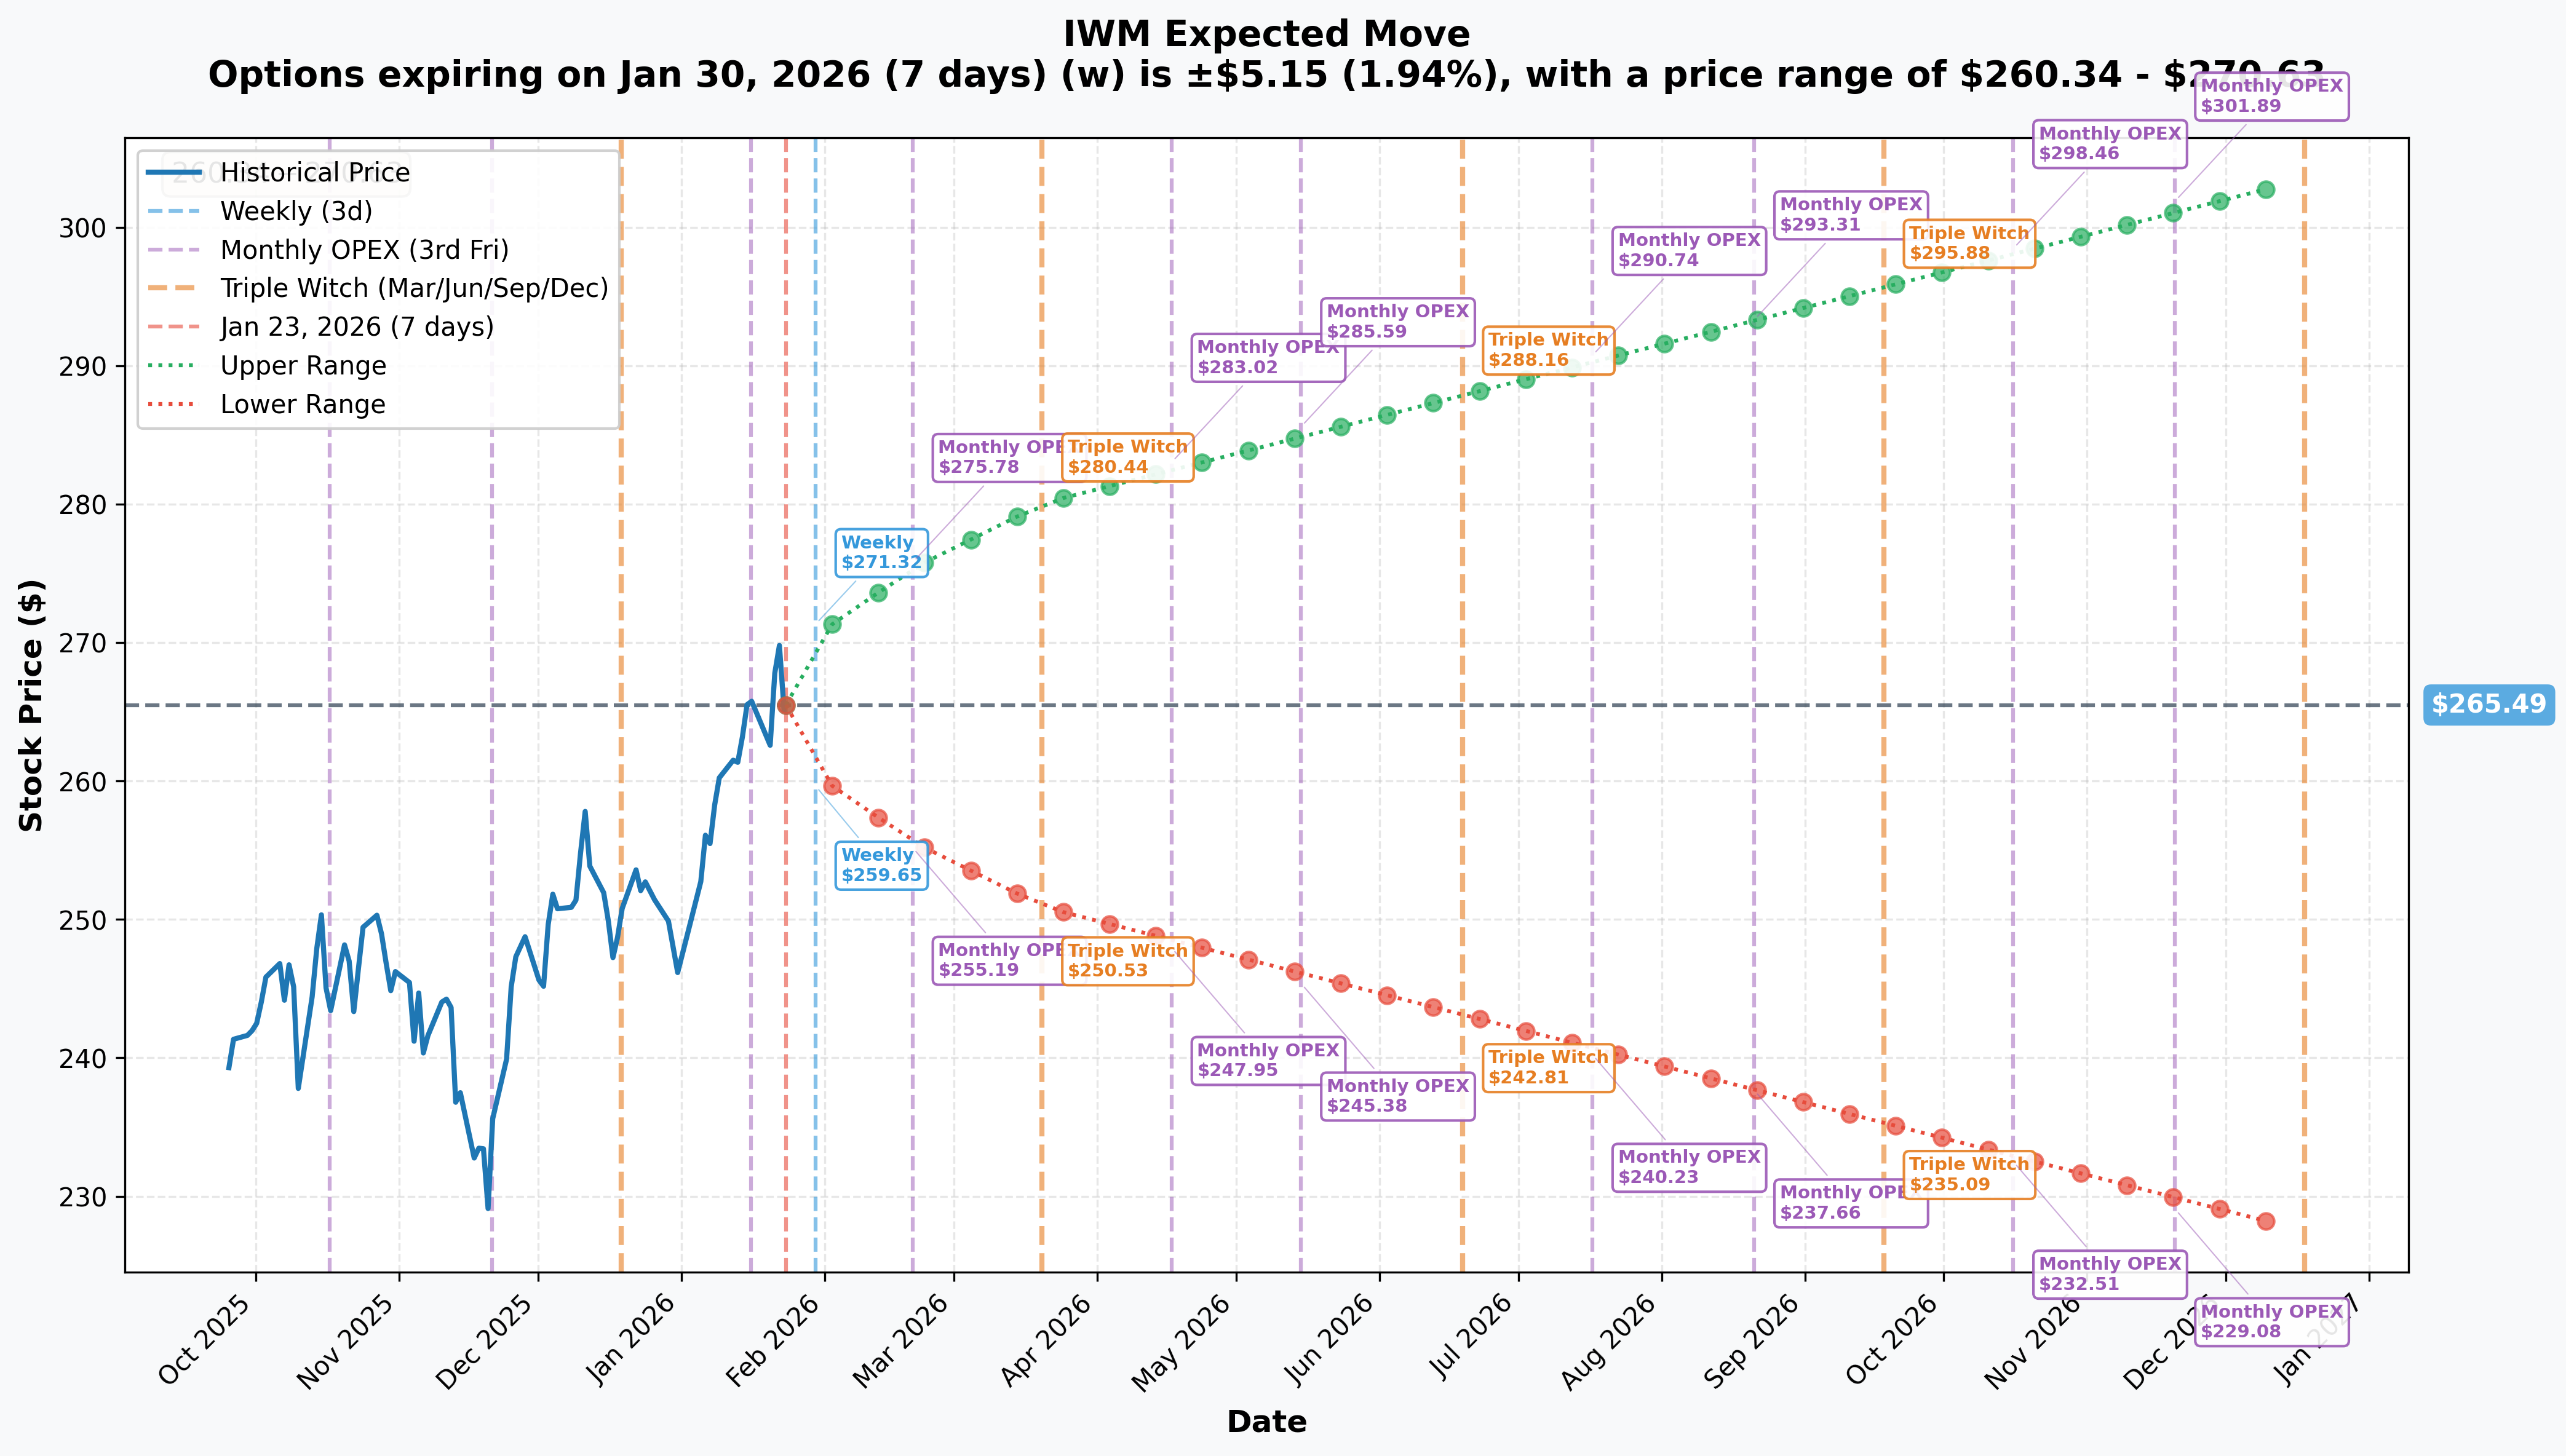
The options market is pricing in the following expected moves:
| Timeframe | Expected Range | Move % |
|---|---|---|
| Daily (0DTE) | $264.90 - $266.07 | ±0.22% |
| Weekly (Jan 30) | $260.34 - $270.63 | ±1.94% |
| Monthly OPEX (Feb 20) | $255.52 - $275.45 | ±3.75% |
| Quarterly (Mar 20) | $250.87 - $280.10 | ±5.51% |
| Yearly LEAPS | $227.45 - $303.52 | ±14.33% |
Key Insight: The $256 and $253 puts being rolled are right at the lower bound of the monthly expected move ($255.52). The trader closing these puts is essentially saying they don't want to be on the hook if IWM drops to the bottom of its expected range.
🗓️ Upcoming Catalysts
Near-Term Events (Next 30 Days)
FOMC Meeting: January 28-29, 2026 🏦
- Markets pricing in continued easing (2 more cuts expected in 2026)
- Small-caps historically average +36% in the 12 months following the last rate cut
- Risk: Sticky inflation data could pause the cutting cycle
Q4 2025 Earnings Season 📊
- Small-cap earnings growth forecast: 19% vs. large-cap 12%
- This is the first year small-caps are expected to outpace large-caps on earnings
- Peak reporting through mid-February
Russell 2000 Index Milestone
- Currently near record highs (~2,882)
- Historic 13-session winning streak just completed
Longer-Term Catalysts
1. The "Great Rotation" Thesis 🔄 The rotation from mega-cap tech to small-caps is in full swing:
- Russell 2000: +6.8% YTD vs. S&P 500: +1.2%
- Magnificent Seven growth decelerating from 36% to ~18%
- Valuation gap at 25-year extreme (Russell 2000 P/E: 18x vs. S&P 500: 31x)
2. Biotech M&A Wave 💊
- Big Pharma sitting on ~$1 trillion cash for acquisitions
- $236 billion in annual revenue at risk from patent cliffs
- Small-cap biotechs trading at 47% discount from 2021 peaks
3. Legislative Tailwinds 📜
- One Big Beautiful Bill Act providing $100B in consumer tax refunds H1 2026
- Domestic manufacturing incentives benefiting small-caps
- Reshoring trend favoring Russell 2000 industrials
4. Tariff Risks ⚠️
- Trump administration tariff proposals (20-60%)
- Small-caps with domestic focus could benefit vs. multinationals
- Supreme Court case on emergency tariff powers pending
🎯 Price Targets & Probabilities
Based on gamma levels, implied moves, and market positioning:
🐻 Bear Case (30% probability)
- Target: $255-260
- Catalyst: Hawkish Fed surprise, inflation spike, tariff escalation
- Note: This is where today's rolled puts were struck - the trader exiting doesn't want to be assigned here
- GEX Warning: The bearish gamma structure could accelerate any selloff
🎯 Base Case (45% probability)
- Target: $265-275
- Catalyst: Continued rotation, Fed cuts, solid earnings
- Timeline: Through Feb OPEX
- The Setup: Hold the $265 support, grind higher toward $270-275
🚀 Bull Case (25% probability)
- Target: $280+
- Catalyst: Aggressive Fed easing, blowout earnings, M&A surge
- Timeline: Q1 2026
- Why Limited: Overbought conditions and bearish gamma cap near-term upside
💡 Trading Ideas
Conservative Play 🛡️
Cash-Secured Put at Support
- Sell IWM Feb 20 $255 Put
- Premium: ~$1.50-2.00
- Max Risk: Assignment at $255 (3.8% below current)
- Why: Collect premium at the lower bound of the expected move. If assigned, you're buying at attractive levels with the Great Rotation thesis intact.
Balanced Strategy ⚖️
Bull Put Spread (Playing the Support)
- Sell IWM Feb 20 $260 Put
- Buy IWM Feb 20 $255 Put
- Credit: ~$1.20-1.50
- Max Risk: $5 spread width - credit received
- Why: Define your risk while betting that $260 support holds through Feb OPEX
Aggressive Approach 🔥
Call Spread for the Breakout
- Buy IWM Mar 20 $270 Call
- Sell IWM Mar 20 $280 Call
- Debit: ~$2.50-3.00
- Max Profit: $10 spread - premium paid
- Why: Leveraged bet on the Great Rotation continuing, with the quarterly implied move supporting a move to $280
⚠️ Risk Factors
Let's keep it real - here's what could derail the small-cap rally:
-
The Bearish Gamma Problem ⚡
- Put GEX exceeds Call GEX - unusual at all-time highs
- A break below $265 could trigger dealer hedging that accelerates selling
- Watch the $264 level closely
-
Rate Risk 📈
- January 7, 2026 saw a 2.4% single-day drop on inflation fears
- Small-caps are highly rate-sensitive (floating debt, smaller cash reserves)
- Fed pause would hurt the rotation thesis
-
Overbought Conditions 📊
- RSI readings near 70+
- 13-session winning streak is historically extended
- Some mean reversion is healthy and expected
-
Economic Sensitivity 🏭
- GDP growth expected to slow to 1.5% in 2026
- Job gains projected to drop from 125K/month to 55K/month
- Small-caps are the canary in the coal mine
-
The $12.6M Exit 🚪
- Someone paid $12.6M to close these puts
- While bullish on its face, it could signal concern about larger moves ahead
- Institutional money often knows something before we do
🎬 The Bottom Line
Today's $12.6M put roll in IWM is creating an interesting narrative. Someone's closing out downside exposure right as the Russell 2000 sits near all-time highs during the "Great Rotation of 2026."
The Bullish Case: Closing short puts removes bearish positioning. The trader is essentially betting they won't get assigned at $253-256, implying confidence that IWM stays elevated. The fundamental story (Fed cuts, earnings growth, valuation gap) remains compelling.
The Cautionary Tale: The bearish gamma structure is a yellow flag. When put gamma exceeds call gamma at all-time highs, it suggests the options market is hedged for downside. The $265 support level is critical - a break could trigger accelerated selling.
My Take: The Great Rotation thesis is real, but the easy money has been made in the 13-session sprint. I'd look for pullbacks toward $260-264 as better entry points. The Feb 20 OPEX timeframe (when those rolled puts expire) could see some volatility as positions adjust.
The fact that institutional money is paying $12.6M to exit put exposure is notable - they're not positioning for a crash. But the gamma structure demands respect. Trade smaller, keep stops tight, and don't chase all-time highs.
Remember - this isn't financial advice, just one trader sharing what the tape is telling us. Size your positions appropriately and always have a plan!
Stay disciplined out there! 🎯
Analysis based on options flow data from January 23, 2026. Always do your own research before making any trades.