🐋 IWM $13.1M Bull Put Spread - Institutional Whale Bets Small Caps Hold Strong Into FOMC!
📅 January 27, 2026 | 🔥 Unusual Activity Detected
🎯 The Quick Take
Someone just deployed a $13.1M bull put spread on IWM at 11:57:06 this morning - selling $265 puts and buying $263 puts for a $1.9M net credit, both with 20,972 contracts expiring February 5th. This is a short-term income bet that the Russell 2000 stays above $265 through next Thursday - right through tomorrow's FOMC decision. Translation: a major player is collecting premium betting small caps don't break down during the Fed meeting.
📊 ETF Overview
iShares Russell 2000 ETF (IWM) is the most widely traded small-cap ETF in the world, tracking roughly 2,000 of the smallest U.S. publicly traded companies:
- 💰 AUM: $78.4 Billion
- 📊 Holdings: 1,958 individual stocks
- 🏢 Top Sectors: Financials (~22.3%), Healthcare (~13.8%), Industrials, Consumer Discretionary
- 📈 Current Price: $264.01
- 🎯 52-Week Range: $171.73 - $271.60
- 📊 YTD Performance: +9.6% to +12.7%
- 💸 Expense Ratio: 0.19%
- 📉 Beta: ~1.3 (vs S&P 500)
What does IWM track? Think of it as the "everything else" ETF - it holds the 2,000 smallest companies in the Russell 3000 index. These are domestic-focused businesses across every sector, from regional banks to biotech startups to small manufacturers. No single stock exceeds 1% of the portfolio, making it a pure play on U.S. small-cap health.
💰 The Option Flow Breakdown
📊 The Tape (January 27, 2026)
This is a Bull Put Spread - both legs executed simultaneously at 11:57:06 with identical size of 20,972 contracts:
| Time | Symbol | Side | Buy/Sell | Type | Expiration | Premium | Strike | Volume | OI | Size | Spot | Option Price | Option Symbol |
|---|---|---|---|---|---|---|---|---|---|---|---|---|---|
| 11:57:06 | IWM | MID | BUY | PUT $263 | 2026-02-05 | $5.6M | $263 | 21,000 | 293 | 20,972 | $264.01 | $2.69 | IWM20260205P263 |
| 11:57:06 | IWM | BELOW BID | SELL | PUT $265 | 2026-02-05 | $7.5M | $265 | 21,000 | 21,000 | 20,972 | $264.01 | $3.56 | IWM20260205P265 |
🤓 What This Actually Means
This is a classic bull put spread (also called a short put spread) - a credit strategy where you:
- 📤 Sell the higher strike put ($265) - collecting $3.56/contract ($7.5M total)
- 📥 Buy the lower strike put ($263) - paying $2.69/contract ($5.6M total)
- 💰 Net credit received: $0.87/contract x 20,972 = $1.9M pocketed upfront
- 🛡️ Max risk: $2.00 spread width - $0.87 credit = $1.13/contract = $2.4M max loss
- 📊 Max profit: The $1.9M credit (if IWM closes above $265 on February 5th)
- 🎯 Breakeven: $264.13 (just $0.12 above where IWM was trading!)
What's really happening here:
This trader is betting IWM stays above $265 for just 7 trading days. They're willing to risk $2.4M to collect $1.9M. That's a 79% reward relative to risk with a very short time horizon. The fact that the $265 put was sold BELOW the bid (aggressive execution) shows urgency - they wanted this fill NOW.
The timing is key: This trade expires AFTER tomorrow's FOMC rate decision and after Thursday's Q4 GDP first estimate. The trader is betting these macro events won't tank small caps.
Size context: 20,972 contracts on each leg is substantial. Volume of 21,000 against open interest of just 293 on the $263 strike means this flow overwhelmed existing positions - this is fresh, aggressive positioning.
📈 Technical Setup / Chart Check-Up
1-Year Performance Chart
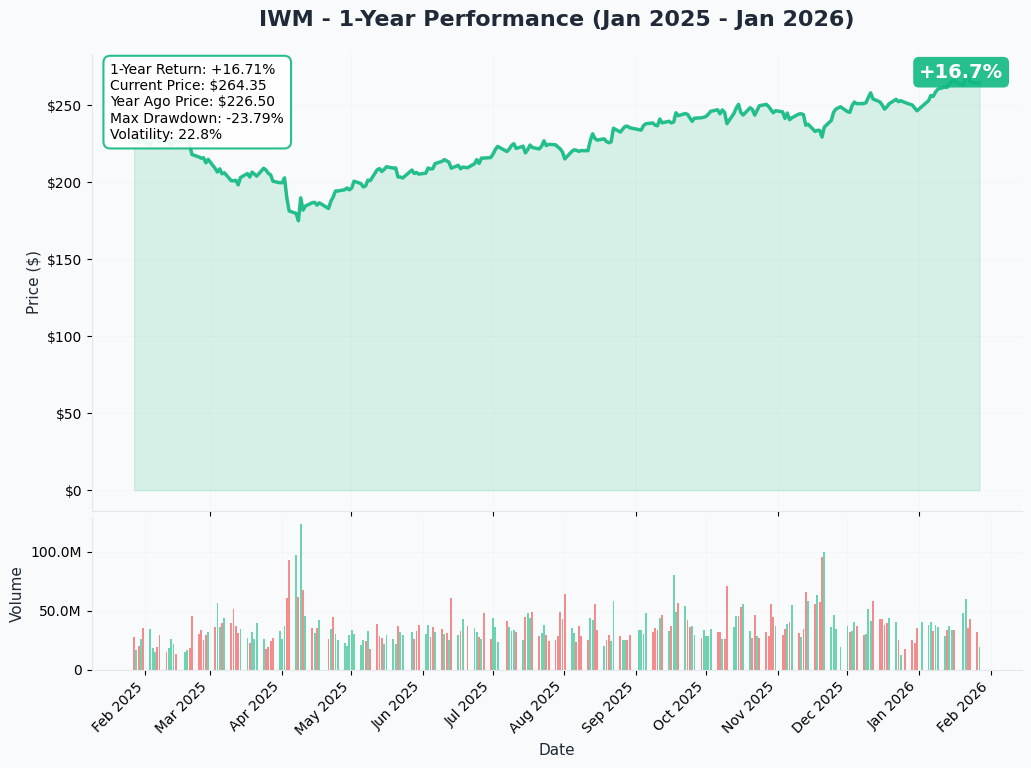
IWM is having a strong start to 2026, up roughly +10% YTD after the "Great Rotation" drove capital from mega-cap tech into small caps. The Russell 2000 posted a historic 15-session streak of daily outperformance versus the S&P 500 before snapping on January 23.
Key observations:
- 🚀 January surge: IWM jumped 8.2% in the first three weeks, crushing the S&P 500's 1.9% gain
- 📊 52-week high: Hit $271.60 on January 22 before pulling back
- 📉 Recent pullback: Down from $271.60 to $264 area (-2.8%) after the streak ended
- 🎯 Trading right at decision zone: Sitting between recent highs and key support levels
🔵🟠 Gamma-Based Support & Resistance Analysis
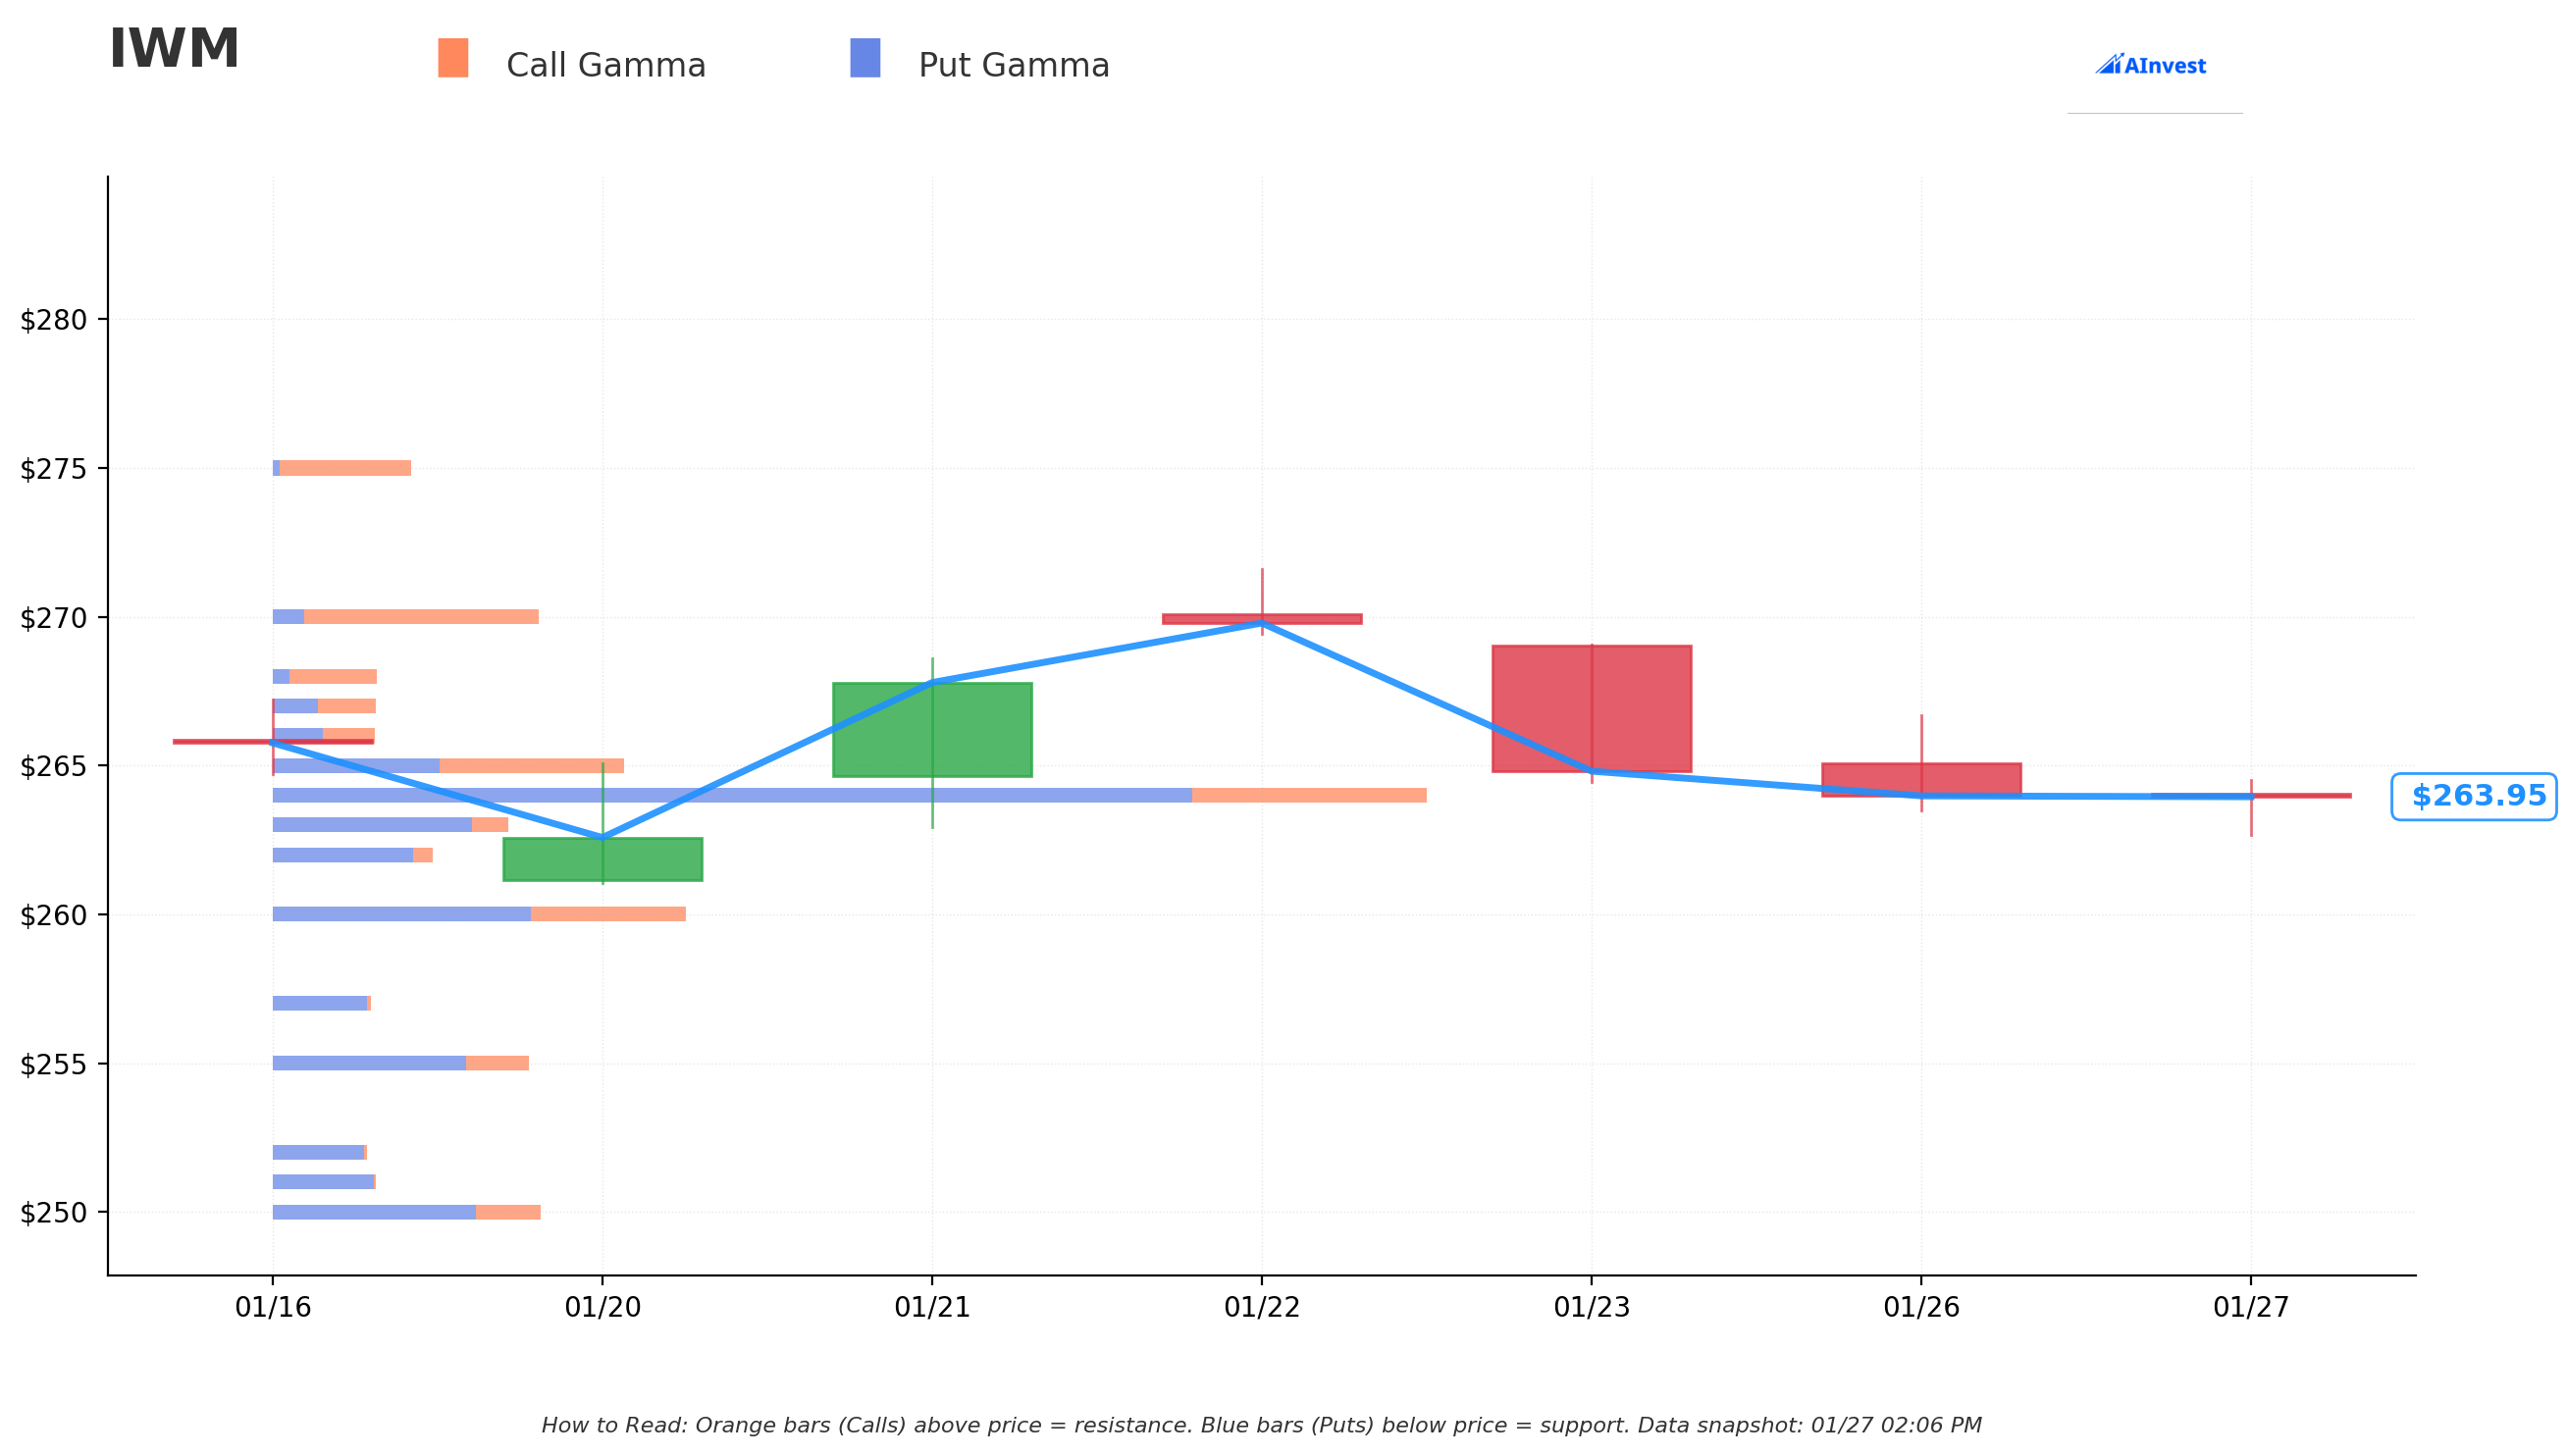
Current Price: $263.89
The gamma exposure map reveals where market makers have the heaviest positioning, creating natural price magnets and barriers:
🔵 Support Levels (Put Gamma Below Price):
- $263 - Strongest nearby support with 121.6 total gamma exposure (the put spread's lower strike sits RIGHT here)
- $262 - Secondary support at 83.8 gamma
- $260 - Major structural floor with 217.3 gamma (highest total gamma below price - this is the LINE IN THE SAND)
- $255 - Deep support at 134.3 gamma
- $250 - Extended floor with 140.8 gamma
🟠 Resistance Levels (Call Gamma Above Price):
- $264 - Immediate ceiling with massive 583.2 total gamma (STRONGEST level on the board!)
- $265 - Secondary resistance at 191.1 gamma (the put spread's short strike)
- $270 - Extended resistance at 140.4 gamma
What this means for the trade:
The $264 strike has ENORMOUS gamma exposure (583.2 - by far the largest on the board). This creates a massive gravity well - market makers are heavily positioned here and will defend this level in both directions. IWM is essentially pinned near $264, which is exactly what a bull put spread seller wants. The trader needs IWM to stay above $265 or at least above $264.13 breakeven - and the gamma data suggests the $260-$264 zone is well-supported.
Net GEX Bias: Bearish (1,959 put gamma vs 1,036 call gamma) - Put gamma dominates overall, which means market makers are likely short puts and will BUY the dip to hedge, creating natural support. This actually helps the bull put spread thesis.
📊 Implied Move Analysis
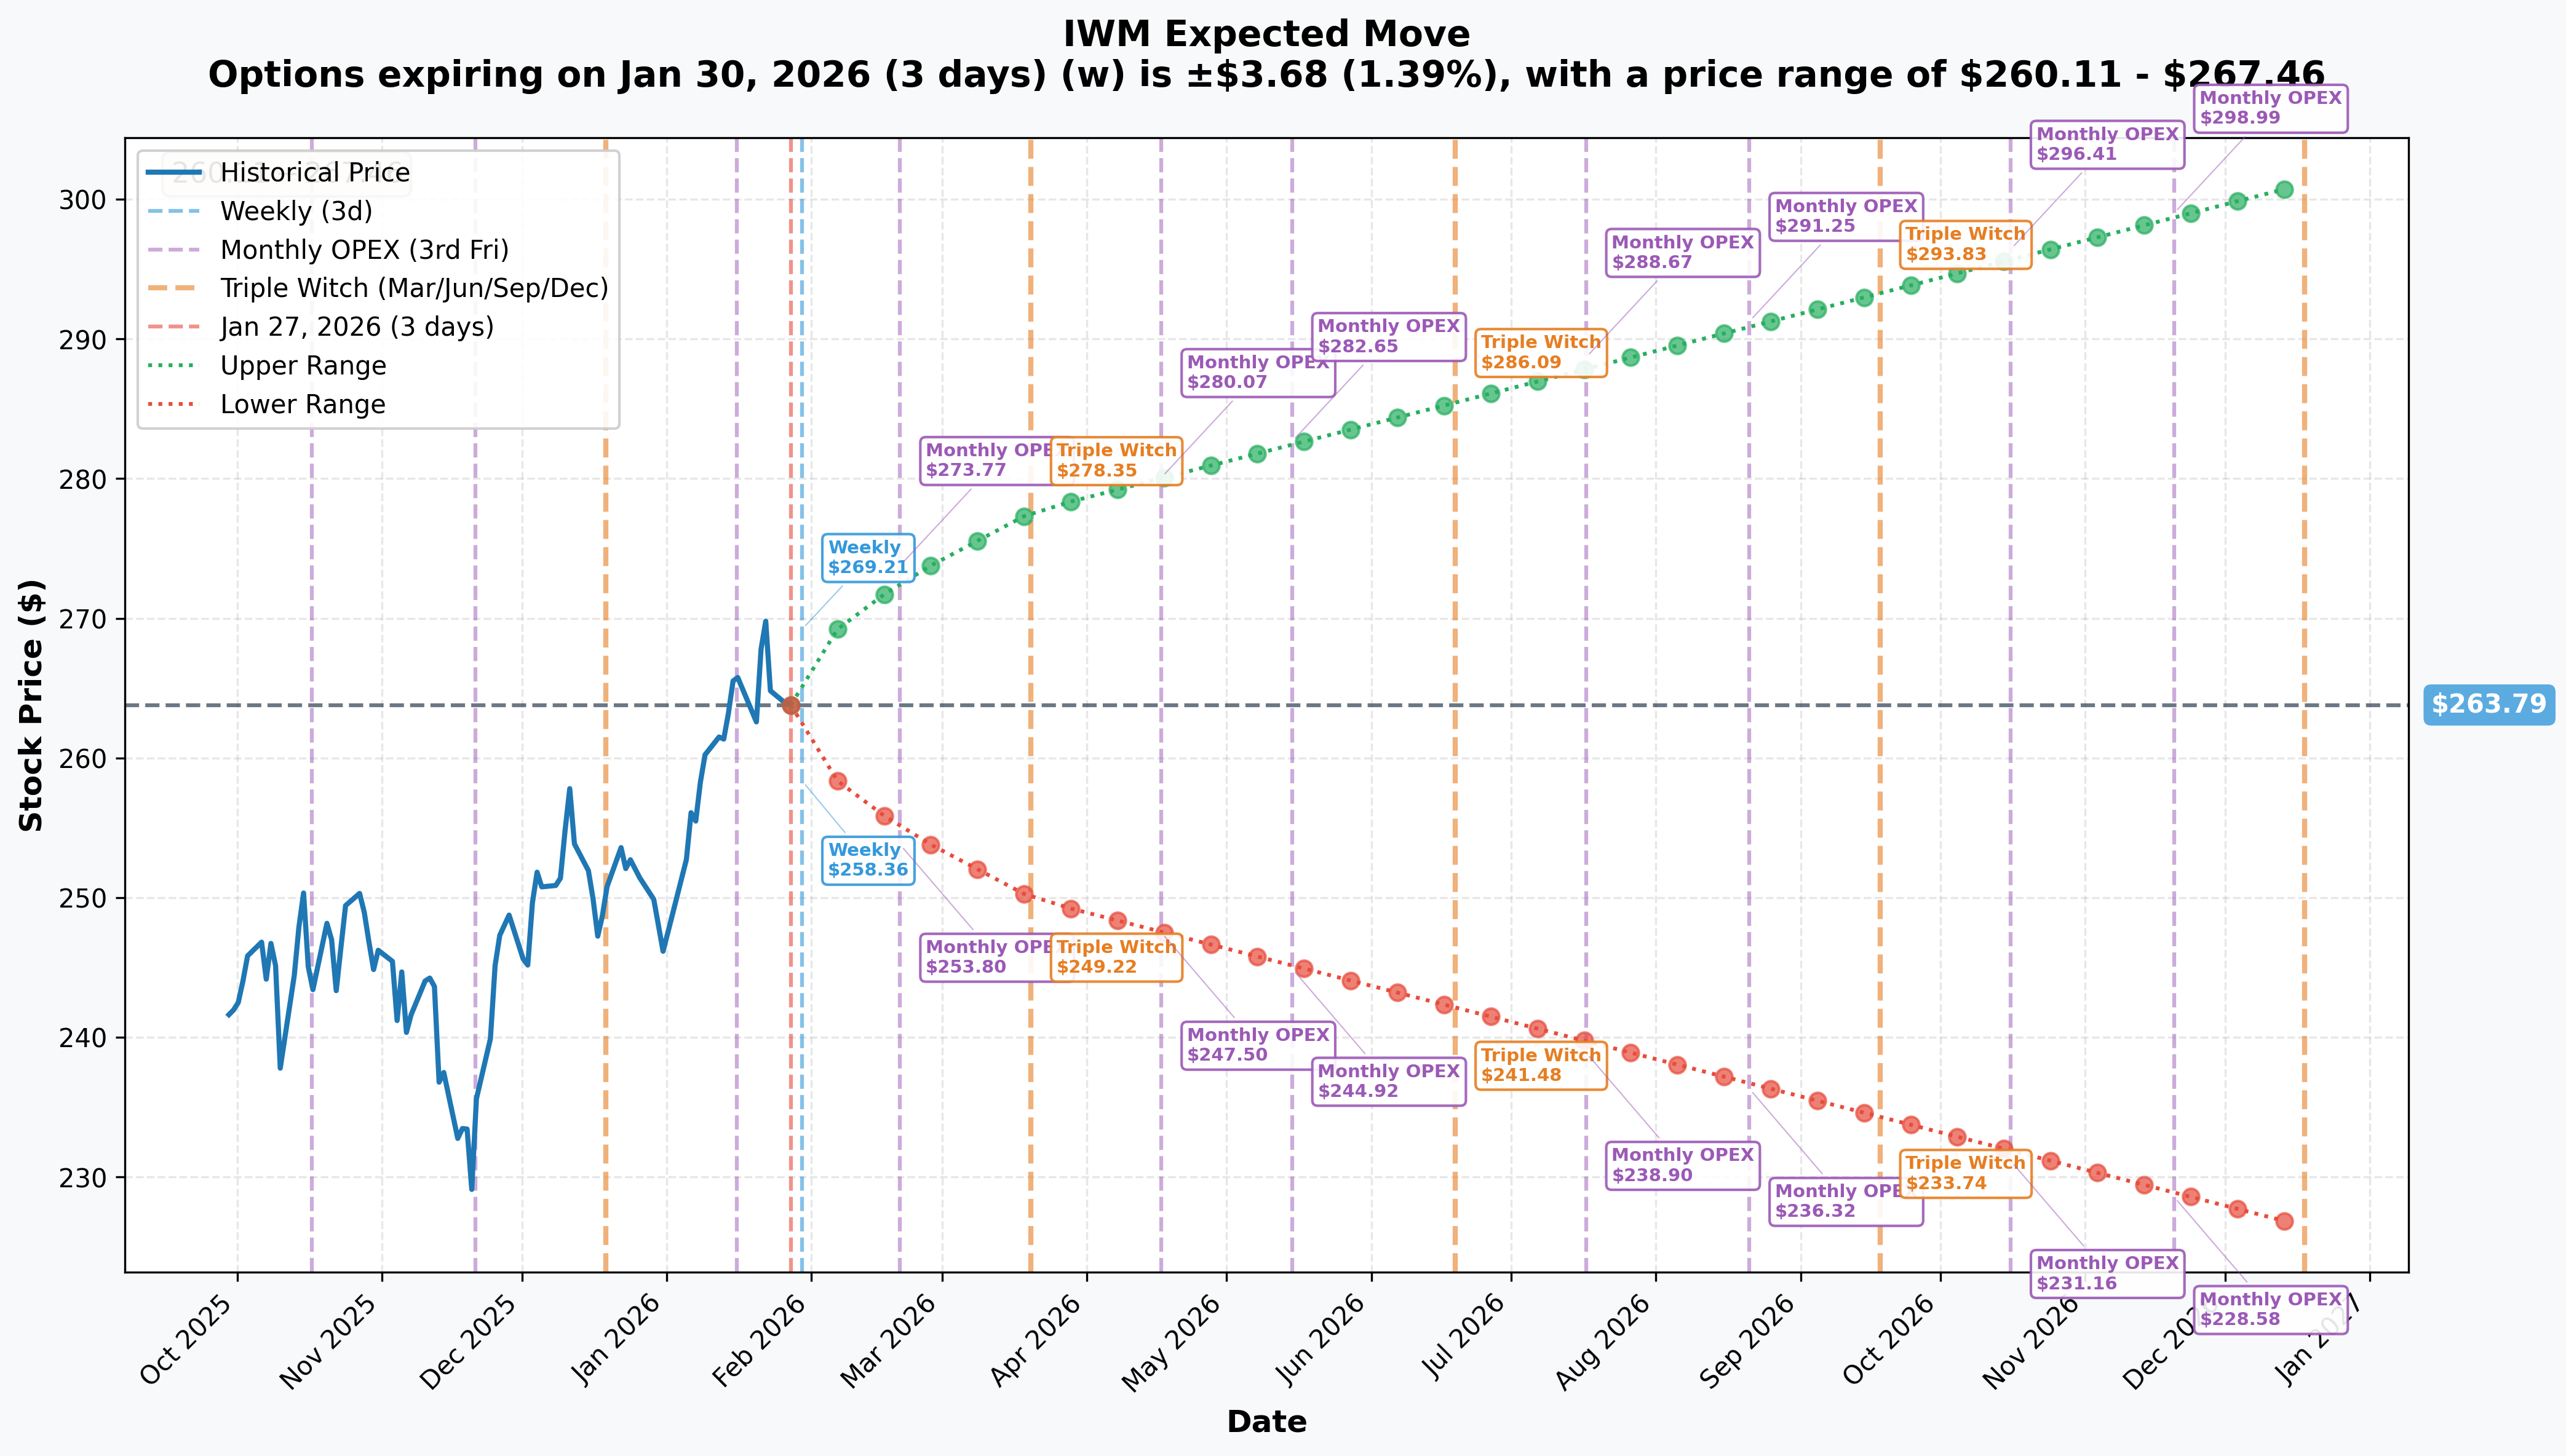
Options market pricing for upcoming expirations:
- 📅 Weekly (Jan 30 - 3 days): +/-1.39% ($3.68) --> Range: $260.11 - $267.46
- 📅 Monthly OPEX (Feb 20 - 24 days): +/-3.38% ($8.92) --> Range: $254.86 - $272.71
- 📅 Quarterly Triple Witch (Mar 20 - 52 days): +/-5.26% ($13.88) --> Range: $249.91 - $277.66
- 📅 Yearly LEAPS (Dec 18 - 325 days): +/-14.16% ($37.35) --> Range: $226.43 - $301.14
Translation for regular folks:
The options market expects IWM to move about 1.4% ($3.68) by this Friday - that's a range of $260 to $267. The bull put spread needs IWM above $265 by February 5th, which sits within the upper half of the weekly implied range. The monthly expected range goes down to $254.86, but the trade expires well before that on February 5th.
Key insight: The implied weekly move of $3.68 means IWM could realistically trade anywhere from $260 to $267 by Friday. The put spread's breakeven of $264.13 sits right in the middle of that range - this trader is betting IWM stays in the upper half. With the FOMC expected to hold rates (97% probability per CME FedWatch), a no-surprise Fed meeting could easily keep IWM above $265.
🎪 Catalysts
🔥 Immediate Catalysts (This Week - CRITICAL for This Trade!)
FOMC Rate Decision - January 28, 2026 (TOMORROW!) 🏛️
The Fed's first meeting of 2026 concludes tomorrow with the rate decision at 2:00 PM EST and Chair Powell's press conference at 2:30 PM EST:
- 📊 97% probability of a rate HOLD at 3.50-3.75%
- 🎯 Key watch: Forward guidance language and signals about timing of next cut
- ❌ No Summary of Economic Projections (dot plot) at this meeting
Q4 2025 GDP First Estimate - January 29 (Thursday) 📊
The BEA releases the advance GDP estimate for Q4 2025. GDP growth expectations are healthy - Goldman forecasts 2.6% for 2026 and Q3 2025 came in at a strong 4.3%.
PCE Deflator - January 29 (Thursday) 📊
The Fed's preferred inflation gauge releases same day as GDP. This is critical for rate cut expectations.
📈 Recent Catalysts (Already Happened)
The "Great Rotation" of January 2026 🔄
Starting January 5, capital aggressively rotated out of mega-cap tech into small caps. The Russell 2000 set new all-time highs on January 8 and outperformed the S&P 500 for 15 consecutive sessions - the longest streak since May 1996. Drivers include:
- 📉 Mag 7 earnings growth decelerating from 36% (2024) to projected 18% (2026)
- 💰 Multi-cap fund managers 60% underweight small caps - lowest since the GFC
- 📊 25-year extreme valuation discount: Russell 2000 at 18x forward P/E vs S&P 500's 26x
Fed Rate Cuts in Late 2025 📉
The Fed delivered three consecutive 25 bps cuts in Q4 2025, bringing rates to 3.50-3.75%. This is a direct tailwind for small caps since Russell 2000 companies carry more floating-rate debt than large caps.
Weak December Jobs Report (January 9) 📋
Only 50,000 jobs added in December with the hiring rate at 3.2% - one of the weakest readings since the Great Recession. This initially supported rate-cut expectations.
🚀 Upcoming Catalysts (Next 2 Months)
- 📅 Feb 6: January Employment Situation - Labor market health check
- 📅 Feb-Mar: Bulk of Russell 2000 Q4 earnings reports (62.5% YoY growth expected)
- 📅 Mar 17-18: FOMC Meeting + Dot Plot - Next major rate decision with updated projections
- 📅 Ongoing: Small-cap M&A boom - $440B in PE dry powder targeting acquisitions
🎲 Price Targets & Probabilities
Using gamma levels, implied move data, and the catalyst calendar, here are the scenarios through the February 5th expiration:
📈 Bull Case (40% probability)
Target: $267-$272
How we get there:
- 🏛️ FOMC holds rates as expected with dovish forward guidance hinting at March cut
- 📊 Q4 GDP comes in strong, supporting the rotation thesis
- 🔄 "Great Rotation" resumes as fund managers continue closing their 60% underweight
- 💰 IWM pushes through $265 gamma resistance toward $270 (next major level at 140.4 gamma)
- 🎯 Monthly implied upper range of $272.71 becomes achievable
Impact on the trade: MAX PROFIT - Put spread expires worthless, trader keeps full $1.9M credit. Best possible outcome.
🎯 Base Case (35% probability)
Target: $262-$267 (choppy range)
Most likely scenario:
- ✅ Fed holds rates (no surprise), Powell's comments create modest volatility but no trend change
- 📊 GDP data comes in roughly in-line, no major market reaction
- ⚖️ IWM oscillates around $264-265 as massive gamma at $264 (583.2) pins price action
- 🔄 Consolidation after January surge - neither breaking out nor breaking down
Impact on the trade: Depends on exact closing price. Above $264.13 breakeven = profit. The $264 gamma wall should provide support, making a partial win likely. Trader probably collects $1.0-1.5M of the $1.9M credit.
📉 Bear Case (25% probability)
Target: $255-$262
What could go wrong:
- 😰 Powell delivers unexpectedly hawkish comments (delays rate cut expectations)
- 📉 GDP data disappoints, raising recession fears that hit small caps harder
- 🚨 January rotation snaps further as seasonal flows reverse
- 💸 IWM breaks below $263 gamma support, accelerating toward $260 (major floor at 217.3 gamma)
- ⚠️ No manufacturing recovery reality catches up with rally pricing
Impact on the trade: PARTIAL to FULL LOSS. If IWM closes below $263 on Feb 5, max loss of $2.4M. Between $263-$264.13, partial loss. The $260 gamma support with 217.3 exposure should limit downside.
Put Spread P&L Scenarios at Feb 5 Expiration:
- 📈 IWM at $266+ --> Max profit: +$1.9M (credit kept)
- ⚖️ IWM at $264.13 --> Breakeven: $0
- 📉 IWM at $263 or below --> Max loss: -$2.4M
💡 Trading Ideas
🛡️ Conservative: "The Sleep Well" - Watch and Wait
Play: Stay on the sidelines through FOMC and GDP this week, then reassess
Why this works:
- 🏛️ Two HIGH-impact macro events in the next 48 hours (Fed + GDP) create binary risk
- 📊 IWM already up 10% YTD - strong start means some giveback is natural
- ⏰ Better entries likely after macro dust settles by early February
- 🤔 The put spread trader is a premium SELLER (sophisticated strategy) - retail is better off waiting for clarity before picking direction
Action plan:
- 👀 Watch Powell's press conference tomorrow at 2:30 PM for tone on future cuts
- 🎯 If IWM holds above $260 through this week, look for February entry
- ✅ Target entry on pullback to $258-262 range for long shares or bullish strategies
- 📊 Use the weekly implied range ($260-$267) as your guide for the week
Risk level: Minimal | Skill level: Beginner-friendly
⚖️ Balanced: "The Rotation Rider" - February Bull Put Spread
Play: Sell your own bull put spread at wider strikes with February 20 OPEX expiration
Structure: Sell $260 puts, buy $255 puts (February 20 expiration)
Why this works:
- 🎯 $260 is where MASSIVE gamma support sits (217.3 total gamma - strongest support on the board)
- 📊 Gives you $4 of cushion below current price vs the whale's $1 cushion
- 🔄 Benefits from the ongoing Great Rotation thesis and rate cut tailwind
- 💰 Monthly implied lower range is $254.86 - your long put at $255 catches you right at implied support
- ⏰ Wait until AFTER FOMC tomorrow to enter (let macro risk pass first)
Estimated P&L:
- 💰 Collect ~$1.50-2.00 credit per spread ($150-200 per contract)
- 📈 Max profit if IWM above $260 at Feb 20 OPEX
- 📉 Max loss: $3.00-3.50 per spread ($300-350 per contract)
- 🎯 Breakeven: ~$258-258.50
Position sizing: 5-10 contracts max ($1,500-3,500 max risk) | Risk level: Moderate | Skill level: Intermediate
🚀 Aggressive: "The FOMC Fade" - Weekly Call Spread
Play: Buy a call spread targeting the resumption of the rotation trade after a benign Fed meeting
Structure: Buy $265 calls, sell $270 calls (January 30 weekly expiration)
Why this works:
- 🏛️ 97% odds of a rate hold tomorrow - if Powell sounds even slightly dovish, small caps could pop
- 📊 IWM sitting at $264 right under $265 gamma resistance - a breakout through $265 targets $270 quickly
- 🔄 Fund managers still massively underweight small caps - any positive catalyst could resume the rotation
- ⏰ Only 3 days to expiration = cheap entry but high theta decay risk
Estimated P&L:
- 💰 Cost: ~$1.50-2.00 per spread ($150-200 per contract)
- 📈 Max profit: $3.00-3.50 if IWM above $270 by Friday
- 📉 Max loss: Entire premium if IWM below $265 (100% loss)
- 🎯 Breakeven: ~$266.50-267.00
CRITICAL WARNING: This is a VERY short-dated trade with binary FOMC risk. Only for traders who understand time decay and can monitor positions intraday. Could easily lose 100% of premium.
Position sizing: 2-5 contracts max ($300-1,000 max risk) | Risk level: High | Skill level: Advanced
⚠️ Risk Factors
Don't ignore these potential headwinds:
-
🏛️ FOMC tomorrow is THE risk event: While 97% odds favor a hold, Powell's press conference language matters. Any hawkish surprise about delaying future cuts would hit rate-sensitive small caps hardest. Small caps carry more floating-rate debt and are more directly impacted by rate expectations than large caps.
-
📊 January rotation may already be exhausted: The 15-day outperformance streak snapped on January 23 with IWM falling nearly 2%. Some analysts question whether this is sustainable or just a seasonal "January Effect." JPMorgan cautioned that the Russell 2000 may face limited upside in H1 2026.
-
💸 Earnings expectations may be too optimistic: Goldman Sachs explicitly warned that the 61% consensus EPS growth estimate for the Russell 2000 is "far too optimistic." Early Q4 results show only 55.6% of companies beating expectations - below historical averages.
-
📉 Labor market weakness disproportionately hits small caps: Only 50,000 jobs added in December and Philadelphia Fed data shows smaller firms shrinking while larger firms add workers. The hiring rate at 3.2% is near Great Recession levels.
-
🏭 No manufacturing recovery: BofA's Jill Carey Hall flagged that the Russell 2000 is currently pricing in better ISM manufacturing data than actually exists - a potential source of disappointment.
-
🌐 Tariff second-order effects: While small caps derive only ~21% of revenue internationally (a relative advantage), slower GDP growth and reduced consumer spending from trade policy could still weigh on earnings.
-
🏛️ Fed political uncertainty: Chair Powell addressed threats of criminal charges on January 11, raising questions about whether monetary policy will remain evidence-based. This adds a wildcard to rate expectations.
-
💰 Refinancing wall 2026-2028: Small-cap companies with significant debt maturities face refinancing at rates well above pandemic-era near-zero. The quality divide between profitable small caps and leveraged "zombie" companies is expected to widen through 2026.
🎯 The Bottom Line
Here's the deal: A major player just put on a $13.1M bull put spread on IWM, collecting $1.9M in credit by betting the Russell 2000 stays above $265 through February 5th. This is a short-term income play, not a long-term directional bet. They're essentially saying: "I'll take 1.9 million dollars if small caps don't collapse in the next 7 trading days."
What this trade tells us:
- 🎯 Sophisticated player is confident IWM holds current levels through the FOMC meeting and GDP release this week
- 💰 They're comfortable risking $2.4M to make $1.9M - that's good risk/reward for a high-conviction short-duration trade
- ⚖️ The BELOW BID execution on the short leg shows urgency - they wanted this position NOW before FOMC
- 📊 The $265/$263 strikes align perfectly with gamma levels - $264 is the strongest gamma zone on the board (583.2), acting as a price magnet
If you own IWM or small caps:
- ✅ This is a supportive signal - institutional money is comfortable holding through near-term macro events
- 📊 Keep an eye on $260 as your key support level (massive gamma floor at 217.3)
- 🎯 If IWM breaks above $265 after FOMC, the rotation thesis could have legs toward $270-272
- 🛡️ Consider tightening stops below $260 if macro data disappoints
If you're watching from the sidelines:
- ⏰ Tomorrow (January 28) at 2:00-2:30 PM is the key moment - FOMC decision + Powell presser
- 🎯 A dovish hold could re-ignite the rotation trade and push IWM toward $270
- 📉 A hawkish surprise could send IWM toward $260 support - that could be a buying opportunity
- 📊 The 25-year valuation gap, $440B in M&A dry powder, and projected 19-35% earnings growth make the structural case for small caps compelling
If you're bearish:
- ⚠️ Fighting the rotation trade into a dovish Fed cycle is risky
- 📊 Wait for a break below $260 gamma support before getting aggressive on the short side
- 🎯 Goldman's warning about 61% consensus growth being too optimistic is the best bear thesis - watch Q4 earnings closely
Mark your calendar - Key dates:
- 📅 January 28 (Tomorrow) - FOMC Rate Decision + Powell Press Conference
- 📅 January 29 (Thursday) - Q4 GDP First Estimate + PCE Deflator
- 📅 February 5 - This put spread expires
- 📅 February 6 - January Employment Report
- 📅 February-March - Bulk of Russell 2000 Q4 earnings season
- 📅 March 17-18 - Next FOMC Meeting with Dot Plot
The big picture: The Great Rotation into small caps has real structural backing - a historic valuation discount, rate cuts helping leveraged small businesses, and massive institutional underweight creating buying pressure. This $13.1M trade suggests smart money believes the pullback from $271 is a pause, not a reversal. But the next 48 hours with FOMC and GDP will be the real test.
Stay nimble, manage your risk, and let the macro data guide your next move. 💪
Disclaimer: Options trading involves substantial risk of loss and is not suitable for all investors. This analysis is for educational purposes only and not financial advice. Past performance doesn't guarantee future results. A bull put spread has defined but real risk - max loss occurs if the underlying drops below the lower strike at expiration. The institutional trade discussed may have portfolio context (hedging, multi-leg positions) not applicable to retail traders. Always do your own research and consider consulting a licensed financial advisor before trading.
About iShares Russell 2000 ETF (IWM): The iShares Russell 2000 ETF tracks the investment results of the Russell 2000 Index, composed of approximately 2,000 small-capitalization U.S. equities. With $78.4B in AUM and 1,958 holdings across all sectors (led by Financials at 22.3% and Healthcare at 13.8%), it is the most widely traded small-cap ETF in the world. Managed by BlackRock (iShares) with a 0.19% expense ratio.