🛡️ IWM $13.4M Put Roll - Institutional Player Covering Short Puts During Small-Cap Surge!
📅 January 28, 2026 | 🔥 Unusual Activity Detected
🎯 The Quick Take
Someone just spent $13.4 MILLION buying back (closing) two blocks of IWM puts this morning at 09:43:59 -- a total of 100,000 contracts across the $253 and $251 strikes expiring February 20th. This is a Buy to Close (BTC) order, meaning the trader was previously SHORT these puts and is now covering that position as part of a roll. With IWM up +7.2% YTD and riding the strongest small-cap rotation since 2008, this institutional player is locking in gains on their short put position and likely repositioning for the next leg. Translation: Smart money is taking profits on a winning bet and resetting the trade!
📊 ETF Overview
iShares Russell 2000 ETF (IWM) tracks the Russell 2000 Index, the benchmark for U.S. small-cap stocks and a barometer for domestic economic health:
- AUM: $78.4 Billion (largest Russell 2000 ETF)
- Expense Ratio: 0.19%
- Current Price: $265.57 (near 52-week high of $271.60)
- Primary Exposure: ~2,000 small-cap U.S. companies across financials, healthcare, industrials, and technology
- Beta: 1.25 (moves roughly 25% more than the S&P 500 in either direction)
💰 The Option Flow Breakdown
The Tape (January 28, 2026 @ 09:43:59):
| Time | Symbol | Side | Buy/Sell | Type | Expiration | Premium | Strike | Volume | OI | Size | Spot | Option Price |
|---|---|---|---|---|---|---|---|---|---|---|---|---|
| 09:43:59 | IWM | ASK | BUY | PUT $253 | 2026-02-20 | $7.4M | $253 | 58K | 45K | 50,000 | $265.57 | $1.47 |
| 09:43:59 | IWM | ASK | BUY | PUT $251 | 2026-02-20 | $6M | $251 | 60K | 95K | 50,000 | $265.57 | $1.20 |
Total Premium: $13.4M across 100,000 contracts
🤓 What This Actually Means
This is a position roll -- the trader is closing an existing short put position and likely opening a new one at different strikes or expirations. Here's the breakdown:
- 💸 Covering short puts: Paid $13.4M ($1.47 and $1.20 per contract) to buy back puts they previously sold at HIGHER prices -- pocketing the difference as profit
- 🛡️ Strike context: Both $253 and $251 sit ~4.7-5.5% below current price -- these puts were sold as bullish bets that IWM would stay above these levels
- ⏰ February 20th expiration: 23 days out -- the monthly OPEX. The trader is closing early rather than waiting for expiration
- 📊 Size matters: 100,000 contracts represents 10 million shares worth ~$2.65 BILLION in notional exposure
- 🏦 Roll mechanics: By closing now while the puts are cheap ($1.20-$1.47 vs likely $3-5+ when originally sold), the trader banks profit and frees up margin to sell new puts at strikes and expirations that reflect current conditions
What's really happening here: This trader likely sold these puts weeks ago when IWM was lower or volatility was higher, collecting fat premiums. Now that IWM has rallied +7.2% YTD and these puts are far out-of-the-money with only 23 days left, the puts have decayed significantly. The trader is buying them back cheap, banking the profit, and almost certainly re-establishing a new short put position at updated strikes or a later expiration. Think of it like a landlord whose lease is expiring -- they're not leaving the building, just signing a new lease at better terms.
Volume vs Open Interest: The volume of 58K and 60K exceeded open interest of 45K and 95K respectively. The Vol/OI ratio of 1.29x on the $253 strike confirms high activity relative to existing positions -- a hallmark of institutional repositioning.
📈 Technical Setup / Chart Check-Up
YTD Performance Chart
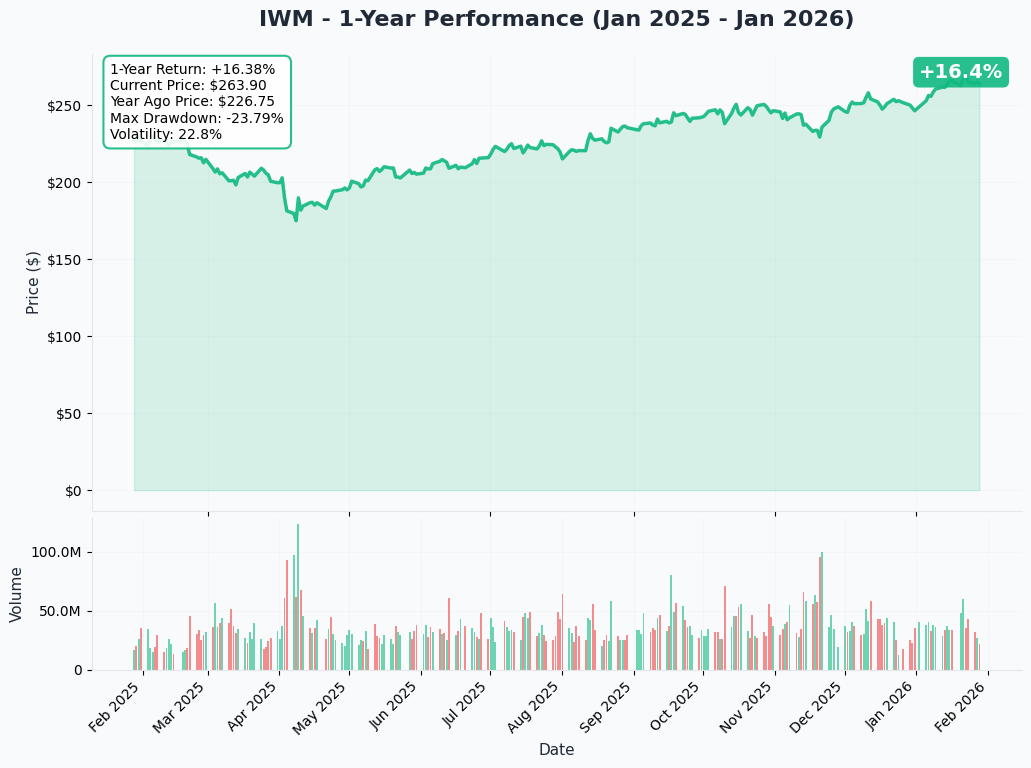
IWM is having a standout start to 2026 -- up +7.2% YTD and leading the so-called "Great Rotation" out of mega-cap tech and into small-cap domestic stocks. The Russell 2000 outperformed the S&P 500 for 13 consecutive trading sessions through January 21 -- a streak not seen since 2008.
Key observations:
- 🚀 Historic rotation: Small caps crushing large caps -- IWM +7.2% vs SPY +1.8% YTD
- 📈 Near all-time highs: Trading at $265.57 vs 52-week high of $271.60 (just 2.3% below)
- 🎢 Massive recovery: Rallied +42.4% from the April 2025 low of $171.73
- 📊 Breadth improving: The rotation into small caps signals healthy market broadening
- ⚠️ Extended run: After 13 straight sessions of outperformance, near-term consolidation risk is elevated
Gamma-Based Support & Resistance Analysis
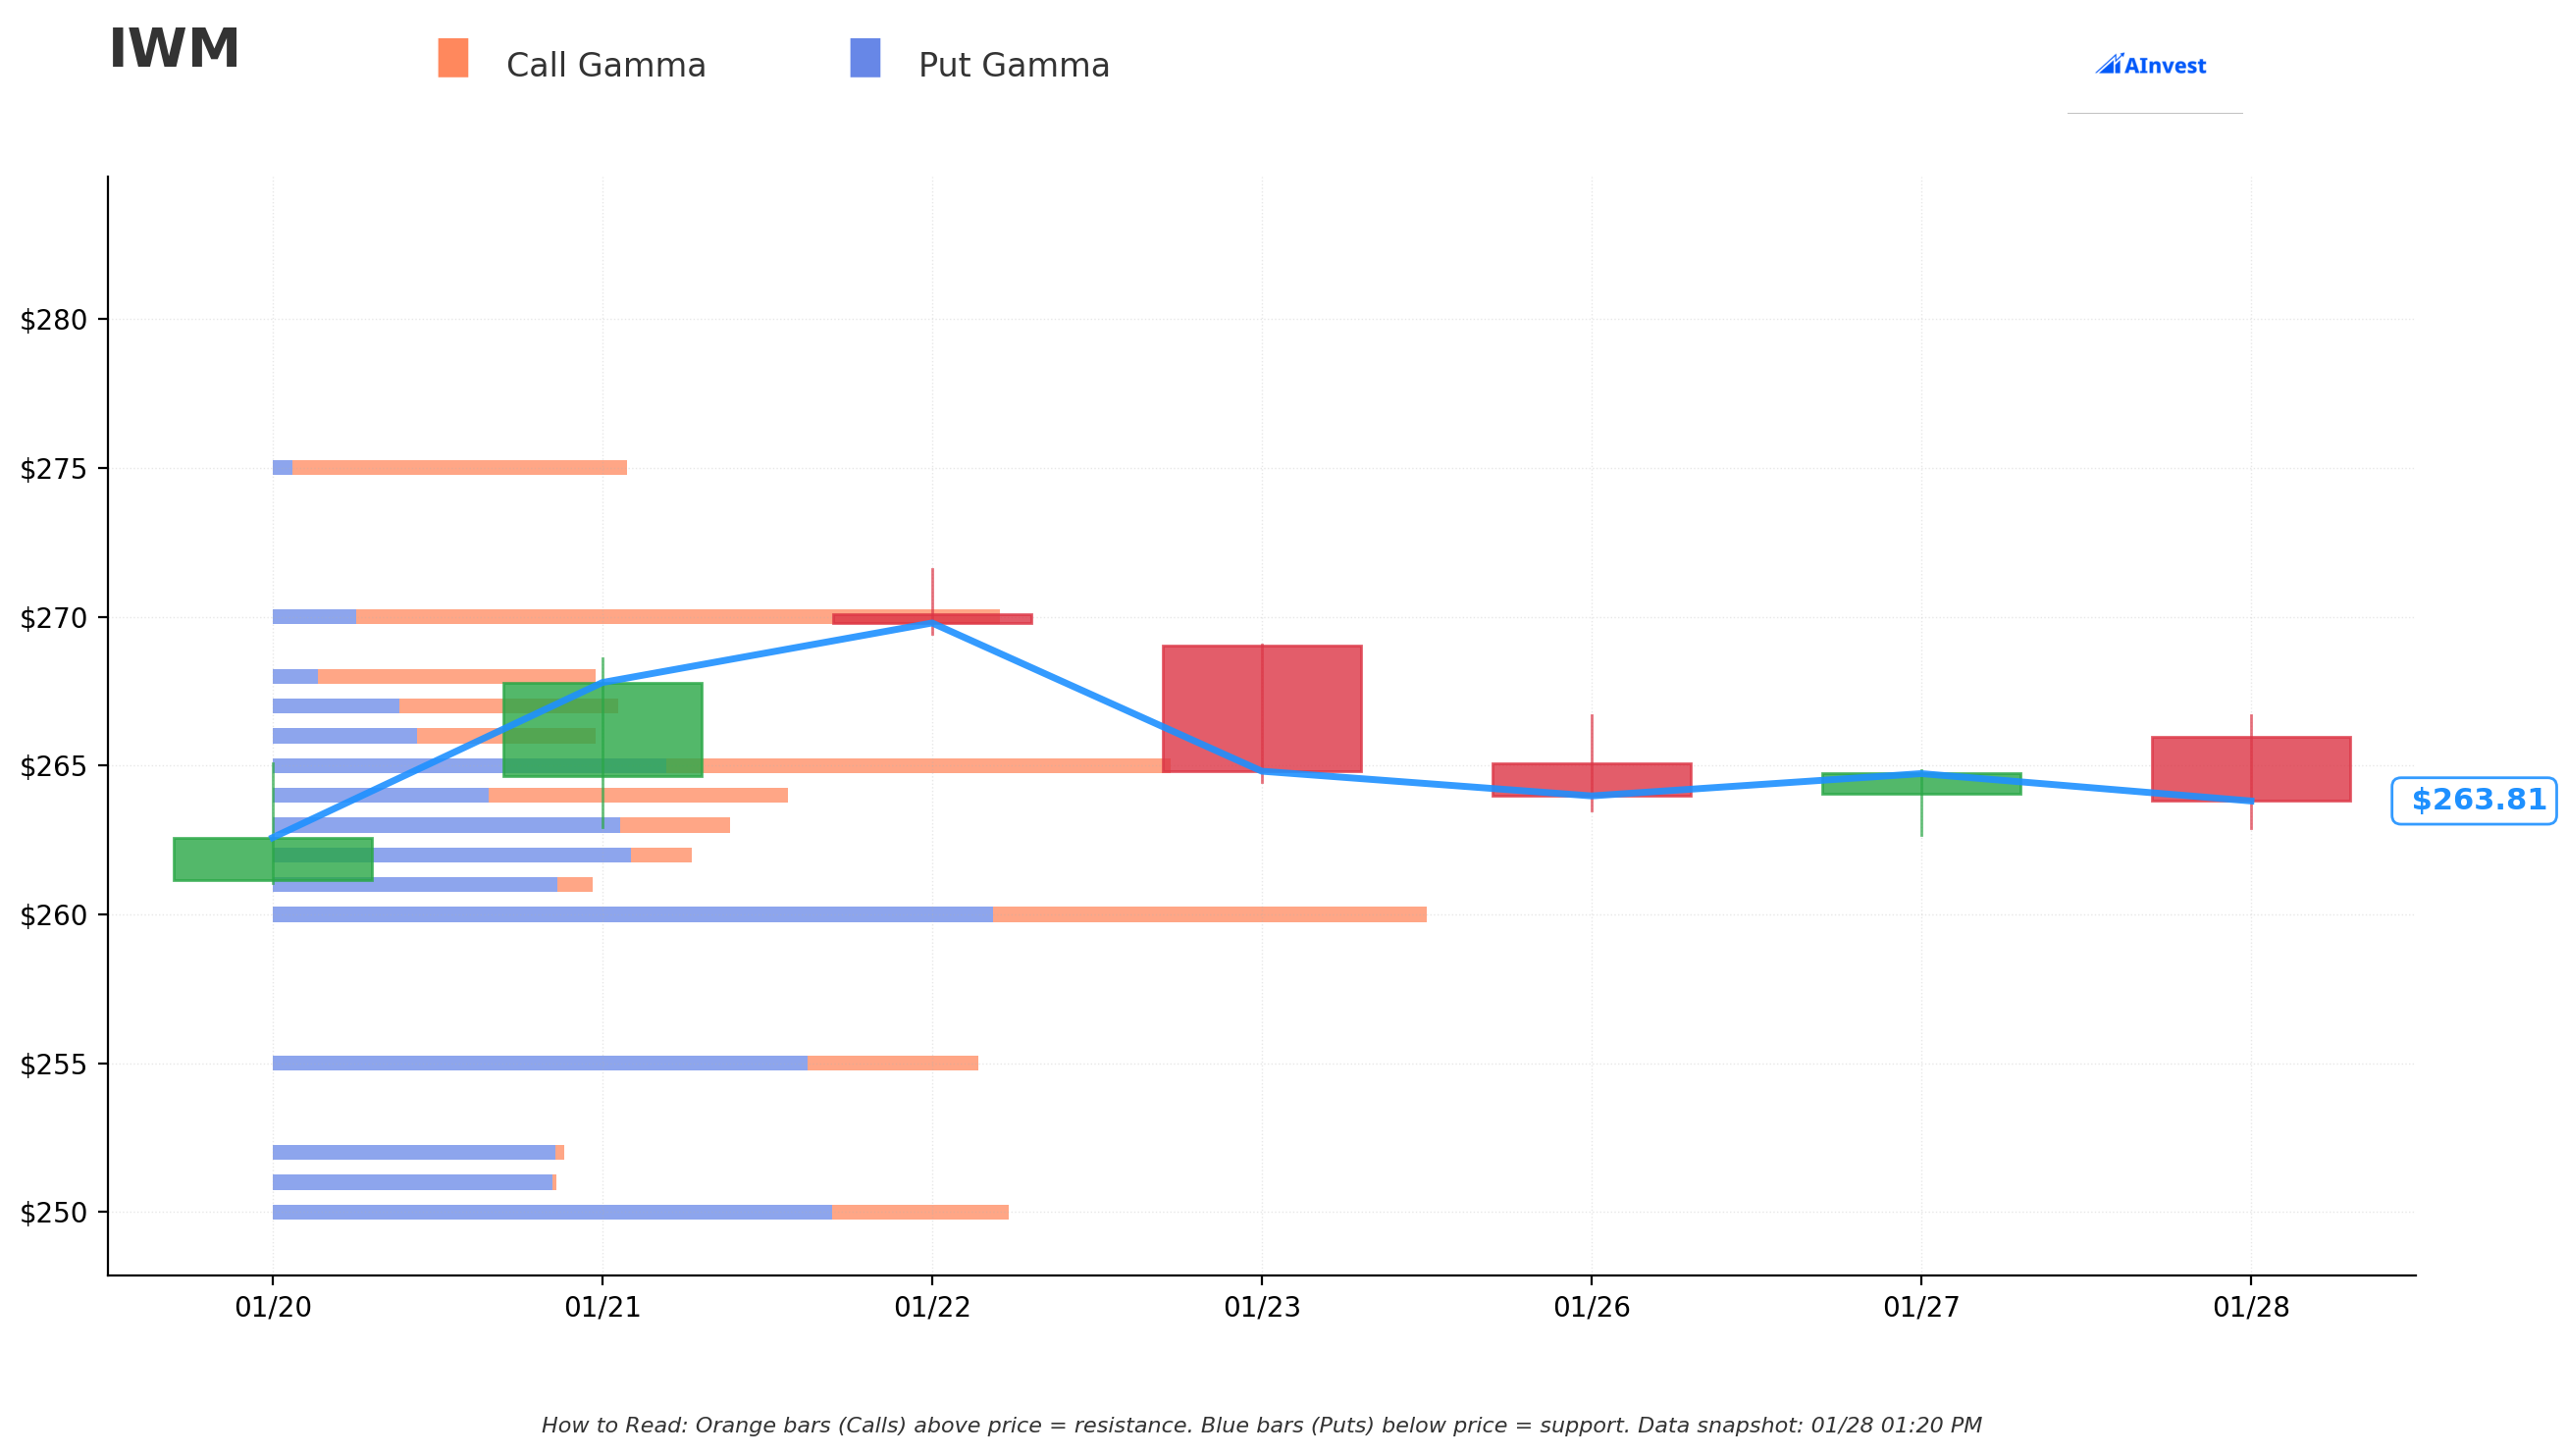
Current Price: $263.74
The gamma exposure map reveals critical price magnets and barriers that will govern near-term price action:
🔵 Support Levels (Put Gamma Below Price):
- $263 - Immediate support with 89.2B total gamma exposure (strongest nearby floor!)
- $262 - Secondary support at 81.8B gamma (dealers will buy dips here)
- $260 - Major structural floor with 224.1B gamma (HIGHEST TOTAL GAMMA -- this is the LINE IN THE SAND)
- $255 - Strong support at 137.1B gamma (3.3% below current price)
- $250 - Deep support at 142.8B gamma (5.2% below -- major psychological level)
- $245 - Extended support zone with 79.9B gamma (7.1% below)
- $240 - Disaster floor at 78.4B gamma (9% below)
🟠 Resistance Levels (Call Gamma Above Price):
- $264 - Immediate ceiling with 97.5B gamma (just above current price!)
- $265 - Secondary resistance at 171.7B gamma (STRONG level -- heavy call positioning)
- $270 - Major ceiling zone with 138.9B gamma (2.4% above -- highest call gamma concentration)
What this means for traders: IWM is squeezed between massive $260 support (224.1B -- the single largest gamma level) and strong $265 resistance (171.7B). The net gamma exposure skews bearish (1,541B put gamma vs 1,001B call gamma), meaning there's MORE downside hedging activity than upside speculation. This creates a "tug of war" zone between $260-$270.
Notice anything? The put buyer's strikes of $253 and $251 sit right between the $255 and $250 gamma support levels. These were strategically chosen -- if IWM were to break below $260, the next stops at $255 and $250 would be where heavy gamma acts as a cushion. The trader's short puts were positioned just above those floors, collecting premium while relying on gamma support to hold.
Net GEX Bias: Bearish (1,541B put gamma vs 1,001B call gamma) -- Put-heavy positioning reflects institutional hedging, but the massive $260 floor provides a strong foundation.
Implied Move Analysis
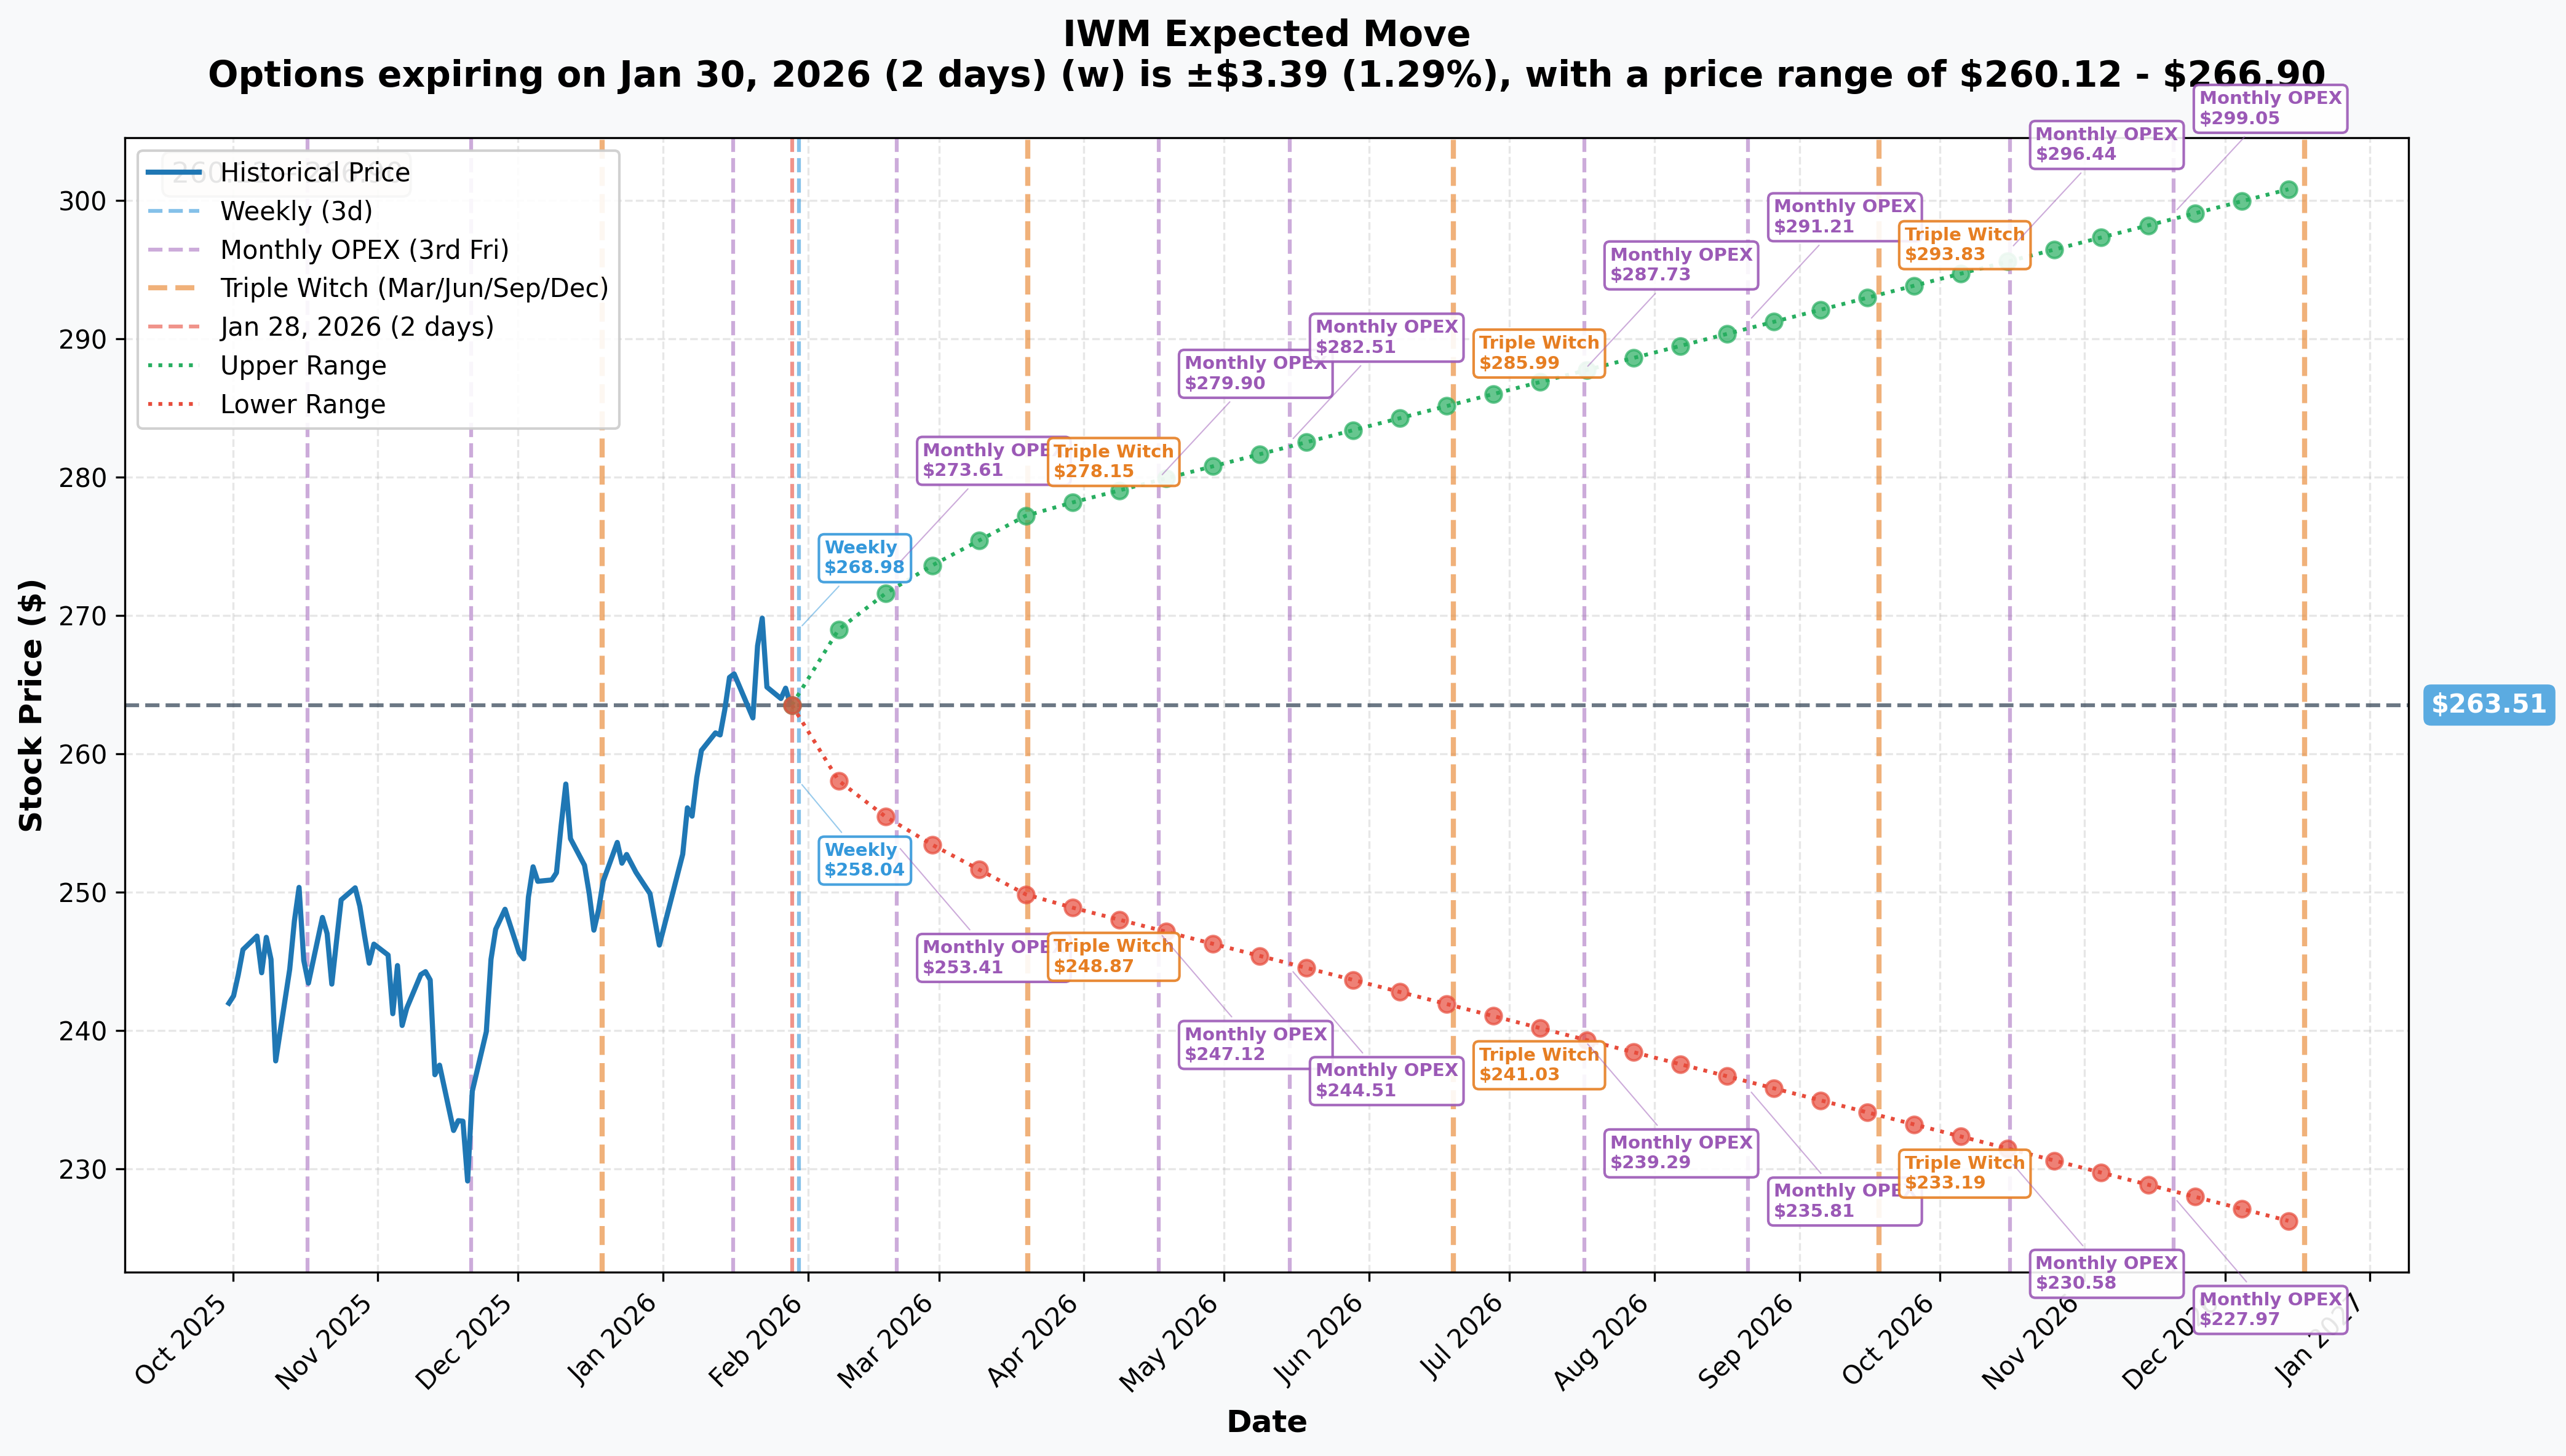
Options market pricing for upcoming expirations:
- 📅 Weekly (Jan 30 - 2 days): ±$3.39 (±1.29%) --> Range: $260.12 - $266.90
- 📅 Monthly OPEX (Feb 20 - 23 days - THIS TRADE!): ±$8.84 (±3.35%) --> Range: $254.67 - $272.35
- 📅 Quarterly Triple Witch (Mar 20 - 51 days): ±$13.86 (±5.26%) --> Range: $249.65 - $277.37
- 📅 Yearly LEAPS (Dec 18 - 324 days): ±$37.63 (±14.28%) --> Range: $225.88 - $301.14
Translation for regular folks: The options market is pricing in a 1.3% move ($3.39) by Friday for the weekly expiration, but a 3.4% move ($8.84) through February OPEX on the 20th -- which is exactly when this $13.4M trade expires. That means IWM could reasonably trade anywhere from $254.67 to $272.35 over the next 23 days.
The February 20th lower range of $254.67 lines up almost perfectly with the $253 put strike in this trade -- the market thinks there's a real but modest chance IWM dips to that level. Meanwhile, the upper range of $272.35 suggests the rally could push to new all-time highs above $271.60.
Key insight: IWM implied volatility is relatively modest compared to individual stocks -- a 3.35% expected move over 23 days is typical for a broad ETF. This means the short put seller was collecting "normal" premiums, not crisis-level payouts. The roll makes sense: capture the gains now and redeploy at fresh levels.
🎪 Catalysts
🔥 Immediate Catalysts (Next 7 Days)
FOMC Decision -- January 28-29, 2026 (TODAY!) 📊
The Fed wraps up its two-day meeting today with a rate decision expected at 2:00 PM ET. Markets are pricing in virtually zero chance of a change, keeping rates at 3.50-3.75%. The key event is Powell's press conference -- any hints about the pace of future cuts will move markets.
- 📊 Current rate: 3.50-3.75% after three consecutive 25bp cuts in late 2025
- 🎯 Why it matters for IWM: Nearly 50% of Russell 2000 debt is floating-rate -- lower rates directly boost small-cap earnings
- 📈 Market pricing: 45% odds of a cut in June 2026, with 2 total cuts expected in 2026
- ⚠️ Risk: A hawkish surprise (signaling no more cuts) would hit IWM harder than SPY given rate sensitivity
Q4 2025 GDP Advance Estimate -- January 29, 2026 (TOMORROW!) 📊
The Bureau of Economic Analysis releases the first look at Q4 GDP. The Atlanta Fed GDPNow model estimates 5.4% growth -- well above consensus. Strong GDP is bullish for domestically-focused small caps.
🚀 Near-Term Catalysts (February - March 2026)
January Jobs Report + Annual Benchmark Revisions -- February 6, 2026 📊
This is a BIG one. The Bureau of Labor Statistics will release January payrolls alongside annual benchmark revisions that could reshape the entire labor market narrative. December payrolls came in at just 50K (below 60K forecast), and full-year 2025 averaged only 49K/month vs 168K in 2024.
- 🔑 Benchmark revisions could reveal the labor market was STRONGER or WEAKER than reported throughout 2025
- 📉 A sharp downward revision would fuel rate cut expectations (bullish for IWM)
- 📈 An upward revision would reduce urgency for cuts (bearish near-term)
January CPI Report -- February 11, 2026 📊
The first clean inflation read after government shutdown data disruptions. December CPI held at 2.7% headline and 2.6% core. If inflation continues moderating toward 2%, it opens the door for Fed cuts -- a strong IWM catalyst. But food prices surged 0.7% MoM in December (fastest since August 2022), signaling stickiness.
The "Great Rotation" Momentum 🔄
The historic 13-session outperformance streak reflects a structural shift:
- 🏭 Small-cap earnings growth projected at 17-22% for 2026 -- significantly outpacing large caps
- 💰 Russell 2000 trades at a ~30% valuation discount to the S&P 500 (Goldman Sachs)
- 🏛️ One Big Beautiful Bill Act restored 100% bonus depreciation -- disproportionately benefits capital-intensive small caps
- 📊 Tom Lee (Fundstrat) calls 2026 a year for "fertile alpha generation" in small caps
📊 Longer-Term Catalysts (Q2-Q3 2026)
Fed Rate Cuts Expected Mid-Year
Bank of America projects two cuts in June and July 2026, bringing the rate to 3.00-3.25%. Morgan Stanley projects cuts in June and September. Either scenario is meaningfully bullish for IWM's floating-rate-heavy constituents.
Russell Index Reconstitution Goes Semi-Annual
2026 marks the first year of semi-annual reconstitution for Russell indices -- a historic structural change affecting ~$8.5 trillion in benchmarked assets:
- June reconstitution: Traditional annual event continues as normal
- December reconstitution: NEW mid-year addition starting in 2026
- This could reduce single-event trading volatility while improving index composition throughout the year
Fed Chair Succession
Trump is expected to name his pick for Powell's successor in the coming weeks. A dovish appointment would be bullish for rate-sensitive small caps; a hawkish or politically controversial pick could create uncertainty.
⚠️ Risk Catalysts (Negative)
Sticky Inflation Above 2.5%
Headline CPI at 2.7% and food prices accelerating at the fastest monthly pace since August 2022 could delay or derail the Fed's easing cycle. If inflation re-accelerates due to tariffs or fiscal stimulus, IWM would take a disproportionate hit.
Refinancing Wall (2026-2027)
Approximately 40% of Russell 2000 companies remain unprofitable. These "zombie" companies face a refinancing wall where pandemic-era debt must be rolled over at significantly higher rates -- even 3.50-3.75% is far above the near-zero rates when the debt was issued.
Tariff Escalation
The average U.S. tariff rate has risen from ~2.5% to ~16.5%. While Russell 2000 companies derive 77% of revenue domestically (a relative advantage), tariffs create second-order effects through supply chain costs and reduced business confidence.
🎲 Price Targets & Probabilities
Using gamma levels, implied move data, and upcoming catalysts, here are the scenarios through the February 20th expiration:
📈 Bull Case (30% probability)
Target: $270-$278
How we get there:
- 💪 FOMC press conference signals dovish tilt -- Powell hints at June cut being "highly likely"
- 📊 Q4 GDP comes in at 5%+ tomorrow, confirming economic strength (small caps benefit from domestic growth)
- 🔄 Great Rotation accelerates -- more institutional money flows from mega-cap tech into small caps
- 📈 Breakout above $265 gamma resistance triggers technical rally through $270 to new all-time highs above $271.60
- 💰 January CPI on February 11 shows continued moderation toward 2.5% -- rate cut expectations firm up
- 🏭 Q4 earnings season shows small-cap earnings growth accelerating toward the projected 17-22% for 2026
- 📊 Implied move upper range: $272.35 for February OPEX, $277.37 for March triple witch
Key metrics needed:
- Inflation continuing to moderate (CPI below 2.6%)
- Strong GDP and earnings confirmation
- Dovish Fed communication
- Continued rotation into small caps
Probability assessment: 30% because the rotation has strong structural support (valuations, earnings growth, rate sensitivity), but 13 sessions of outperformance increases the odds of near-term consolidation. Gamma resistance at $265-$270 creates headwinds that require sustained buying to overcome.
🎯 Base Case (45% probability)
Target: $258-$268 range (CONSOLIDATION)
Most likely scenario:
- ✅ Fed holds as expected, Powell delivers balanced message (neither hawkish nor dovish surprise)
- 📊 GDP comes in strong but roughly in-line with elevated expectations
- 🔄 Rotation continues but at a slower pace after 13-session streak
- ⚖️ January jobs report and CPI create temporary volatility but no major trend change
- 📊 IWM consolidates between $260 gamma support and $265-270 resistance
- 💤 Implied volatility stays modest -- options premiums don't expand significantly
- 🔄 Traders digest the YTD rally and wait for clearer signals from mid-year FOMC decisions
This is the put roller's expected scenario: IWM stays well above the $251-$253 strikes, the puts they closed were deep out-of-the-money, and they've banked the premium decay. They'll re-establish short puts at new levels reflecting current conditions.
Why 45% probability: After a 7.2% YTD surge and 13-session outperformance streak, some consolidation is the most natural outcome. Fundamentals remain supportive but the easy money has been made in the near term. The $260 gamma floor (224.1B -- the biggest level) should hold, while $265-$270 caps the upside for now.
📉 Bear Case (25% probability)
Target: $248-$258 (TEST GAMMA SUPPORT)
What could go wrong:
- 😰 Powell delivers hawkish surprise -- signals inflation concerns, walks back June cut expectations
- 📊 GDP disappoints (below 4%) suggesting economic slowdown -- small caps most vulnerable to recession
- 🚨 January CPI comes in hot (above 2.8%) -- re-ignites inflation fears and kills rate cut hopes
- 📉 Jobs report benchmark revisions reveal sharply weaker labor market -- recession fears spike
- 🇨🇳 Tariff escalation -- new trade actions create supply chain disruption and hit business confidence
- 💸 Rotation reverses -- money flows BACK into mega-cap safety as volatility spikes
- 🔨 Break below $260 gamma support triggers cascade to $255, then $250
Critical support levels:
- 🛡️ $260: MAJOR gamma floor (224.1B total -- largest single level) - MUST HOLD or momentum shifts bearish
- 🛡️ $255: Secondary support (137.1B gamma) -- first stop if $260 breaks
- 🛡️ $250: Deep support (142.8B gamma) -- psychological round number with strong gamma backing
- 🛡️ $245-$240: Extended floors with 78-80B gamma each -- disaster scenario territory
Probability assessment: 25% because it requires multiple negative catalysts (hawkish Fed + hot inflation + rotation reversal) to align. The structural case for small caps (valuation discount, earnings growth, rate sensitivity) provides a solid floor. However, the 40% unprofitable constituent base and refinancing wall create real vulnerability if macro conditions deteriorate.
Implied move support: February OPEX lower range of $254.67 and March triple witch lower range of $249.65 align with the $255 and $250 gamma support levels -- the market is pricing these as realistic downside scenarios.
💡 Trading Ideas
🛡️ Conservative: Ride the Rotation with a Put-Write Strategy
Play: Sell cash-secured puts at gamma support levels, mirroring the institutional approach
Structure: Sell Feb 20 $255 puts (23 days to expiration)
Why this works:
- 🎯 This is EXACTLY what the institutional player was doing! They sold puts at $251-$253 and profited as IWM stayed above those levels. You're copying the playbook
- 📊 $255 strike is 3.3% below current price AND sits at 137.1B gamma support -- dealers will buy dips here
- 💰 Collect premium while setting your "buy price" at a 3.3% discount to current levels
- ⏰ Only 23 days to expiration means fast time decay working in your favor
- 🛡️ If assigned, you own IWM at $255 minus premium -- historically attractive entry point
- 📈 The 17-22% projected earnings growth for small caps in 2026 provides fundamental support
Estimated P&L:
- 💰 Premium received: ~$1.50-$2.00 per contract ($150-$200 per put sold)
- 📈 Max profit: Keep full premium if IWM stays above $255 on February 20 (most likely scenario)
- 📉 Max risk: Assignment at $255 minus premium (buying IWM at ~$253) -- not bad if you want to own it!
- 🎯 Breakeven: ~$253 (well within gamma support zone)
- 📊 Probability of profit: ~75-80% based on implied move data
Position sizing: Risk only what you'd be comfortable owning in IWM stock. Each put requires ~$25,500 in cash collateral.
Risk level: Moderate (cash-secured, defined risk) | Skill level: Intermediate
⚖️ Balanced: Bull Put Spread Targeting Gamma Support
Play: Sell a put spread below the gamma support zone, collecting premium with defined risk
Structure: Sell Feb 20 $258 puts, Buy Feb 20 $253 puts ($5 wide spread)
Why this works:
- 📊 Positions the short strike at $258 -- below current price but ABOVE the massive $260 gamma floor (224.1B)
- 🛡️ $253 long put caps downside -- defined risk of $500 per spread max
- 💰 Collect net credit of ~$1.00-$1.50 per spread ($100-$150)
- ⏰ 23 days of time decay -- theta is your friend
- 📈 Both strikes below key gamma support levels where dealers will actively buy dips
- 🤝 Essentially betting that the "Great Rotation" continues and IWM stays above $258
Estimated P&L:
- 💰 Net credit: ~$1.00-$1.50 per spread ($100-$150)
- 📈 Max profit: Keep full credit if IWM above $258 at February expiration
- 📉 Max loss: $350-$400 per spread (width minus credit)
- 🎯 Breakeven: ~$256.50-$257
- 📊 Risk/Reward: ~1:2.5 to 1:3 in your favor (small risk for decent reward)
- 📊 Probability of profit: ~70-75%
Entry timing:
- ⏰ Wait until after FOMC decision this afternoon and GDP print tomorrow for clarity
- 🎯 Enter if IWM holds above $262 through the week
- ❌ Skip if IWM breaks below $260 gamma support (thesis invalidated)
Risk level: Moderate (defined risk, bullish directional) | Skill level: Intermediate
🚀 Aggressive: Call Spread Betting on New All-Time Highs
Play: Buy a call spread targeting a breakout above the $271.60 all-time high
Structure: Buy Feb 20 $267 calls, Sell Feb 20 $275 calls ($8 wide spread)
Why this could work:
- 📈 The Great Rotation is a STRUCTURAL shift, not a one-week trade -- multiple Wall Street firms have raised small-cap targets
- 🎯 Jefferies targets Russell 2000 at 2,825 (14% upside from current levels)
- 💰 Average analyst price target of $314.63 implies 18.4% upside
- 📊 Implied move upper range of $272.35 for February OPEX puts the $267-$275 range squarely in play
- 🚀 A dovish FOMC + strong GDP + cooling inflation could fuel the next leg higher
- 📈 Breakout above $270 gamma resistance (138.9B) could trigger a quick move to $275+
Estimated P&L:
- 💰 Cost: ~$2.50-$3.50 per spread ($250-$350)
- 📈 Max profit: $4.50-$5.50 per spread ($450-$550) if IWM above $275 at expiration
- 📉 Max loss: Premium paid ($250-$350) if IWM below $267 at expiration
- 🎯 Breakeven: ~$269.50-$270.50
- 📊 Risk/Reward: ~1:1.5 (acceptable for directional play)
- 📊 Probability of profit: ~35-40%
CRITICAL WARNING:
- ✅ Only enter after confirming bullish catalysts (dovish Fed + strong GDP)
- ✅ Accept that probability of profit is under 50% -- this is a directional bet, not a high-probability trade
- ⚠️ After 13 sessions of outperformance, mean reversion could kick in
- ⏰ Consider taking profits at 50-60% of max if IWM rallies to $272-$273 early
Risk level: HIGH (directional bet, can lose 100% of premium) | Skill level: Advanced
⚠️ Risk Factors
Don't get caught by these potential landmines:
-
⏰ FOMC decision TODAY creates binary event risk: While a hold is virtually certain, Powell's press conference could shift rate cut expectations for the rest of 2026. IWM is acutely sensitive to Fed policy -- nearly 50% of Russell 2000 debt is floating-rate. Any hawkish language could trigger a 2-3% same-day sell-off. And tomorrow's GDP print adds a second day of macro event risk.
-
📉 13-session outperformance streak screams "mean reversion": The Russell 2000's historic winning streak vs the S&P 500 tied the 2008 record. Extended winning streaks tend to correct -- not necessarily crash, but rotation BACK into large caps could cool IWM's momentum for weeks. Don't chase the rally at the peak of an extended run.
-
💸 40% of Russell 2000 companies are unprofitable: This staggering statistic means nearly half the index doesn't make money. The 2026-2027 refinancing wall forces these "zombie" companies to roll over pandemic-era debt at 3.5%+ rates -- far above the near-zero rates when the debt was issued. A quality divide is emerging between profitable small caps and speculative names that could drag on the index.
-
🇨🇳 Tariff escalation creates hidden exposure: While Russell 2000 companies derive 77% of revenue domestically (a relative advantage), the average U.S. tariff rate has risen from 2.5% to 16.5%. Companies are projecting >3% price increases in 2026. Second-order effects through supply chains and reduced business confidence hit small caps hardest.
-
📊 Inflation stuck at 2.7% threatens the rate cut thesis: December CPI at 2.7% headline with food prices surging 0.7% MoM (fastest since August 2022) shows the last mile to 2% is proving stubborn. If inflation re-accelerates, the Fed could pause its easing cycle entirely -- removing IWM's #1 bullish catalyst. Moody's estimates "true" annual CPI may be closer to 3%.
-
💰 ETF outflows despite rally signal institutional skepticism: IWM has seen -$2.75B in 1-month outflows and -$5.89B in 1-year outflows despite strong price performance. This divergence between rising prices and falling flows often signals that institutional investors are using the rally to reduce exposure -- the bigger players are selling into the strength.
-
🎢 Beta of 1.25 amplifies downside moves: IWM moves roughly 25% MORE than the S&P 500 in either direction. The April 2025 drawdown to $171.73 represented a 21% peak-to-trough decline -- painful but not unusual for this volatile asset class. In a broad market selloff, IWM will fall faster and harder than large-cap indices.
-
🏛️ Fed chair succession wildcard: Trump's impending pick for Powell's successor could reshape monetary policy expectations overnight. A politically-motivated appointment could undermine Fed independence, increase policy uncertainty, and create sharp volatility in rate-sensitive assets like IWM.
-
📊 Net gamma exposure skews bearish: The current gamma profile shows 1,541B in put gamma vs 1,001B in call gamma. This means more institutional money is positioned for DOWNSIDE protection than upside speculation. When the people with the biggest portfolios are buying more insurance than lottery tickets, retail traders should take notice.
🎯 The Bottom Line
Real talk: An institution just spent $13.4 MILLION closing out a short put position on IWM -- 100,000 contracts across the $253 and $251 strikes. This is a profitable ROLL, not a panic trade. They sold these puts at higher prices, collected premium, and are now buying them back cheap after IWM rallied. They'll likely redeploy at new strikes reflecting IWM's current $265 price level.
What this trade tells us:
- 🎯 This is a well-run institutional premium-selling operation -- they're systematically harvesting theta (time decay) on IWM puts
- 💰 The roll signals CONFIDENCE in IWM's near-term floor -- they're not closing because they're scared, they're closing because the trade worked
- ⚖️ The timing (January 28, same day as FOMC) suggests they want to clean up risk before a potential catalyst
- 📊 They're positioned around the $250-$255 gamma support zone -- sophisticated strike selection that aligns with structural floors
- 🔄 Expect to see new short put activity at updated strikes ($255-$260 range) in coming sessions
This is a HEALTHY signal -- institutional premium sellers rolling profitable trades is the sign of a well-functioning market.
If you're bullish on small caps:
- ✅ The Great Rotation thesis remains intact -- 17-22% earnings growth, 30% valuation discount to large caps, and Fed rate sensitivity all support IWM
- 📊 Use the $260 gamma level (224.1B -- the strongest support) as your line in the sand -- hold above there and the upside case stays alive
- 🎯 Jefferies targets Russell 2000 at 2,825 (14% upside), analyst consensus at $314.63 (18.4% upside)
- ⏰ Wait for FOMC + GDP clarity (today and tomorrow) before adding exposure
If you're watching from the sidelines:
- 👀 Don't chase after 13 straight sessions of outperformance -- wait for a pullback to $258-$262 (gamma support zone)
- 📊 February 6th jobs report and February 11th CPI are the next big data points -- enter AFTER these clear
- 🎯 Consider selling puts at $250-$255 strikes (copying the institutional approach) for ~75-80% probability of profit
- 📈 Longer-term (6-12 months), mid-year Fed cuts and accelerating small-cap earnings could drive IWM to $290-$315
If you're bearish:
- 📊 Watch for a break below $260 (224.1B gamma floor) -- that's the trigger for a cascade to $255, then $250
- ⚠️ Hot inflation data (February 11 CPI above 2.8%) would be the clearest bearish catalyst
- 📉 Implied move lower range: $254.67 for February OPEX, $249.65 for March triple witch
- ⏰ The -$5.89B in trailing 12-month outflows suggests institutional selling into the rally -- the dumb money is buying what smart money is selling
Mark your calendar -- Key dates:
- 📅 January 28 (Today) - FOMC rate decision + Powell press conference
- 📅 January 29 (Tomorrow) - Q4 2025 GDP advance estimate
- 📅 January 30 (Friday) - Weekly OPEX (±1.3% implied move closes)
- 📅 February 6 - January jobs report + annual benchmark revisions (HIGH IMPACT)
- 📅 February 11 - January CPI report
- 📅 February 20 - Monthly OPEX -- expiration of this $13.4M put trade
- 📅 March 17-18 - FOMC meeting + Summary of Economic Projections (dot plot)
- 📅 June 16-17 - FOMC meeting (45% odds of first 2026 rate cut)
- 📅 Late June - Russell Annual Reconstitution (first year of semi-annual format)
Final verdict: IWM's small-cap rotation story is real and backed by fundamental tailwinds -- valuation discounts, earnings acceleration, rate sensitivity, and fiscal policy support. BUT, after a 7.2% YTD surge and a historic 13-session outperformance streak, the easy gains are in the rearview mirror. The $13.4M institutional put roll signals that sophisticated players are confident in IWM's floor but actively managing positions around current levels -- not blindly buying more.
Be patient. Let today's FOMC and tomorrow's GDP settle. Look for pullbacks to $258-$262 for entries. The small-cap rotation will still be here next week, and you'll get a better price if you wait for a dip.
The smart money isn't panicking -- they're rolling. Follow their lead. 💪
Disclaimer: Options trading involves substantial risk of loss and is not suitable for all investors. This analysis is for educational purposes only and not financial advice. Past performance doesn't guarantee future results. IWM is an ETF that can lose significant value during market downturns -- the April 2025 drawdown to $171.73 (21% decline) illustrates the risk. The institutional put roll described here is part of a complex trading operation not directly replicable by retail traders. Always do your own research and consider consulting a licensed financial advisor before trading. ETF investments carry market risk, and small-cap stocks are inherently more volatile than large-cap alternatives.
About iShares Russell 2000 ETF: The iShares Russell 2000 ETF tracks the Russell 2000 Index, providing exposure to approximately 2,000 small-cap U.S. companies across sectors including financials, healthcare, industrials, and technology, with assets under management of $78.4 billion and an expense ratio of 0.19%.