🔥 IWM: $13.5M Bear Put Spread CLOSED – Big Money Taking Profits on Small-Cap Hedge!
📅 January 30, 2026 | 🐋 Institutional Position Unwind Detected
🎯 The Quick Take
Someone just closed out a $13.5M bear put spread on IWM, unwinding their downside hedge on the Russell 2000. They sold the $250 put and bought back the $248 put -- both February 20 expiration -- in a coordinated 36,000-contract block at 10:02 AM. With IWM trading at $260.31, both legs were well out-of-the-money, meaning this hedge expired worthless (or nearly so). The trader is cashing out what's left and removing their downside protection. Translation? They're no longer worried about a small-cap crash down to $248-$250 by mid-February. That's a meaningful bullish signal from institutional money.
💰 ETF Overview
iShares Russell 2000 ETF (IWM) is the go-to ETF for trading America's small-cap stocks. It tracks the Russell 2000 Index -- about 2,000 of the smallest publicly traded U.S. companies across every sector. Think regional banks, biotech startups, small industrials, and everything in between.
| Attribute | Detail |
|---|---|
| Issuer | BlackRock (iShares) |
| Benchmark | Russell 2000 Index |
| Total Net Assets | ~$75.6 billion |
| Number of Holdings | 1,958 |
| Expense Ratio | 0.19% |
| 30-Day SEC Yield | ~1.1% |
| Category | U.S. Small-Cap Blend Equity |
Top Sectors: Financials (~22.3%), Industrials (~14.5%), Health Care (~13.8%), Technology (~12.0%), Consumer Discretionary (~10.5%). No single stock exceeds ~1% of assets -- this is about as diversified as it gets.
Why IWM Matters for Options Traders: IWM is by far the most liquid small-cap ETF by trading volume, making it the preferred vehicle for institutional hedging and directional bets on U.S. small-cap stocks. When the big money wants to express a view on small-caps, this is where they do it.
💰 The Option Flow Breakdown
📊 What Just Happened
Here's the full tape from this morning's coordinated block trade:
| Time | Symbol | Side | Buy/Sell | C/P | Expiration | Strike | Volume | Premium | OI | Size | Spot | Option Price | Option Symbol |
|---|---|---|---|---|---|---|---|---|---|---|---|---|---|
| 10:02:06 | IWM | BID | SELL | PUT | 2026-02-20 | $250 | 42,000 | $7.3M | 174,000 | 36,000 | $260.31 | $2.04 | IWM20260220P250 |
| 10:02:06 | IWM | ASK | BUY | PUT | 2026-02-20 | $248 | 41,000 | $6.2M | 46,000 | 36,000 | $260.31 | $1.71 | IWM20260220P248 |
Total Premium: $13.5M combined
🤓 What This Actually Means
Translation for us regular folks: This is a bear put spread close. The trader originally had a bearish hedge on -- long the $250 put, short the $248 put -- which would profit if IWM dropped below $250 by February 20. But with IWM sitting comfortably at $260.31, both puts are way out-of-the-money. The hedge did its job (provided insurance while volatility was elevated), and now they're closing it out.
- Leg 1 (Sell $250P): Selling to Close (STC) -- unwinding their long $250 put protection
- Leg 2 (Buy $248P): Buying to Close (BTC) -- buying back the $248 put they had sold
- Net Credit: Approximately $0.33 per share ($2.04 received - $1.71 paid) on 36,000 contracts
🔍 The Unusualness Factor:
- 36,000 contracts on each leg in a single block -- that's serious institutional size
- Volume vs. OI on $248P: 41,000 volume against 46,000 OI means they're closing nearly ALL of the existing open interest at this strike
- Coordinated execution at the exact same timestamp confirms this is one trader, one decision
💡 Why This Is Bullish: When big money removes downside protection, it signals they're no longer expecting a drop. Either they've shifted their outlook to neutral/bullish, or they believe the risk that originally motivated the hedge has passed. Either way, removing a $13.5M hedge is a confident move.
📈 Technical Setup / Chart Check-Up
YTD Chart Analysis
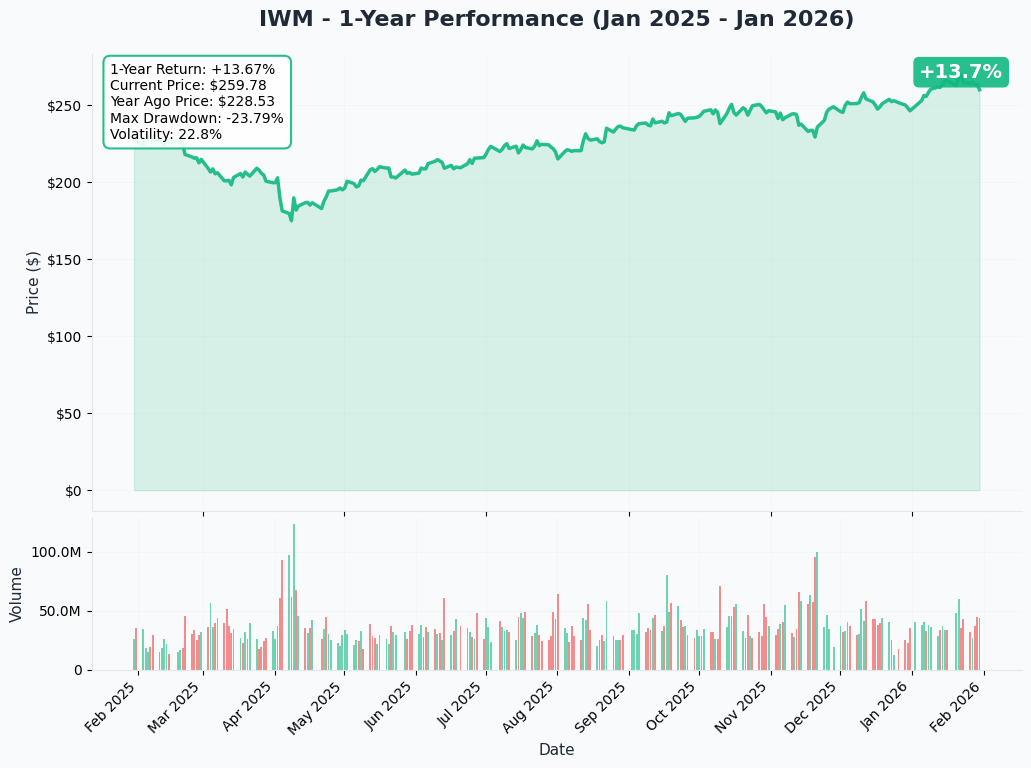
IWM has been on a tear to start 2026. The Russell 2000 posted a 15-day winning streak through January 26 -- the longest since the late 1990s. The index surged 5.8% in the first two weeks of January, its strongest start to a year in over a decade.
Key Stats:
- 📈 Current Price: $260.83
- 🟢 YTD Performance: +7.2%
- 🏔️ 52-Week High: $271.60 (January 22, 2026)
- 📉 52-Week Low: $171.73 (April 7, 2025)
- 💪 Rally from Lows: ~53% since the April 2025 tariff-driven bottom
The Russell 2000 hit an all-time high of 2,735.10 on January 22 before pulling back slightly. We're currently about 3% off those highs -- still in solid shape for the bulls.
🎯 Gamma-Based Support & Resistance Analysis
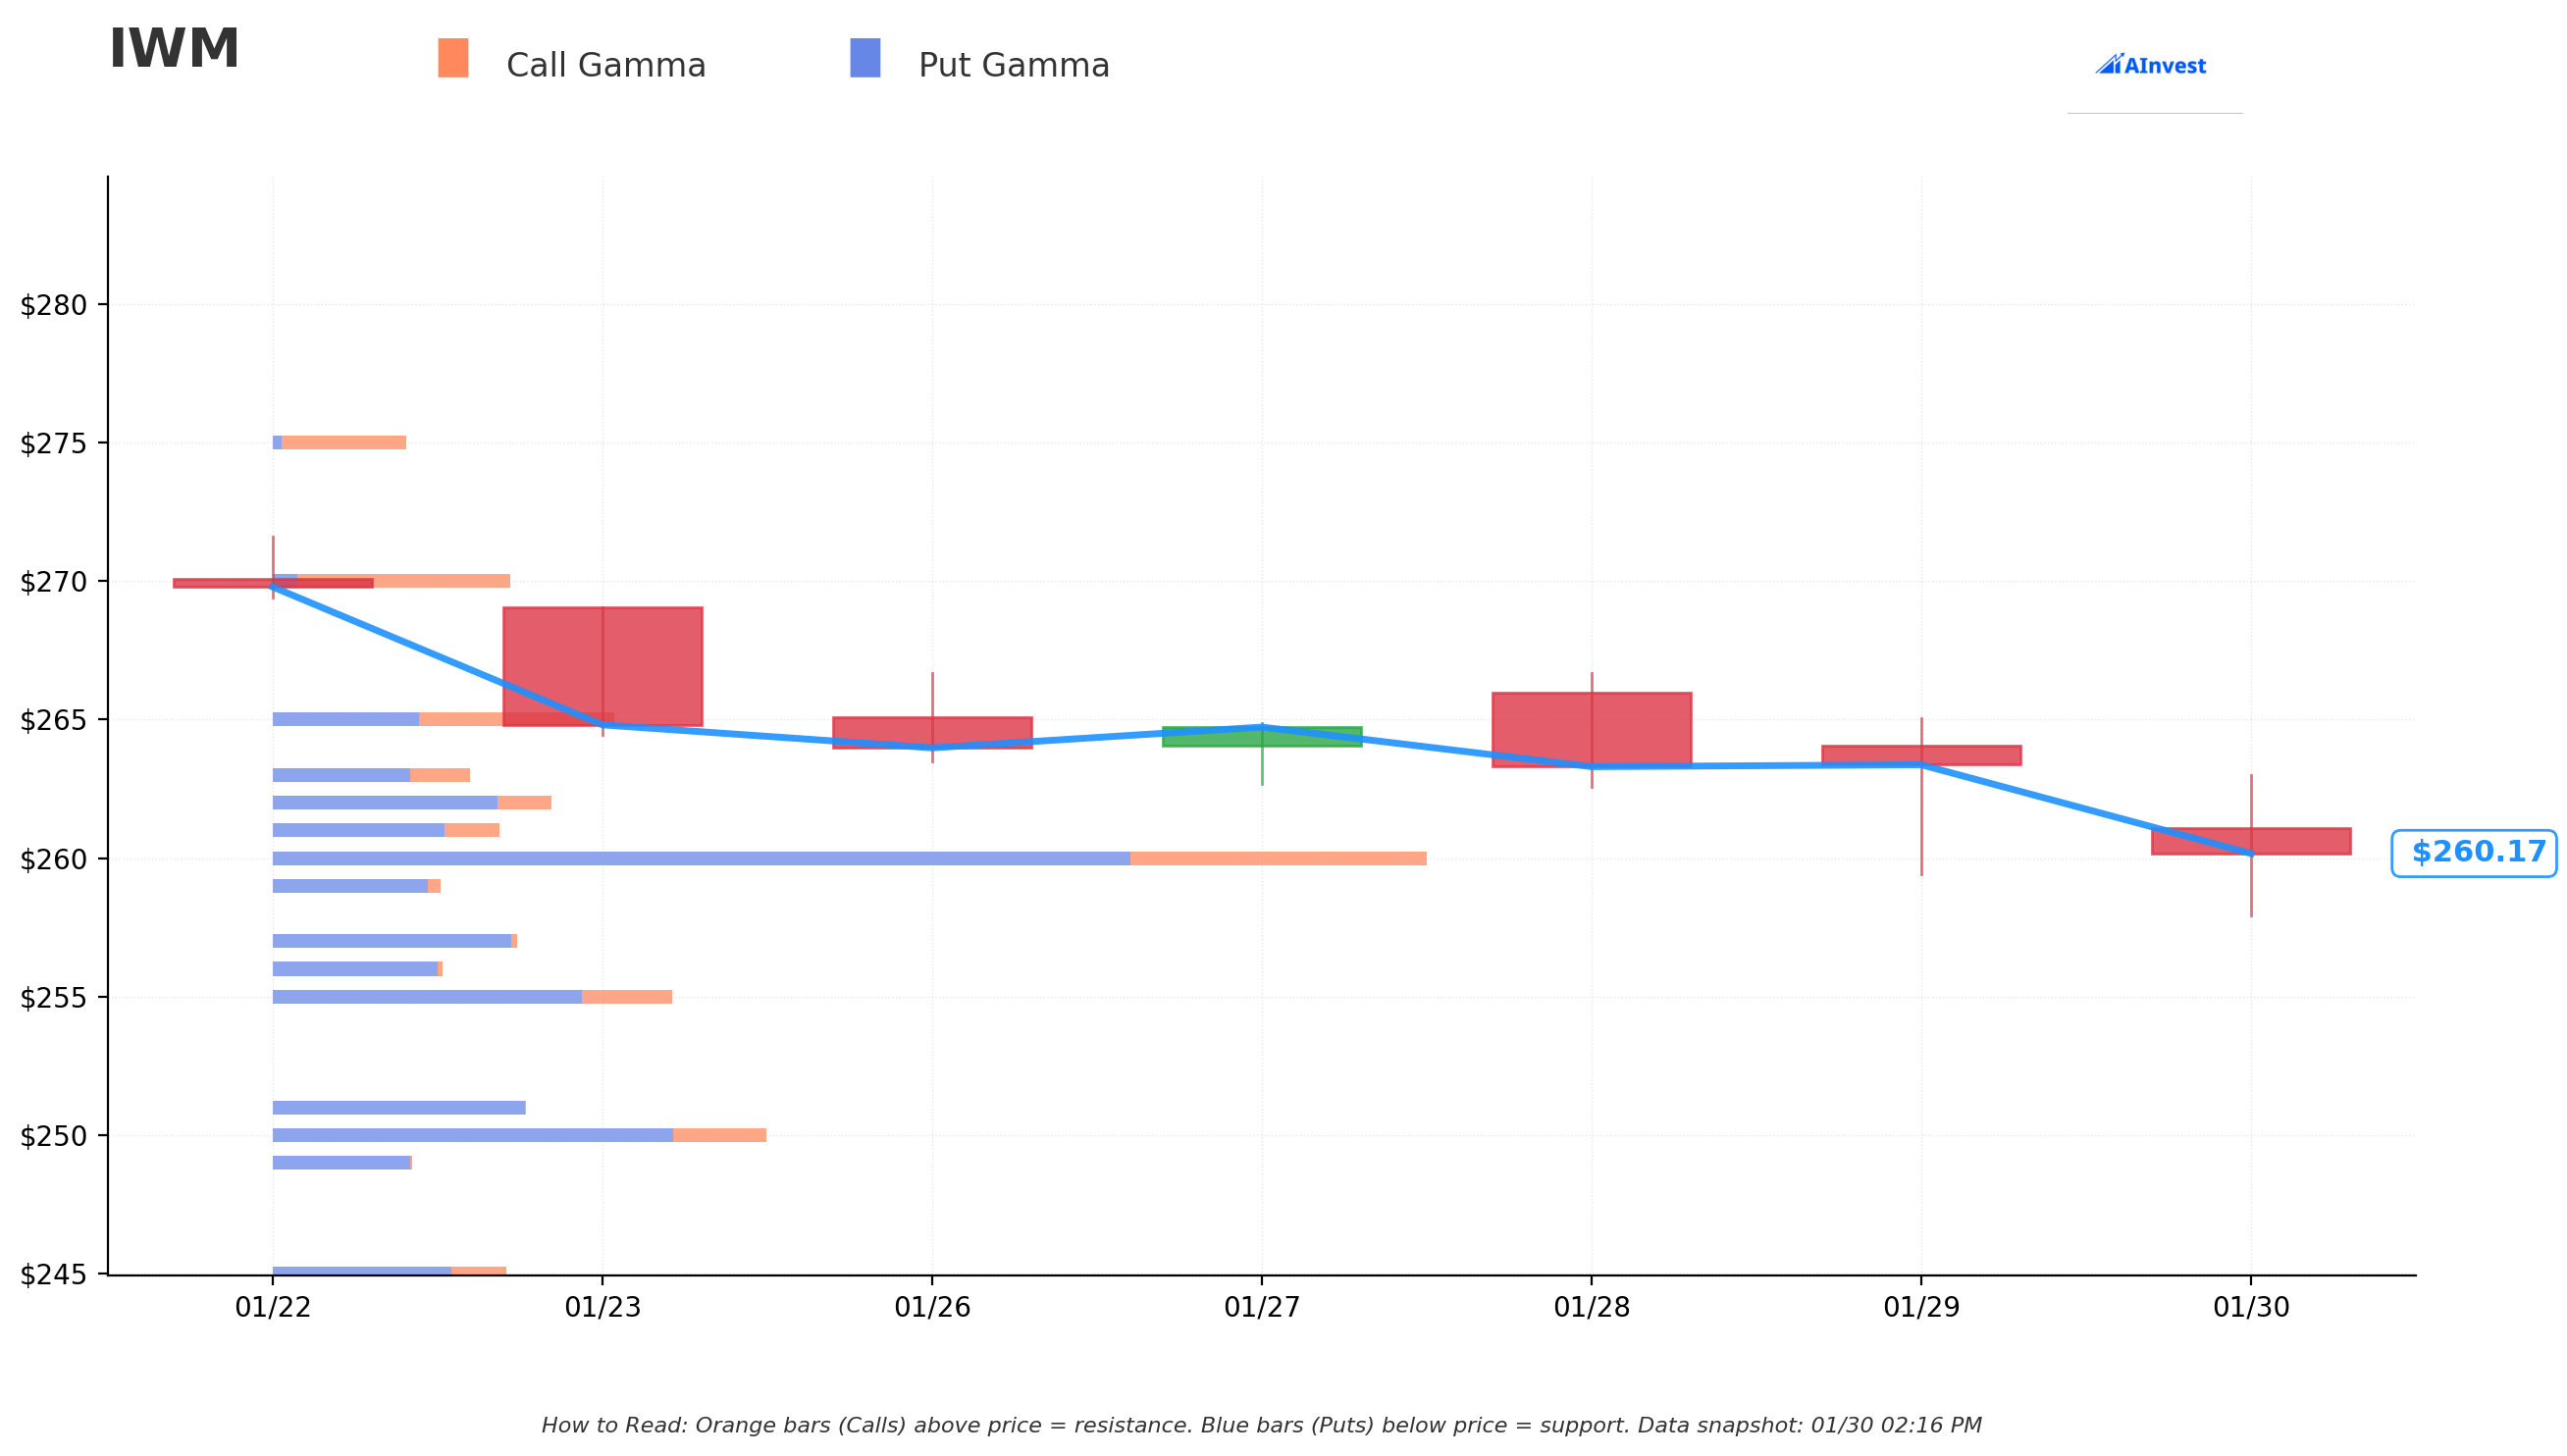
Current Price: $260.83
🔵 Support Levels (Where Buyers Step In):
-
$260 - STRONGEST SUPPORT (gamma: 408) 🛡️
- Literally right below current price (0.3% away)
- This is the floor the market makers are defending
- Expect heavy dealer buying if we dip here
-
$255 - SECONDARY SUPPORT (gamma: 155)
- 2.2% downside cushion
- Meaningful put gamma concentration
-
$251 - MID-RANGE SUPPORT (gamma: 96)
- 3.8% below current levels
- Close to the strike from today's closed put spread
-
$250 - DEEP SUPPORT (gamma: 191)
- 4.1% below -- this is where today's big trader originally hedged to
- Heavy gamma wall + psychological round number
-
$245 - LAST RESORT SUPPORT (gamma: 90)
- 6.1% drop needed to reach here
- Only comes into play in a significant selloff
🟠 Resistance Levels (Where Sellers Show Up):
-
$261 - IMMEDIATE RESISTANCE (gamma: 99)
- Just above current price -- need to clear this first
-
$262 - MODERATE RESISTANCE (gamma: 127)
- 0.4% above current levels
-
$263 - LIGHT RESISTANCE (gamma: 89)
- Once through $262, this shouldn't be hard to clear
-
$265 - STRONGEST RESISTANCE (gamma: 142) 🚧
- 1.6% upside target
- This is the wall the bulls need to punch through
-
$270 - PSYCHOLOGICAL RESISTANCE (gamma: 96)
- 3.5% upside -- close to the January all-time high zone
- Breaking this means new highs are in play
Net GEX Bias: BEARISH -- Dealers are positioned defensively, which means they'll be buying dips (supporting the stock) and selling rips (capping rallies). Expect choppy, range-bound action between $260 support and $265 resistance unless a catalyst breaks the range.
📊 Implied Move-Based Support & Resistance Analysis
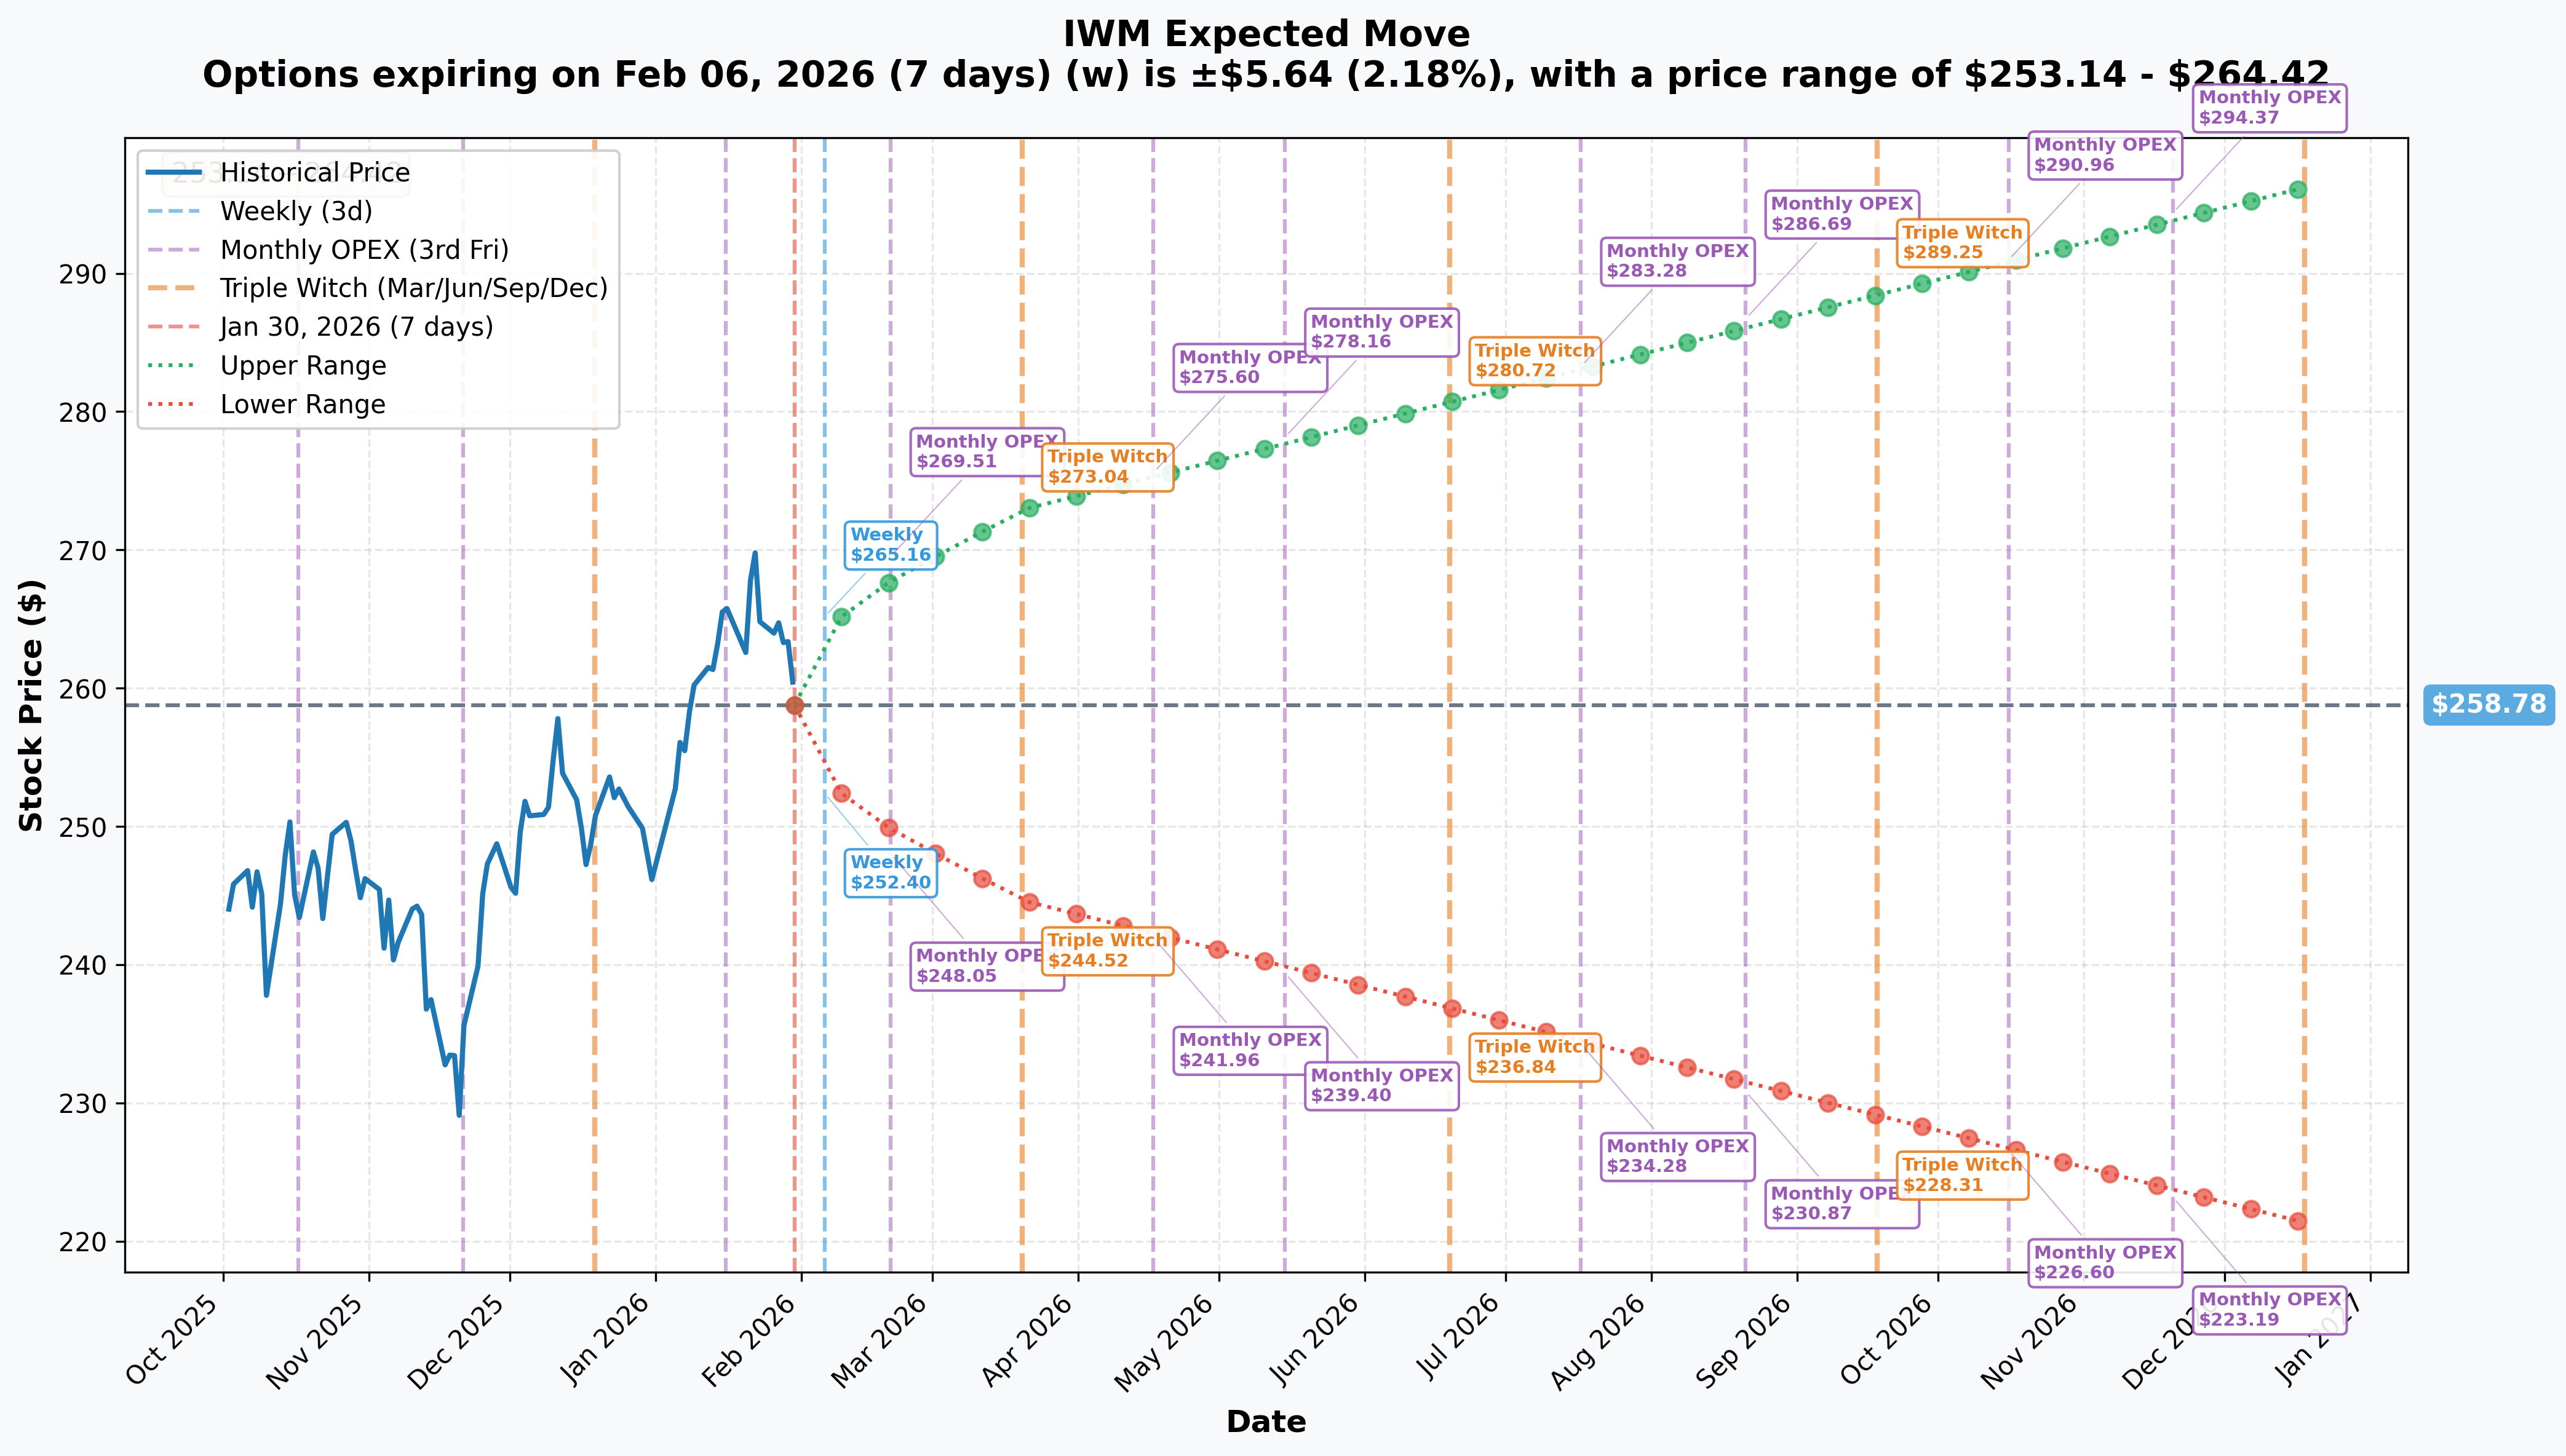
The options market is pricing in these expected moves across key timeframes:
📅 Weekly (February 6, 2026):
- Implied Move: ±$5.64 (±2.2%)
- Expected Range: $253.14 - $264.42
- Reliability: ✅ HIGH
- Translation: Short-term traders expect IWM to stay in a ~$11 range. Pretty calm by small-cap standards.
📅 Monthly OPEX (February 20, 2026):
- Implied Move: ±$9.10 (±3.5%)
- Expected Range: $249.68 - $267.88
- Reliability: ✅ HIGH
- This is the expiration on today's closed trade. The $250 put they just sold was right at the lower edge of the monthly implied range -- they were hedging for a worst-case move, and it didn't happen.
📅 Quarterly Triple Witch (March 20, 2026):
- Implied Move: ±$14.17 (±5.5%)
- Expected Range: $244.61 - $272.95
- Reliability: ✅ HIGH
- The quarterly range captures FOMC meetings, employment data, CPI prints, and the bulk of Q4 earnings season. The upper range ($273) would mean new all-time highs for the Russell 2000.
📅 Yearly LEAPS (December 18, 2026):
- Implied Move: ±$37.47 (±14.5%)
- Expected Range: $221.31 - $296.25
- Reliability: ✅ MODERATE (longer-term = more uncertainty)
- The market sees IWM anywhere from $221 to $296 by year-end. That's a wide range reflecting major macro uncertainty around the Fed leadership transition and tariff policy.
🎯 Key Takeaway: The closed put spread at $250/$248 was hedging for the lower end of the monthly implied move. With IWM now $10+ above the $250 strike and only 21 days to expiration, the odds of that hedge being needed dropped dramatically -- which is exactly why they closed it.
🎪 Catalysts
📆 What's Coming Up (Buckle Up -- It's a Busy Calendar)
🔜 ISM Manufacturing PMI (February 2, 2026)
- January 2026 reading drops Monday morning
- December came in at 47.9 (contraction) -- the 10th straight month below 50
- A reading above 50 would be a big deal for industrials (~14.5% of IWM)
- Employment sub-index has been contracting for 11 consecutive months
📊 Employment Report (February 6, 2026)
- January nonfarm payrolls release
- December was a weak +50,000 jobs with unemployment at 4.4%
- A rebound suggests soft landing intact (bullish for small-caps); another weak print raises recession fears
🔥 CPI Report (February 11, 2026)
- January 2026 inflation data
- December CPI was 2.7% YoY, still above the Fed's 2% target
- Food costs surged 0.7% MoM, fastest since August 2022
- A hot print kills rate cut hopes; a cool print fuels the small-cap rally
🏦 FOMC Meeting (March 17-18, 2026)
- Updated dot plot and economic projections
- Consensus expects a hold, but Wells Fargo sees a possible cut if data softens
- One of the last meetings chaired by Jerome Powell
💰 Q4 2025 Earnings Season (Ongoing through February)
- Russell 2000 blended Q4 earnings growth estimate: +62.5% YoY per LSEG
- But Goldman Sachs warns that 61% consensus is "far too optimistic"
- Key sectors to watch: regional bank margins, biotech pipelines, industrial reshoring
🚨 The Big One: Kevin Warsh Nominated as Fed Chair (TODAY!)
President Trump nominated Kevin Warsh to succeed Jerome Powell when his term expires May 15, 2026. Warsh is a former Fed Governor known for favoring tighter monetary policy, higher real rates, and a smaller Fed balance sheet.
Why This Matters for IWM: Small-cap stocks are the most rate-sensitive segment of the equity market. About 50% of Russell 2000 debt is floating-rate. Each 25bp cut reduces the earnings drag by ~2 percentage points. A hawkish Fed Chair could cap the rate-cut tailwind that's been powering this small-cap rally. Markets took the pick largely in stride so far, but it's worth watching.
📅 Longer-Term Catalysts
The "Great Rotation" is Real:
- Russell 2000 has outperformed the S&P 500 by 8+ percentage points YTD
- Multi-cap fund managers are 60% underweight small-caps -- the lowest since the Global Financial Crisis
- That's a LOT of potential rebalancing inflows still to come
Wall Street Is Pounding the Table:
- Bank of America: "Cheap, under-owned, and set for faster earnings growth." Projects ~9% annualized returns for small-caps over the next decade
- Goldman Sachs: Year-end Russell 2000 target raised to 2,825 (~10% upside)
- JPMorgan: "Convinced" 2026 is the year to overweight small- and mid-cap stocks
FTSE Russell Semi-Annual Reconstitution (June 2026):
- Shifting from annual to semi-annual rebalancing in 2026
- Expect increased trading volume and short-term volatility in IWM
M&A Acceleration:
- More lenient antitrust environment is driving a surge in small-cap acquisitions
- Big Pharma patent cliff + record PE dry powder = more Russell 2000 companies getting acquired
🎲 Price Targets & Probabilities
🐂 Bull Case: $270-$275 (3.5%-5.4% upside)
How We Get There:
- ✅ Q4 earnings beat even modest expectations (remember, the 62.5% consensus is likely too high, but even 30-40% growth would be solid)
- ✅ February jobs report shows labor market stabilizing (not too hot, not too cold)
- ✅ CPI comes in at or below 2.7%, keeping rate cut hopes alive
- ✅ Institutional money finally starts rotating into small-caps (remember that 60% underweight)
- ✅ Tariff truce extended or trade deal progress
Key Gamma Levels to Break:
- Clear $265 resistance (strongest wall at 142 gamma)
- Push through $270 (psychological level + January high zone)
- Target $273-$275 (new all-time highs for the Russell 2000)
Probability: 30%
The quarterly implied move shows $273 as the upper range by March 20. Goldman's year-end target of 2,825 (~$280 IWM) supports this trajectory. The fact that today's institutional trader removed their downside hedge is a vote of confidence.
🎯 Base Case: $258-$266 Range (±1-2%)
Most Likely Scenario:
- 📊 Q4 earnings come in mixed (some beats, some misses, growth below consensus but still positive)
- 💰 Fed stays on hold, Warsh nomination doesn't spook markets
- 📉 Macro data is noisy but not alarming
- ⏳ Rotation continues at a moderate pace
Key Support/Resistance:
- $260 anchor -- Strongest gamma support right below current price
- $265 ceiling -- Strongest gamma resistance overhead
- Expect the stock to bounce between these two levels without a strong catalyst
Probability: 45%
This is what the weekly implied move (±2.2%) is telling us. With bearish net GEX bias, expect dealers to buy dips and sell rallies, keeping IWM range-bound. The monthly OPEX range of $249.68-$267.88 centers right on this zone.
🐻 Bear Case: $248-$255 (-2.2% to -4.9% downside)
How Things Go Wrong:
- ❌ Q4 earnings badly miss the already-optimistic consensus
- ❌ Hot CPI print kills March rate cut expectations
- ❌ Jobs report shows further deterioration (recession fears)
- ❌ Warsh confirmation signals aggressive hawkish pivot
- ❌ Tariff truce expires, trade tensions escalate
- ❌ About 40% of Russell 2000 companies are unprofitable -- they can't survive tighter financial conditions
Key Support Levels:
- $255 -- First line of defense (gamma: 155)
- $250-$251 -- Deep support zone (gamma: 191 + 96)
- $248 -- This is right where today's closed spread had its lower strike
- $245 -- Last resort (gamma: 90)
Probability: 25%
The monthly implied move shows $249.68 as the lower range -- basically the $250 level where today's put spread was centered. If we get there, it would represent a ~4% drawdown from current levels. The fact that the institutional trader closed their $250/$248 hedge today suggests they don't think this scenario is likely, but it's still very much on the table if macro data deteriorates.
💡 Trading Ideas
🛡️ Conservative: Sell the February Put Spread Below Gamma Support
The Play:
- Strategy: Sell Feb 20 $255 Put, Buy Feb 20 $250 Put
- Premium Collected: ~$1.00-$1.30 per spread
- Capital Required: $500 per spread (difference between strikes)
- Max Profit: Premium collected (20-26% return in 21 days)
- Max Loss: $370-$400 per spread (if IWM crashes below $250)
Why This Works:
- ✅ Both strikes are below the strongest gamma support at $260
- ✅ $255 has meaningful gamma support (155), $250 has even more (191)
- ✅ Today's institutional trader just said they don't think we're going below $250
- ✅ Monthly implied move lower range is $249.68 -- your short strike at $255 has cushion
- ✅ Time decay is your friend with only 21 days to expiration
Best For: Income-oriented traders who agree with the institutional view that the $250 area isn't at risk near-term.
⚖️ Balanced: Bull Call Spread Targeting $265 Resistance Break
The Play:
- Strategy: Buy Feb 20 $261 Call, Sell Feb 20 $265 Call
- Net Cost: ~$1.50-$1.80 per spread
- Max Profit: $4.00 per spread minus premium paid (~$2.20-$2.50 per spread)
- Max Loss: Premium paid ($150-$180 per spread)
Why This Works:
- 🎯 Entry at $261 (just above strongest support at $260)
- 🚀 Target at $265 (strongest resistance -- if we break through, there's room to run)
- 📊 Institutional money removing downside hedges = potential for more upside flows
- 📅 Feb 20 expiration captures jobs report, CPI, and more Q4 earnings results
Best For: Mildly bullish traders who think the rotation into small-caps continues but want defined risk.
🚀 Aggressive: Long March Calls Targeting New All-Time Highs
The Play:
- Strategy: Buy March 20 $270 Calls
- Cost: ~$2.50-$3.50 per contract
- Target: $275+ (new ATH territory)
- Risk: 100% of premium if IWM stays below $270
Why This Works:
- 💪 The "Great Rotation" into small-caps is backed by major Wall Street firms
- 📊 Goldman's year-end target of 2,825 implies ~$280 IWM
- 🏦 March expiration captures FOMC meeting with updated dot plot
- 💰 If even a fraction of the 60% institutional underweight gets rebalanced, flows could be massive
- 📅 Quarterly implied move upper range is $272.95 -- right in the strike zone
Best For: Traders with conviction in the small-cap rotation thesis who want leveraged upside exposure. This is a binary bet -- either the rotation accelerates and you win big, or it stalls and you lose your premium.
Risk Management: If IWM breaks below $258 with volume, consider cutting the position to preserve capital. The trade thesis depends on the rotation continuing.
⚠️ Risk Factors
📉 Inflation Persistence (WATCH CLOSELY)
CPI is stuck at 2.7% YoY -- well above the Fed's 2% target. Food costs accelerated at the fastest monthly pace since August 2022. Moody's estimates true inflation may be closer to 3%. If inflation re-accelerates from tariffs or shelter costs, the Fed pauses rate cuts indefinitely -- and the small-cap trade unwinds fast.
🏦 Fed Leadership Transition
Warsh's historically hawkish stance could reduce the probability of future rate cuts. And his confirmation isn't even guaranteed -- Senator Thom Tillis has indicated he'll block Fed nominees until a DOJ probe is resolved. Policy uncertainty is the enemy of small-cap stocks.
📊 Earnings Expectations Way Too High
Let's be honest -- Goldman Sachs explicitly warned that the consensus 61% Q4 EPS growth for the Russell 2000 appears "far too optimistic." Revenue growth is estimated at only +4.0% YoY. If earnings disappoint, the rotation trade could reverse quickly.
🏭 Manufacturing Still in Contraction
ISM Manufacturing PMI at 47.9 with 10 consecutive months below 50. The employment sub-index at 44.9 marks 11 straight months of contraction. That's a headwind for the ~14.5% of IWM allocated to industrials.
💸 Quality Concerns
About 40% of Russell 2000 companies don't make money. In a downturn, those companies face amplified pressure from reduced capital access and inability to service debt. This isn't a risk you face with large-cap indices.
🌍 Tariff Escalation
The 90-day U.S.-China tariff truce could expire without renewal. The April 2025 tariff shock sent IWM from highs to a near-bear-market bottom at $171.73 -- a ~41% peak-to-trough drawdown. Small-caps are more sensitive to trade policy than large-caps because they lack pricing power and have more domestic supply chain exposure.
💧 Fund Flows Disconnected from Price
Despite the strong rally, IWM has seen -$2.75 billion in outflows over the past month. The rally has been driven more by existing holders and short covering than new institutional allocation. If the buying pressure is thin, any negative catalyst could trigger sharper selling.
🎯 The Bottom Line
Real talk: This $13.5M bear put spread closure is a quiet but meaningful signal. An institutional trader who had been hedging for a drop to $250 just took that hedge off with IWM trading at $260+. They're not adding downside protection -- they're removing it. In options-speak, that's reducing net short delta and expressing less concern about near-term downside.
Here's Your Action Plan:
✅ If You Own IWM or Small-Cap Stocks:
- $260 is your line in the sand -- Strongest gamma support sits right here. As long as we hold this level, the bulls are in control.
- Watch the February data -- Jobs report (Feb 6), CPI (Feb 11), and Q4 earnings will set the tone for the next move
- Don't panic about Warsh -- His nomination doesn't change Fed policy until May at the earliest. The FOMC is a committee, and one chair can't unilaterally shift rates.
👀 If You're Watching From The Sidelines:
- The rotation is real -- BofA, Goldman, JPMorgan all calling for small-cap outperformance. Fund managers are 60% underweight. There's a lot of potential buying still to come.
- Wait for a dip to $258-$260 to establish long positions -- that's the gamma support zone
- Consider selling puts at $255 or below to collect premium while waiting for a better entry
📉 If You're Bearish:
- You're fighting the trend -- IWM just came off a 15-day winning streak. Shorting into momentum is painful.
- Your best setup is waiting for CPI/earnings disappointment. If February data is ugly, that $265 resistance becomes a rejection point.
- The $250 level is where put protection was concentrated. If we break $255 with conviction, the path to $250 opens up.
The Big Picture
The "Great Rotation" into small-caps is the dominant market story of early 2026, and today's trade suggests institutional money is getting more comfortable with the upside. IWM at $260 is sitting right on its strongest gamma support, with $265 as the next target and $270+ opening the door to new all-time highs.
The risks are real -- sticky inflation, a hawkish incoming Fed Chair, overly optimistic earnings expectations, and ~40% unprofitable companies in the index. But the tailwinds are powerful: rate cuts, extreme institutional underweight, and accelerating earnings growth.
One thing's clear: the big money that was hedged for a drop to $250 just said "never mind." That's worth paying attention to.
⚠️ DISCLAIMER: Options trading involves substantial risk and is not suitable for all investors. This analysis is for educational purposes only and does not constitute financial advice. The author may hold positions in securities discussed. Past performance does not guarantee future results. Always conduct your own research and consult with a qualified financial advisor before making investment decisions.
Data Sources: Trade data from proprietary options flow analysis. ETF information from public sources including iShares, Yahoo Finance, and ETF Database. Gamma exposure calculations based on options open interest and standard dealer hedging assumptions. Implied move calculations based on ATM straddle pricing across multiple expirations.