🐻 IWM: $13.6M Bear Put Spread Targets Small-Cap Weakness Into February OPEX!
📅 February 6, 2026 | 🔥 Unusual Activity Detected
🎯 The Quick Take
Someone just dropped $13.6M building a bear put spread on the Russell 2000 ETF — buying 60,000 contracts of the $249 put and selling 60,000 contracts of the $244 put, both expiring February 20 (monthly OPEX). With IWM trading at $261.42, they're paying a net debit of ~$3.6M ($0.59/spread) for $5 of downside exposure. That's a 7.5x reward-to-risk ratio if IWM drops 6.6% to $244 or below by OPEX — and with January CPI landing one week before expiration, the timing is no accident. 👀
🏢 Company Overview
iShares Russell 2000 ETF (~$73B AUM) tracks approximately 1,950 small-cap U.S. stocks through the Russell 2000 Index — the go-to benchmark for America's smaller companies with market caps between $250M and $2B. The ETF is heavily weighted toward Health Care (18.67%), Financials (17.65%), Industrials (17.27%), and Information Technology (14.72%). IWM has been at the center of "The Great Rotation of 2026", surging ~6-7% in January before pulling back, but $4B in January outflows and elevated put/call ratios of 2.0-2.37 suggest institutional hedging is ramping up.
💰 The Option Flow Breakdown
📊 What Just Happened
| Time | Symbol | Side | Buy/Sell | Type | Expiration | Premium | Strike | Volume | OI | Size | Spot | Option Price |
|---|---|---|---|---|---|---|---|---|---|---|---|---|
| 09:36:57 | IWM | ASK | BUY | PUT | 2026-02-20 | $8.6M | $249 | 60,000 | 71,000 | 60,000 | $261.42 | $1.43 |
| 09:36:57 | IWM | BID | SELL | PUT | 2026-02-20 | $5.0M | $244 | 60,000 | 101,000 | 60,000 | $261.42 | $0.84 |
💵 Total Premium: $13.6M (net debit ~$3.6M)
🤓 What This Actually Means
This is a bear put spread — a defined-risk bearish structure targeting a specific downside zone:
🐋 The Trade Breakdown:
- Bought 60,000 Feb 20 $249 puts at $1.43 each on the ASK (aggressive fill) → Paying $8.6M
- Sold 60,000 Feb 20 $244 puts at $0.84 each on the BID (aggressive fill) → Collecting $5.0M
- Net debit: $0.59 per spread ($3.6M total risk)
- Max profit: $4.41 per spread ($26.5M) if IWM at $244 or below at expiration
- Reward-to-risk: 7.5x — this is an extremely skewed payoff
Translation: A whale spent $3.6M betting IWM drops from $261 to below $249 within 14 days. They make the most money if IWM collapses to $244 or lower — that's a 6.6% decline from where the stock was trading. The fact that both legs were filled aggressively (bought on the ASK, sold on the BID) tells you this wasn't someone casually shopping for price — they wanted in immediately. With 60,000 contracts, this is institutional-scale. The volume (60K) vs. open interest (71K on the $249 put, 101K on the $244 put) shows this is a meaningful new position relative to existing activity.
📈 Technical Setup / Chart Check-Up
YTD Performance
IWM surged early in 2026 on the "Great Rotation" trade — the Russell 2000 posted a 13-session win streak through January 21, tying the 2008 record. Since then, the ETF has pulled back as tariff fears and inflation uncertainty crept in.
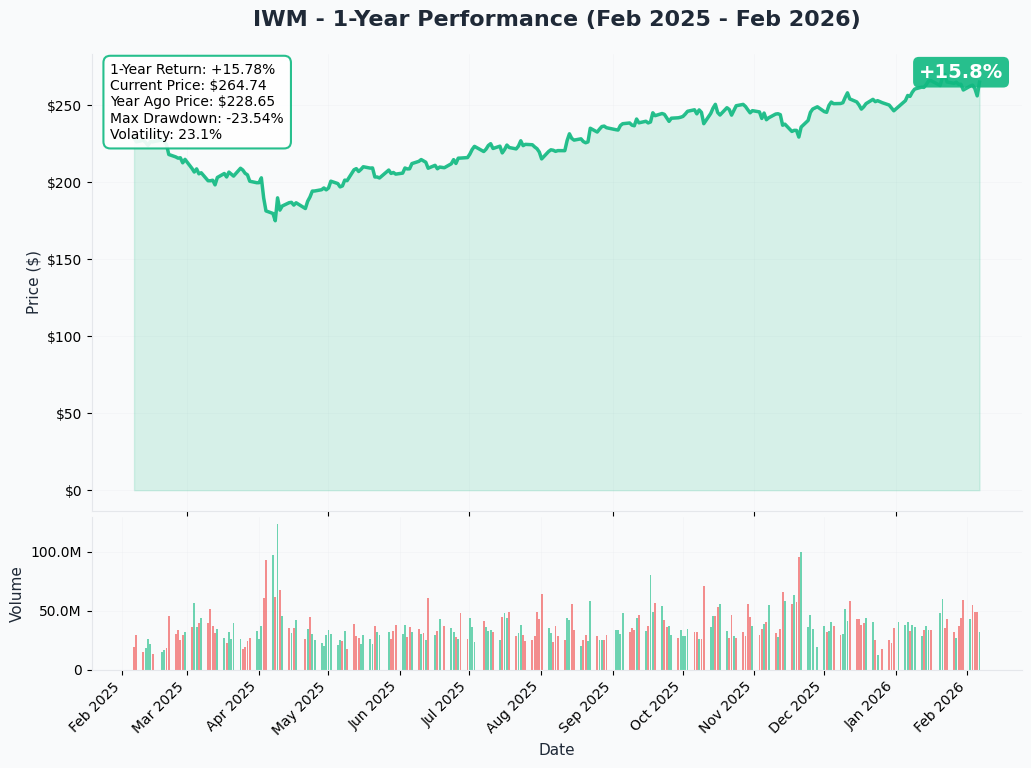
The chart shows the January rally peaking near $271.60 (52-week high) followed by a selloff. Current price action around $261-$264 is trying to find a floor, but the whale's bear put spread suggests more downside ahead.
🔵🟠 Gamma-Based Support & Resistance Analysis
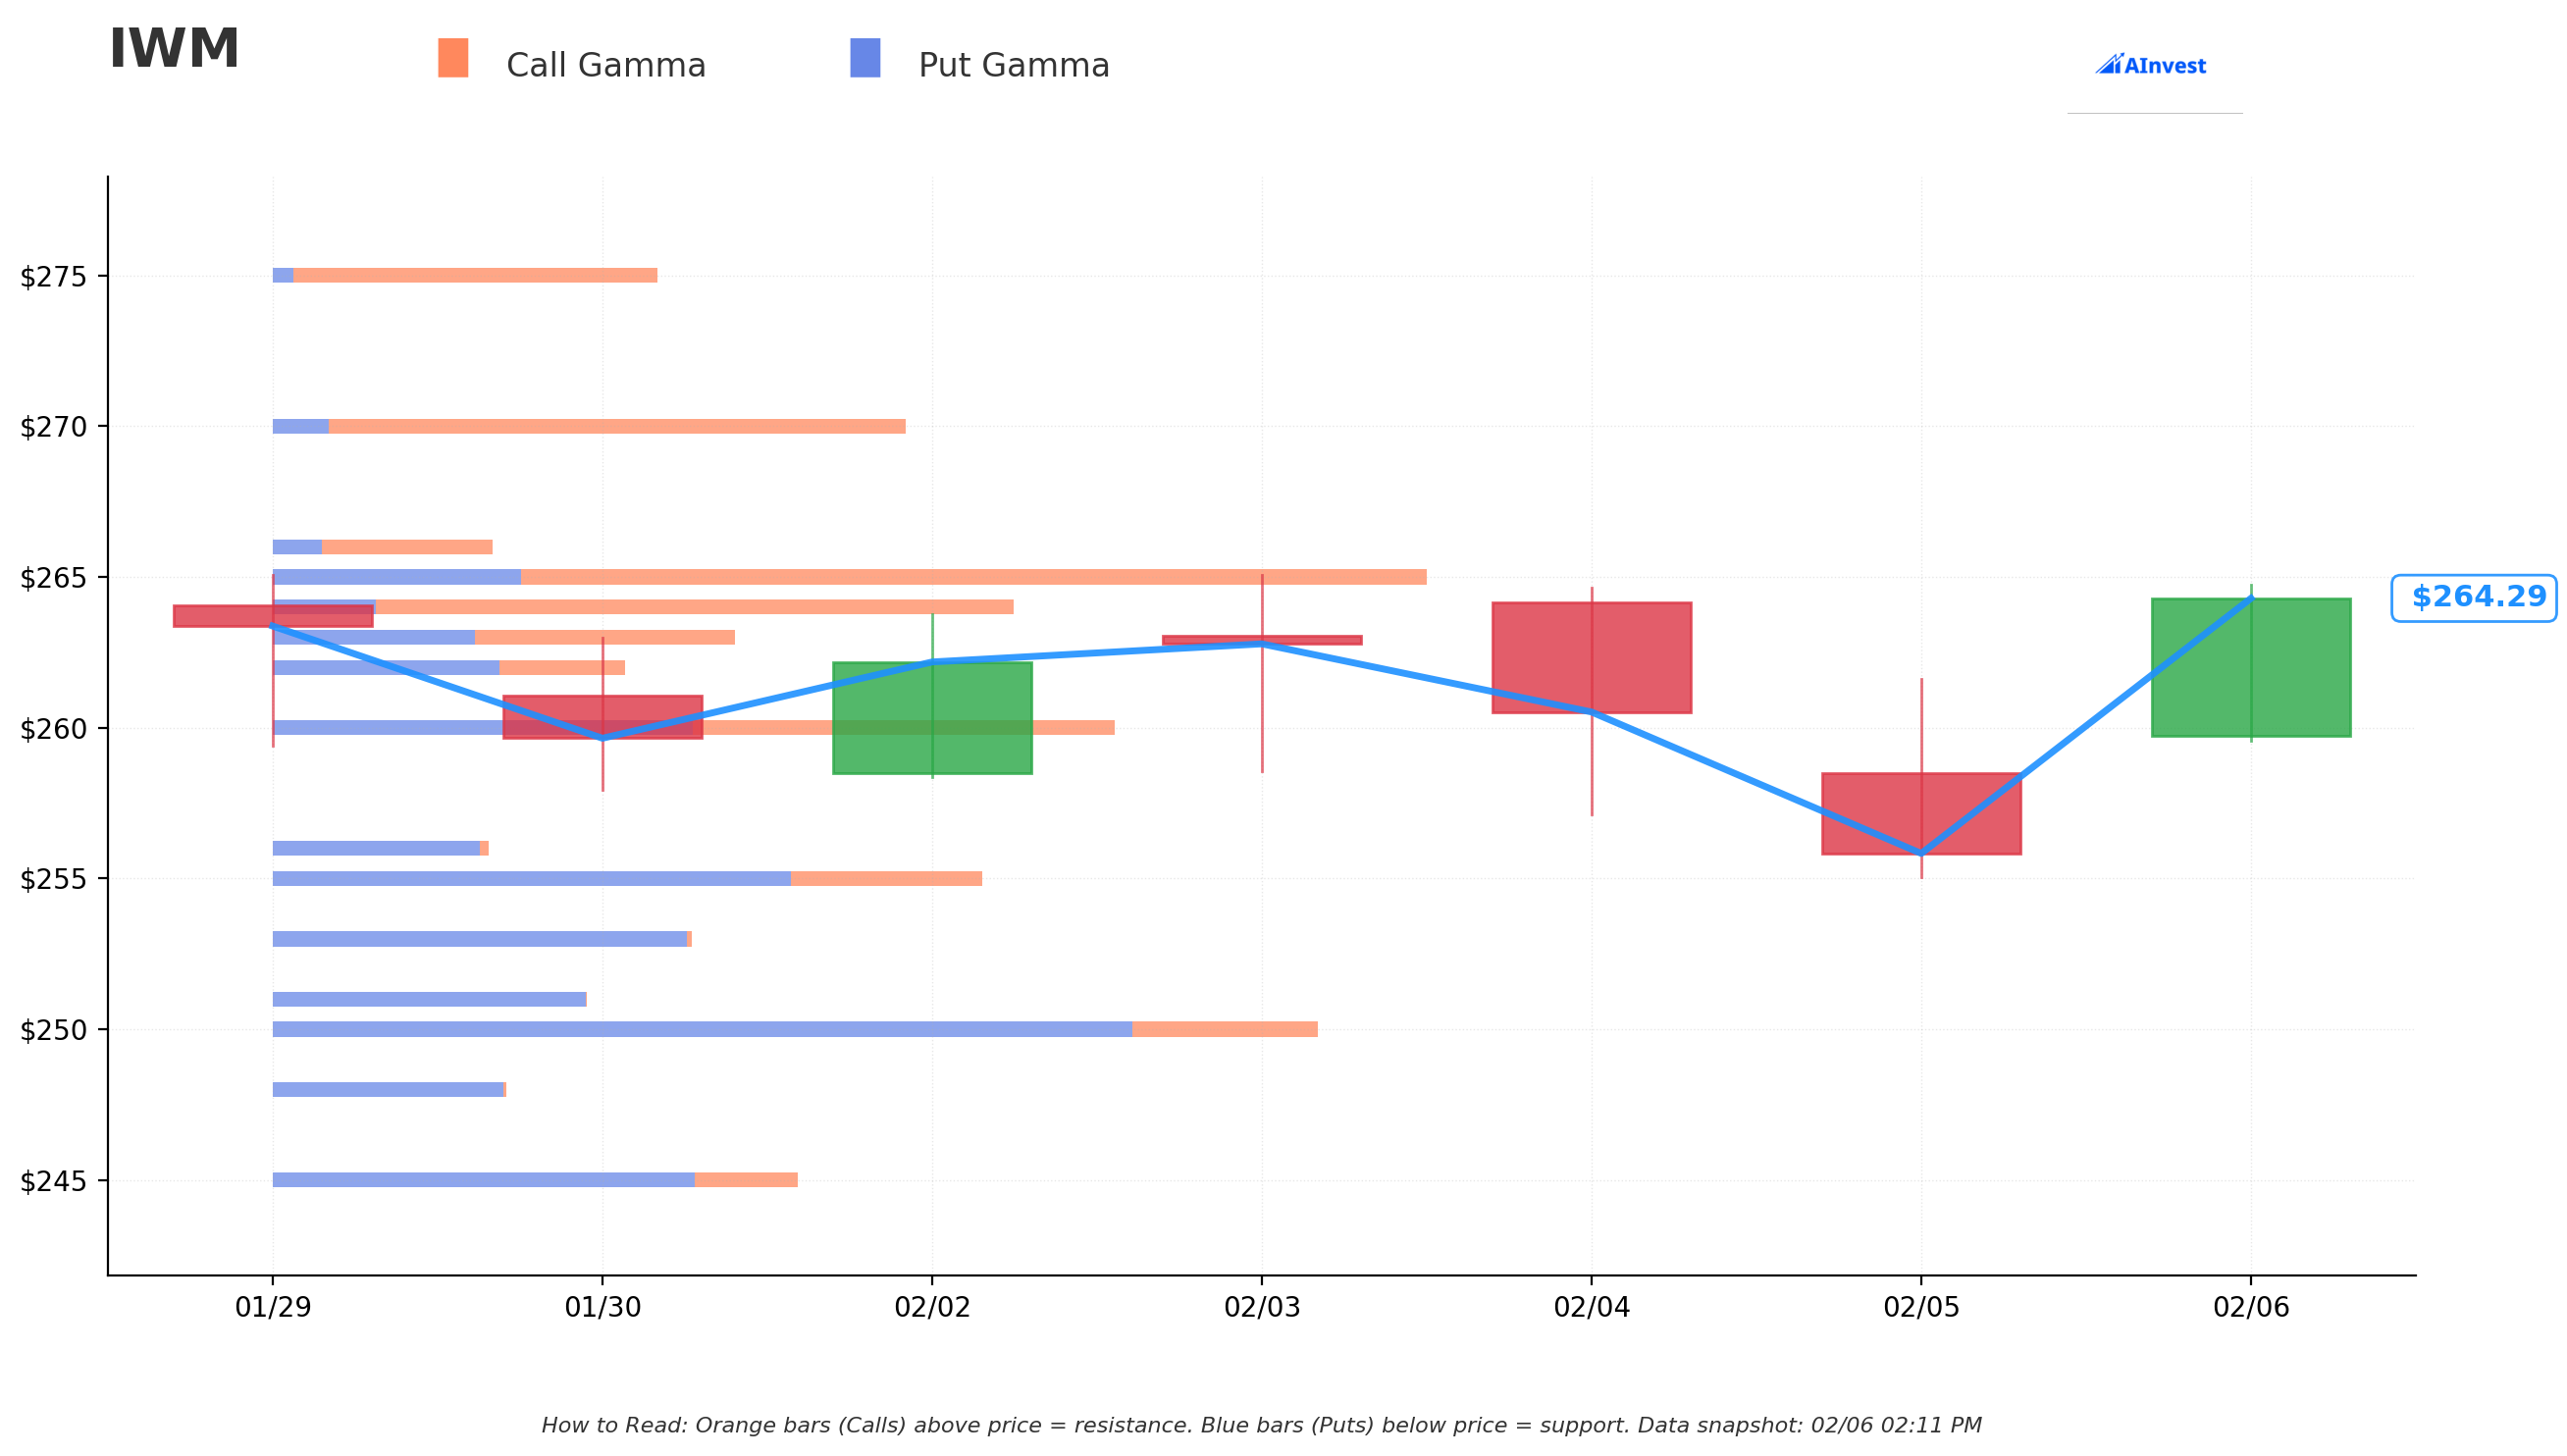
Gamma-Based Support & Resistance Analysis:
The gamma exposure (GEX) profile reveals where market makers have the most hedging exposure — these levels act as magnets and walls for price:
🛡️ Support Levels (Blue Bars):
- $264 — Nearest support, total GEX 130.8. Price is hovering right here
- $260 — Strong gamma zone with total GEX 153.8. Key level to watch on any breakdown
- $255 — Significant put gamma (91.6) with total GEX 125.3. This is where negative gamma starts accelerating
- $250 — Strongest support of all with total GEX 184.9 and massive put gamma (152.2). This is the "line in the sand" — and right in the middle of the whale's bear put spread zone ($244-$249)
- $245 — Total GEX 92.9, aligns with the short put strike ($244)
- $240 — Deep support at total GEX 79.3
🎯 Resistance Levels (Orange Bars):
- $265 — Strongest resistance with total GEX 197.8 and heavy call gamma (154.1). This is the immediate ceiling
- $270 — Secondary resistance at total GEX 111.2. A breakout above here invalidates the bearish thesis
📊 GEX Bias: Bearish — Total put GEX ($1,347.9) exceeds call GEX ($1,095.7), confirming net negative gamma positioning. This means market maker hedging flows will amplify downside moves — selling into weakness rather than buying. This is the environment where sharp selloffs can accelerate.
📊 Implied Move Analysis
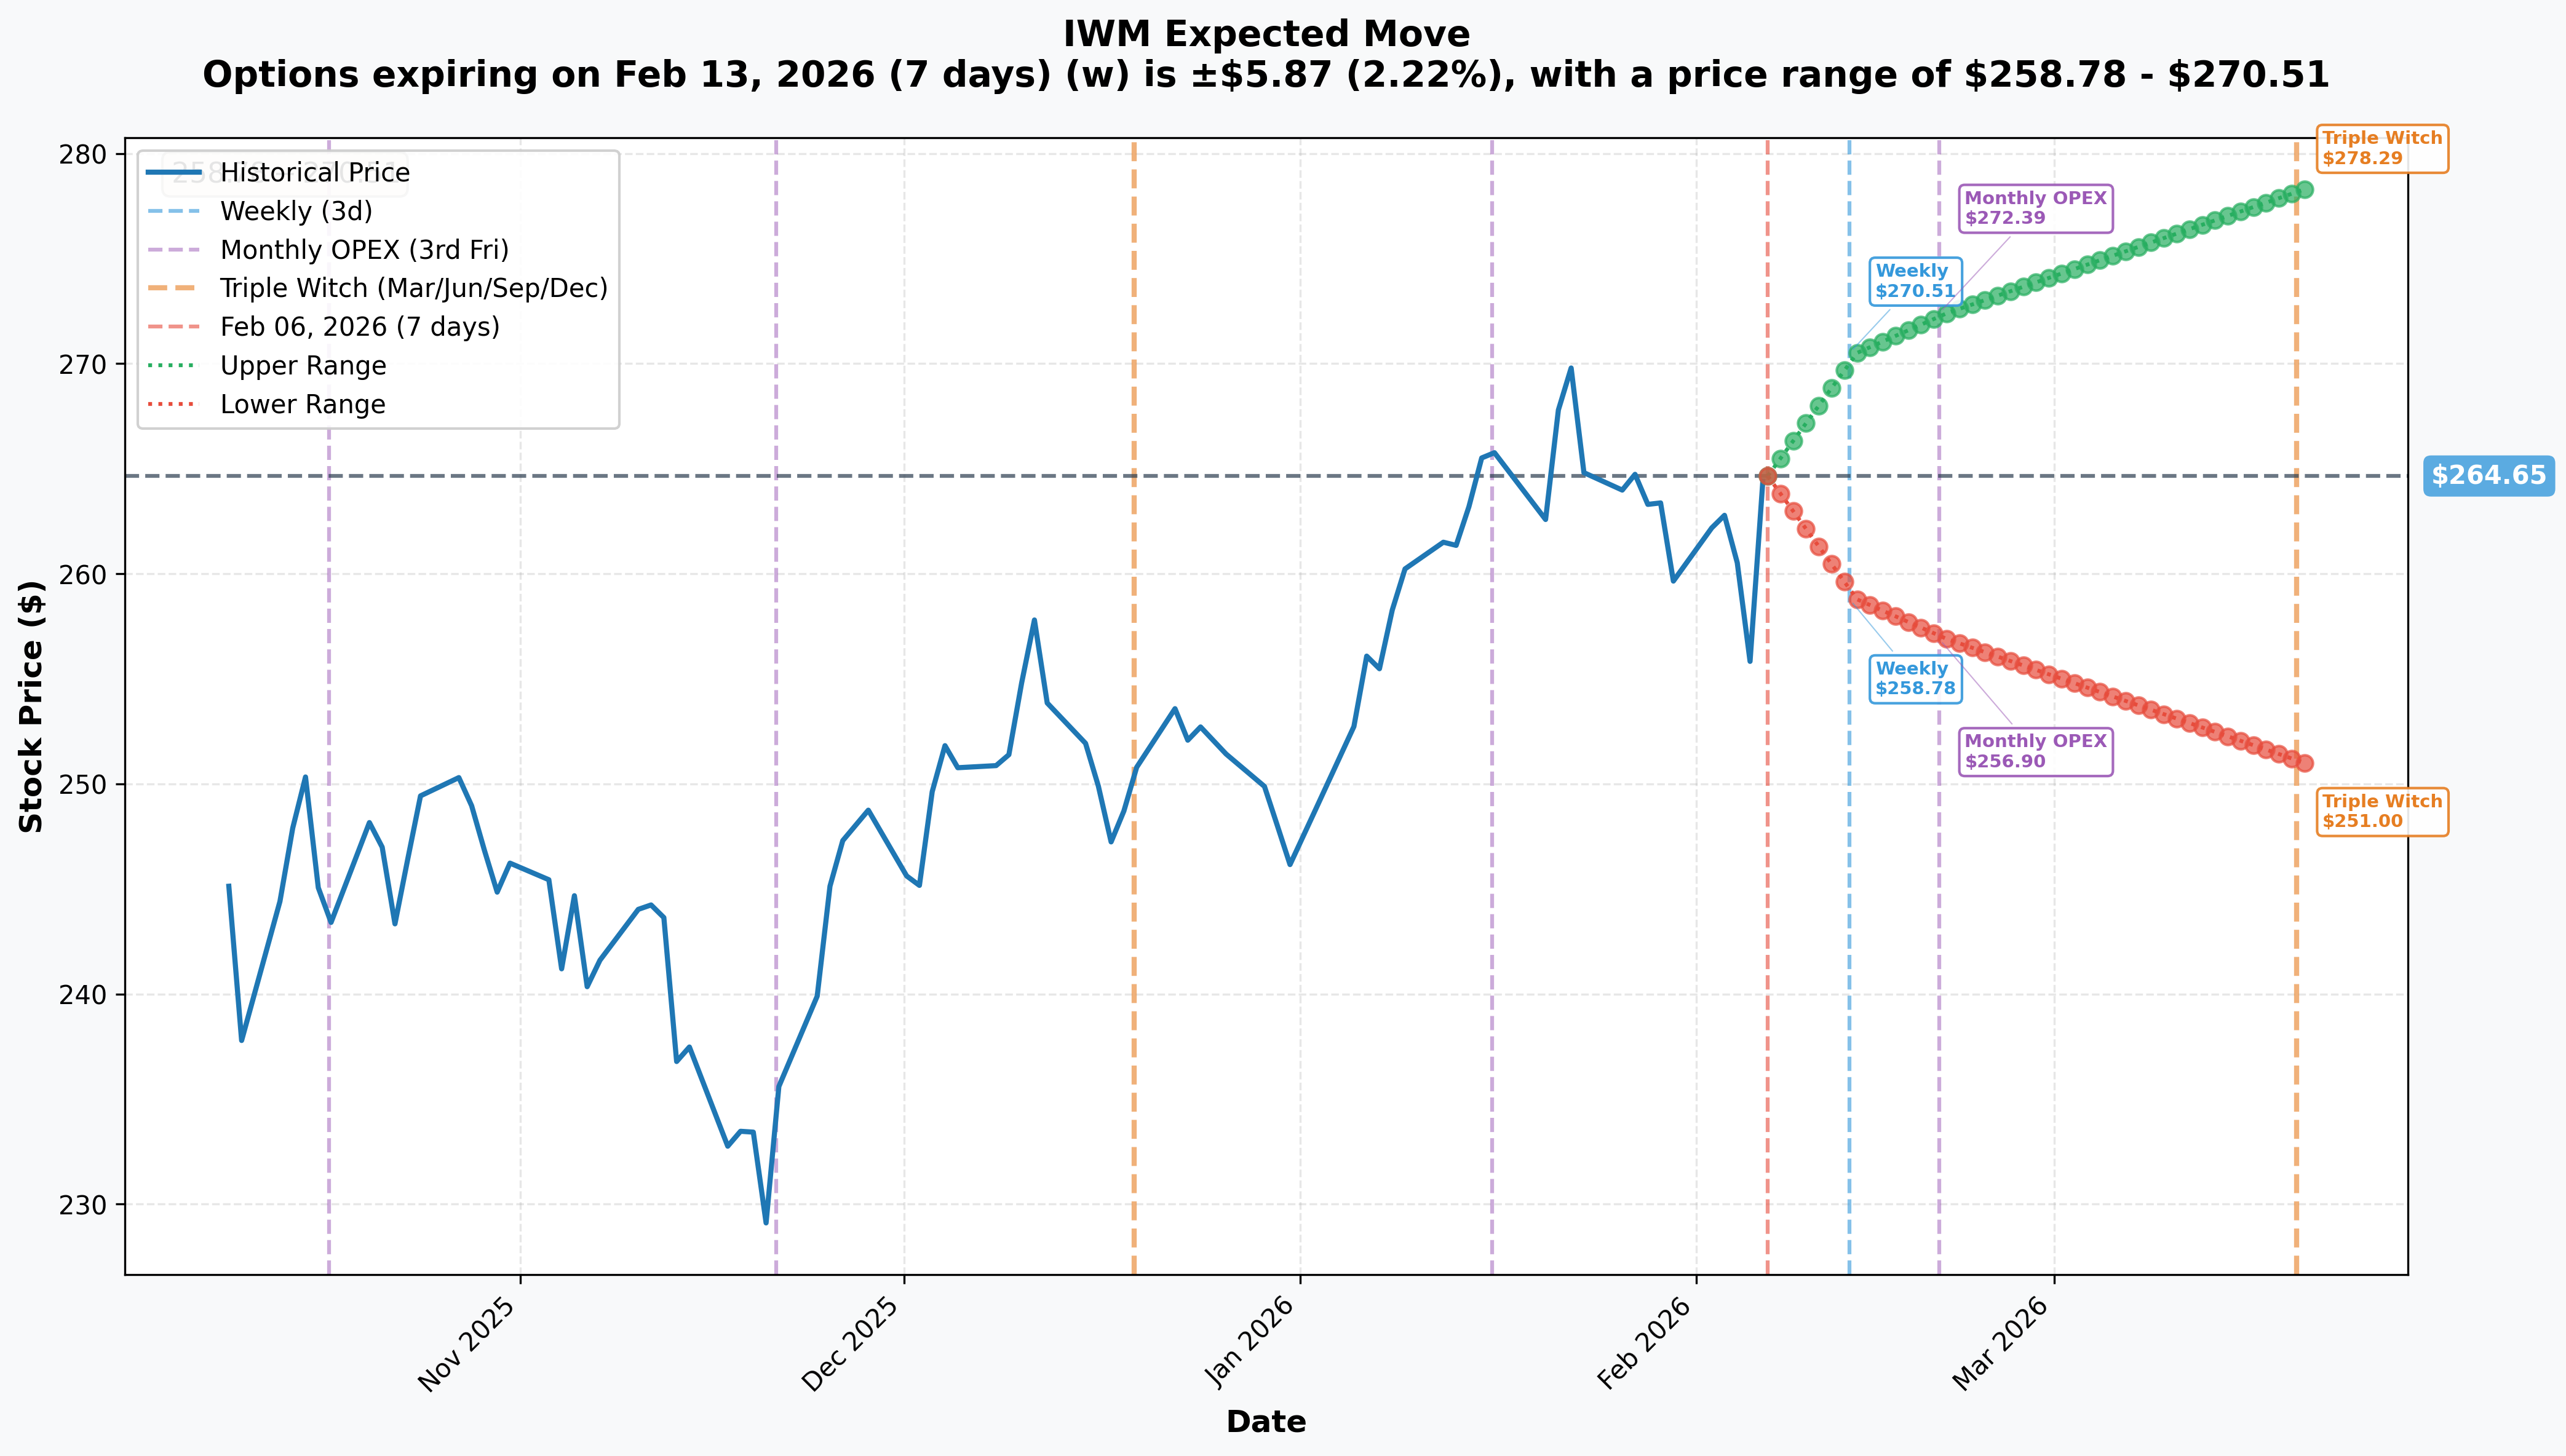
Options-Implied Price Ranges:
| Timeframe | Expiry | Implied Move | Range |
|---|---|---|---|
| 📅 Weekly | 2026-02-13 | ±2.22% ($5.87) | $258.78 - $270.51 |
| 📅 Monthly OPEX | 2026-02-20 | ±2.93% ($7.75) | $256.90 - $272.39 |
| 📅 Triple Witch | 2026-03-20 | ±5.16% ($13.65) | $251.00 - $278.29 |
The whale's $249 long put strike sits below the monthly OPEX implied range floor ($256.90) — meaning the market currently prices only a ~15-20% chance IWM gets there by February 20. That explains the cheap $0.59/spread entry. But here's the thing: the January CPI report drops on February 13 (one week before expiration), and a hot inflation print could blow through these implied ranges fast. The $244 short put aligns closely with the Triple Witch lower bound ($251), suggesting the whale views $244-$249 as a realistic crash zone if CPI surprises to the upside.
🎪 Catalysts
✅ Already Happened (Recent)
- 📊 "The Great Rotation" — Russell 2000 outperformed S&P 500 for 13 consecutive sessions through Jan 21, tying the 2008 record, but has since stalled
- 🏦 Fed Held Rates at 3.50-3.75% (Jan 28) — No surprises, but the Fed signaled patience on further cuts, keeping rate-sensitive small caps in limbo
- 💸 $4B in January IWM Outflows — Despite the rally, institutions were quietly exiting small-cap ETFs, a classic "sell the news" signal
- 📉 Elevated Put/Call Ratio (2.0-2.37) — Heavy hedging activity suggests institutions are paying up for protection
- 💰 Valuation Gap Persists — Russell 2000 forward P/E of ~16x vs. S&P 500 at ~22x per Siblis Research — cheap, but cheap can get cheaper
- 🏛️ OBBBA Bonus Depreciation — 100% bonus depreciation benefiting domestically-focused small caps, but the market already priced much of this in during January
🔮 Upcoming
- 📊 January CPI Report — February 13, 2026 (7 days away!) — This is THE catalyst for this trade. A hot inflation print would crush rate cut hopes and hammer small caps. BLS Schedule
- 🏦 FOMC Meeting with Dot Plot — March 17-18, 2026 — Updated economic projections will shape H1 rate cut expectations. Fed Calendar
- 🏦 FOMC Meeting (First Potential Cut) — April 28-29, 2026 — CME FedWatch prices the first 25bp cut here. If this gets pushed back, small caps suffer. Motley Fool Analysis
- 📈 Small-Cap Earnings Growth — 2026 consensus at 19% vs. large-cap 12% per Franklin Templeton/Royce, but Goldman warns estimates are "far too optimistic"
- 💊 Biotech M&A Wave — $49B YTD deal value with $1T pharma cash earmarked for acquisitions — bullish for IWM's 18.67% healthcare weight
- 🏦 Bank Deregulation — Could release $2.6T in capital, boosting IWM's 17.65% financials weight
- 🔄 Russell Reconstitution Goes Semi-Annual — First-ever November rebalance coming in 2026, reducing tracking error
🎲 Price Targets & Probabilities
Using gamma levels, implied move data, and the CPI catalyst window:
🐻 Bear Case: $244-$249 (20% probability)
- January CPI comes in hot (>3.5% YoY), crushing rate cut expectations
- Break below $260 gamma support triggers accelerated selling in negative gamma territory
- Put GEX dominance ($1,348 vs $1,096 call GEX) amplifies the move lower
- $250 is the strongest gamma support — if that cracks, $245 and $244 come fast
- This is the whale's target zone — max profit on their bear put spread
⚖️ Base Case: $256-$265 (55% probability)
- CPI comes in roughly in-line, no major surprises
- IWM oscillates between $260 gamma support and $265 resistance
- Monthly OPEX implied range of $256.90-$272.39 contains price action
- The whale's $249 put expires with partial value or worthless
- Gamma pinning between $260-$265 keeps things range-bound
🚀 Bull Case: $270-$278 (25% probability)
- CPI comes in cooler than expected, reigniting rate cut hopes
- Breakout above $265 resistance triggers market maker buying (positive gamma)
- "Great Rotation" trade re-ignites with earnings growth (19% small-cap vs 12% large-cap)
- Triple Witch upper range at $278.29 becomes the target
- The whale's spread expires worthless — they lose $3.6M but it was a small hedge
💡 Trading Ideas
🛡️ Conservative: "The CPI Hedge"
- Buy IWM Feb 20 $258/$253 bear put spread ahead of CPI (Feb 13)
- Estimated cost: ~$0.80-1.00 per spread
- Max profit: $4.00-4.20 per spread if IWM drops to $253 or below
- Break-even: ~$257
- Risk: $80-100 per spread | Reward: Up to $420 | R:R = ~4:1
- Why this works: Defined-risk bet that CPI disrupts the small-cap rally. Strikes sit right at the monthly implied move floor — you're betting on a 1-standard-deviation move
⚖️ Balanced: "The Gamma Breakdown Play"
- Buy IWM Feb 20 $260 puts at ~$2.00-2.50
- Target: Sell at $4-5 if IWM breaks below $260 gamma support
- Stop: Close if IWM reclaims $265 resistance
- Risk: $200-250 per contract | Reward: $400-500 on a move to $256 | R:R = ~2:1
- Why this works: The $260 gamma level is the key inflection point. Below it, negative gamma accelerates selling. You're betting on the dam breaking
🚀 Aggressive: "Follow the Whale"
- Buy IWM Feb 20 $249/$244 bear put spread — the exact whale trade
- Current cost: ~$0.59 per spread (may have widened since morning)
- Max profit: $4.41 per spread at $244 or below
- Break-even: $248.41
- Risk: $59 per spread | Reward: Up to $441 | R:R = 7.5:1
- Why this works: You're mirroring a $3.6M institutional bet with defined risk. If CPI is hot and IWM breaks through $250 gamma support, the payoff is massive. But this needs a 6.6% decline in 14 days — it's a long shot with huge payoff
⚠️ Risk Factors
- 📊 CPI Could Be Benign — If January CPI comes in at or below expectations, rate cut hopes revive and IWM rallies toward $270+. The bear put spread goes to zero
- 🔄 "Great Rotation" Resumes — The valuation gap (16x vs 22x P/E) and 19% earnings growth advantage are structural bullish forces that could reassert at any time
- 🏦 Rate Cut Surprise — If any Fed member signals an earlier-than-expected cut, small caps would spike
- ⏰ Time Decay — With only 14 days to expiration, the $249 puts need a sharp move quickly. Theta erodes the position every day IWM stays above $258
- 📉 The Spread is OTM — Both legs are 4.8-6.7% out of the money. The market currently prices ~15-20% probability of reaching $249 by OPEX. This is a low-probability, high-reward trade
- 💊 Biotech M&A Pop — A surprise acquisition premium in IWM's 18.67% healthcare weight could boost the ETF unexpectedly
- 🏭 Gamma Support is Real — The $250 strike has the strongest gamma support (total GEX 184.9). Market makers will buy heavily at that level, creating a floor that's hard to break
🎯 The Bottom Line
Real talk: A whale just spent $3.6M net on a bear put spread targeting a sharp IWM decline to the $244-$249 zone within 14 days. The timing is surgical — they're betting the January CPI report (February 13) will come in hot, crush rate cut expectations, and trigger a small-cap selloff that blows through the $260 and $250 gamma support levels.
The game plan:
- 🟢 If you're bullish on small caps: The gamma structure has strong support at $260 and a wall at $250. Use any dip toward $258-$260 as a buying opportunity, and set stops below $255. The long-term setup — 19% earnings growth, valuation discount, deregulation — is still intact
- 🟡 If you're watching: Mark February 13 (January CPI) on your calendar. That's the make-or-break catalyst. If CPI is tame, the bear put spread dies. If CPI is hot, the selloff could accelerate fast in negative gamma territory
- 🔴 If you're bearish: The 7.5x reward-to-risk on the $249/$244 spread is attractive if you think inflation is the story. But respect the $250 gamma wall — you need a catalyst powerful enough to break it
The whale is betting $3.6M that CPI changes everything. At 7.5:1 odds, they don't need to be right often to make money on trades like this.
⚠️ Disclaimer: This analysis is for educational purposes only and does not constitute financial advice. Options trading involves significant risk of loss. Always do your own research and consider your risk tolerance before trading.