🐋 IWM: $11M Call Selling - Someone's Capping the Small-Cap Rally!
📅 February 24, 2026 | 🔥 Unusual Activity Detected
🎯 The Quick Take
Someone just dumped $11 MILLION in IWM call options - selling 6,000 contracts at the $265 strike with an August expiration. With volume nearly 4x open interest (3.75 Vol/OI ratio), this is likely a massive covered call position or a bearish bet that small caps won't break much higher. This whale is essentially saying: "I'll take the premium and cap my gains at $265."
💰 The Option Flow Breakdown
📊 The Tape
| Time | Option Symbol | Side | Direction | Type | Expiration | Strike | Volume | OI | Premium | Spot |
|---|---|---|---|---|---|---|---|---|---|---|
| 10:25:05 | IWM20260821C265 | MID | SELL | CALL | 2026-08-21 | $265 | 6,000 | 1,600 | $11M | $263.37 |
Option Details:
- 💵 Option Price: $17.87 per contract
- 📊 Vol/OI Ratio: 3.75x (HIGH ACTIVITY)
- 📋 Strategy Detected: Short Call (STANDALONE) - Confidence: LOW
🤓 What This Actually Means
Real talk: When someone sells $11M worth of calls right at-the-money, there are two likely scenarios:
Scenario 1 - Covered Call (Most Likely): An institution holding ~600,000 shares of IWM (worth ~$158M at current prices) is selling calls to generate income. They're collecting that fat $11M premium and agreeing to sell their shares at $265 if IWM closes above that level by August 21. This is a yield enhancement play - they're happy with the gains they've made and want to generate extra income.
Scenario 2 - Naked Short Call (Bearish): A sophisticated trader betting that IWM won't sustainably break above $265 over the next 6 months. They pocket the $11M premium and win if IWM stays below $265. This is a bearish directional bet.
Given the timing amid the "Small-Cap Renaissance" rally and the size of this trade, the covered call interpretation feels more likely - someone locking in gains after the strong YTD performance.
📈 Technical Setup / Chart Check-Up
YTD Performance
IWM has been a winner in 2026, riding the small-cap rotation wave that's seen money flow out of mega-cap tech into smaller companies.
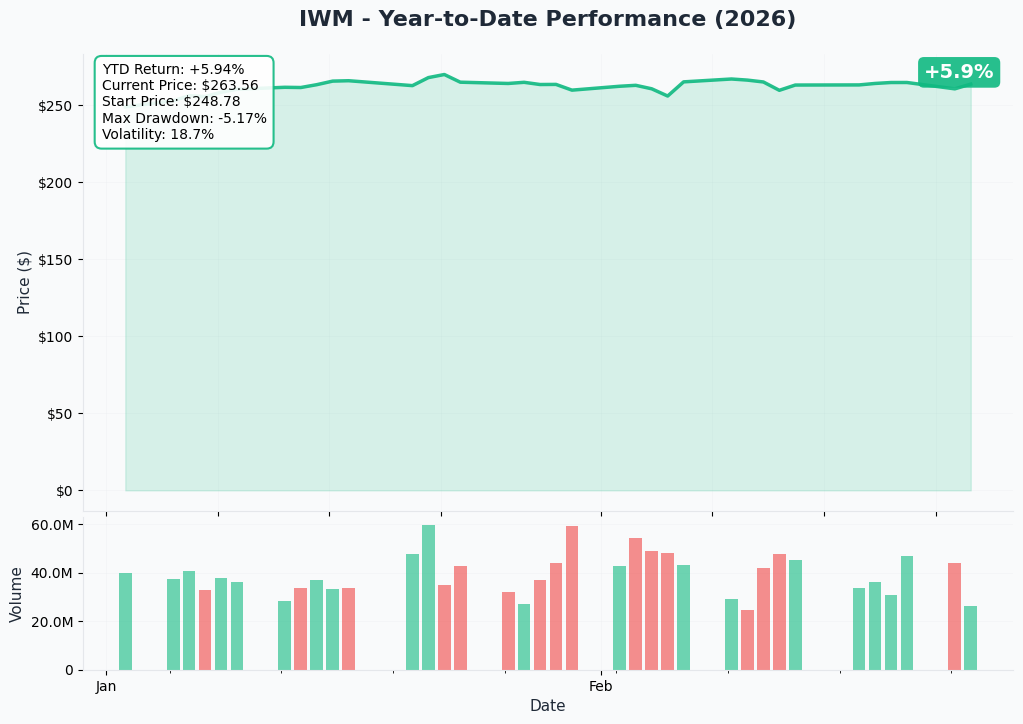
Key Stats from the Chart:
- 📈 YTD Return: +5.9%
- 💰 Current Price: $263.56
- 📉 Max Drawdown: -5.17%
- 🎢 Volatility: 18.7%
- 🏁 Starting Price: $248.78
The chart shows IWM has been trading in a relatively tight range throughout 2026, with the $260-265 zone acting as a consolidation area. Volume has been healthy but not exceptional.
Key Technical Levels
According to Investtech's technical analysis, IWM is showing bullish momentum:
| Level | Price | Significance |
|---|---|---|
| 🛡️ 50-Day MA | ~$262 | Current support level |
| 🛡️ 200-Day MA | ~$260.12 | Major support |
| 🚀 Key Resistance | $265 | Where the big call selling is happening! |
| 🎯 52-Week High | $269.82 | Major resistance overhead |
The $265 Strike Matters: Today's massive call selling at $265 creates a psychological and options-based resistance level. When dealers buy these calls from sellers, they need to hedge by selling stock as price approaches $265 - creating natural selling pressure right at that level.
🎪 Catalysts
📆 Upcoming Events (Watch These!)
| Date | Event | Impact |
|---|---|---|
| March 6, 2026 | Employment Report | High - Small caps are economically sensitive |
| March 11, 2026 | CPI Report | High - Could affect rate cut expectations |
| March 17-18, 2026 | FOMC Meeting | Very High - Rate decision impacts small caps |
| June 2026 | Russell Reconstitution | Annual index rebalancing |
| August 21, 2026 | Option Expiration | The date our $11M bet settles! |
✅ Recent Catalysts (Already Happened)
- 🏆 Small-Cap Renaissance: Small-cap earnings growth exceeded large-cap for the first time in 13 quarters
- 💰 One Big Beautiful Bill Act: Tax relief for small businesses with Section 199A deduction increased to 23%
- 📉 Fed Rate Cuts (2025): Rates down to 3.50%-3.75% range, helping companies with floating-rate debt
- 🔄 Sector Rotation: According to Trade Ideas research, small-cap financials up 25%+, industrials up 22% YTD
🎲 Price Targets & Probabilities
Based on the option activity and technical levels:
🐻 Bear Case: $250 (-5%)
- Probability: 25%
- Trigger: Recession fears materialize (Goldman Sachs estimates 35% recession probability), or tariff policy shocks
- Support Level: 200-day MA at $260, then $250 psychological level
⚖️ Base Case: $260-265 (Range)
- Probability: 50%
- Why: The $11M call selling at $265 creates resistance. With put/call ratios elevated at 2.61, there's hedging activity limiting upside
- Outcome for Option Seller: This is their best case - they keep the full $11M premium
🚀 Bull Case: $285+ (+8%)
- Probability: 25%
- Trigger: Rate cuts resume, earnings growth accelerates to projected 18-22% for small caps
- Note: StockInvest projects $285-309 range with 90% confidence over 3 months
💡 Trading Ideas
🛡️ Conservative: "The Yield Hunter"
Follow the whale - sell covered calls:
If you own IWM shares, consider selling covered calls at $270-275 strikes for August expiration.
- Trade: Sell 1 IWM Aug 2026 $270 Call per 100 shares owned
- Premium: ~$12-14 per share (approximate)
- Breakeven: Share cost minus premium received
- Why it works: If a whale with $11M is doing this at $265, you can sell higher strikes with less risk of assignment
Risk: You cap your upside if IWM rockets higher
⚖️ Balanced: "The Put Spread Protector"
Hedge the rally with a defined-risk bearish position:
- Trade: Buy IWM Aug 2026 $260 Put / Sell IWM Aug 2026 $250 Put
- Cost: ~$3-4 per spread (approximate)
- Max Gain: $10 if IWM closes below $250
- Why it works: If the whale is right that upside is capped, any pullback pays off. Your max loss is limited to the premium paid.
Risk: Loses full premium if IWM stays above $260
🚀 Aggressive: "The Contrarian Bull"
Bet against the whale:
If you think small caps will break through $265 and squeeze higher:
- Trade: Buy IWM Aug 2026 $270 Call
- Cost: ~$10-12 per contract (approximate)
- Why it works: If the small-cap rally continues to $285+, this trade pays off big. You're betting against the institutional call seller.
Risk: High - You lose premium if IWM stays below $270
⚠️ Risk Factors
🔴 Tariff Risk
IWM dropped 21% from December highs during past tariff announcements. Trade policy remains a wildcard.
🔴 Recession Probability Rising
Goldman Sachs puts recession odds at 35%, and JPMorgan CEO Jamie Dimon has warned of increasing economic risks.
🔴 Labor Market Weakness
Only 79,000 jobs generated in Q4 2025 - less than 1/5 of the prior year's pace. Small caps are economically sensitive.
🔴 Fund Outflows
Despite the rally, IWM has seen $1.74B in outflows over the past month. Institutions may be quietly reducing exposure.
🔴 Elevated Put/Call Ratios
The put/call ratio at 2.61 shows heavy hedging activity - smart money is buying protection.
🎯 The Bottom Line
Real talk: This $11M call selling trade tells us something important - despite all the excitement about the "Small-Cap Renaissance," at least one major player is happy to cap their gains at $265 in exchange for immediate premium.
What To Do:
If you're long IWM: Consider selling some calls at higher strikes ($270-275) to generate income like the pros. The $11M whale is essentially saying "I'll take the sure money."
If you're on the sidelines: Wait for a pullback to the $260 support level before initiating new positions. The risk/reward improves if you can buy near the 200-day moving average.
If you're bearish: The elevated put/call ratios and fund outflows support a cautious stance. A put spread offers defined-risk downside exposure.
Key Dates To Mark:
📅 March 6 - Employment Report (labor market health) 📅 March 11 - CPI (inflation expectations) 📅 March 17-18 - FOMC Meeting (rate decision) 📅 August 21 - Option Expiration (when this $11M bet settles!)
📊 About IWM
The iShares Russell 2000 ETF (IWM) tracks small-cap U.S. equities and is one of the most liquid ETFs for gaining exposure to smaller companies.
| Metric | Value |
|---|---|
| Assets Under Management | $75.67B |
| Holdings | 1,937 stocks |
| Expense Ratio | 0.19% |
| Dividend Yield | 1.1% |
| 52-Week Range | $174.70 - $269.82 |
| P/E Ratio (Index) | 18.11 |
Leading Sectors (2026 YTD): Financials (+25%), Industrials (+22%), Energy (double-digit gains)
⚠️ Disclaimer: This analysis is for informational purposes only and should not be considered investment advice. Options trading involves significant risk and is not suitable for all investors. Past performance does not guarantee future results. Always do your own research and consider consulting a financial advisor before making trading decisions.
Analysis generated February 24, 2026 | Data sources: Market data providers, SEC filings, financial research